Democrats' sweep of Congress, including a seven-seat gain that gives them 54 Senate seats, is sending the dollar down 0.5% and gold up about 3% to roughly $4,040 an ounce, though the metal is still down more than 7% for the year. Gold-mining shares are the biggest winners. The gold-miner fund GDX is up 6% before the opening bell, winning back about half of its 12% slide over the previous 20 trading days, and the silver fund SLV is up 5%. The S&P 500 is up about 1% before the open, and Wall Street's fear gauge, the VIX, has dropped to about 18 from 21 at Tuesday's close. Bonds have barely moved, with the 10-year Treasury yield little changed near 4.9%.
A weaker dollar also helps foreign companies whose shares trade in the US. Banks led Europe's Stoxx 600 index higher, and Spanish bank Santander is up 6% in early US trading. Elon Musk's companies are the day's big losers. SpaceX is down 5% and Tesla is down about 5%, together erasing about $180 billion in market value, as investors price in tougher regulation and closer scrutiny of federal aerospace contracts under a Democratic Congress.
Earnings are driving the other big moves. Chipmaker AMD is up 5% after forecasting fourth-quarter revenue above estimates on demand for its AI chips, and networking-gear maker Arista is up 9% after revenue grew nearly 60% to about $3.7 billion, its fastest growth since going public, and it raised its full-year outlook. The broader chip group is moving less: the semiconductor fund SMH is up 1% after an 18% drop over the previous 20 trading days. Danish drugmaker Novo Nordisk is up 5% after sales of its Wegovy weight-loss pill beat expectations and it raised its full-year guidance. Still ahead today: the ADP private-payrolls report at 8:15 a.m. ET, expected to show about 68,000 jobs added in October, down from 90,000 in September; the ISM services survey at 10 a.m.; and results from chipmaker Qualcomm and chip designer Arm after the close.
Democrats won both chambers of Congress, taking 54 Senate seats to 44 for a net gain of seven XTB. The clearest market reaction is in currencies: the dollar index is down 0.5% at 101.37 as of 6:50 AM ET, below its October 14 one-year high of 102.95 CNBC. Spot gold is up 2.9% at $4,040.52 CNBC. Even so, the metal is still down more than 7% for 2026 CNBC. The S&P 500 is up 1.2% before the open. Index implied volatility (Cboe VIX) is at 18.3, down from 20.8 at Tuesday's close.
The companies most exposed to Washington are falling. SpaceX (SPCX) is down 5.4%, wiping out $107 billion of market value, and Tesla (TSLA) is down 4.7%. Investors are pricing in tougher regulation and closer scrutiny of federal aerospace contracts under a Democratic Congress Bloomberg. These are not factor moves. The part of Tesla's move specific to Tesla is -5.7%, and SpaceX's is -5.3%. Both are bigger than the headline drops because the broad market gain is pulling the other way.
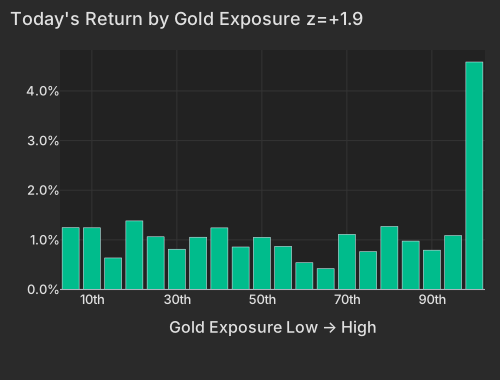
Gold miners are the cleanest way the vote shows up in stocks. GDX is up 6.3% and Gold Fields (GFI) 6.4%, with the silver fund SLV up 4.7% CNBC. Today's move cuts against a slide: GDX had fallen 12.0% over the prior 20 sessions, including 2.0% on Tuesday. That Tuesday drop puts the miners at the center of the day's other pattern. Yesterday's losers are beating yesterday's winners (One-Day Momentum in the table, -0.41% at z=-1.5), and gold miners lead that losing group, up 7.3%.
| Bucket | Avg Ret Pct |
|---|---|
| 1 | 1.25 |
| 2 | 1.24 |
| 3 | 0.64 |
| 4 | 1.38 |
| 5 | 1.06 |
| 6 | 0.81 |
| 7 | 1.05 |
| 8 | 1.24 |
| 9 | 0.86 |
| 10 | 1.05 |
| 11 | 0.87 |
| 12 | 0.54 |
| 13 | 0.42 |
| 14 | 1.11 |
| 15 | 0.76 |
| 16 | 1.27 |
| 17 | 0.98 |
| 18 | 0.79 |
| 19 | 1.09 |
| 20 | 4.58 |
The second group of winners is foreign companies listed in the US. Banks led the Stoxx Europe 600 higher Bloomberg, and their US listings are among the biggest gainers before the open, Santander (SAN) up 6.3%. US-listed international names are beating US-headquartered ones (International +0.43%, z=+1.4). Stocks that usually do most of their trading in the morning, a group that leans international and retail, are ahead too (Morning Activity +0.31%, z=+2.5), with banks leading its top bucket. Both factors point to the same winners: foreign listings that gain when the dollar weakens.
Still, factors explain only a small part of today's moves. So far in pre-market trading, style factors account for 11% of stock-level variance against a 24% one-year norm. The broad market move accounts for 17% against 9%, so the vote is lifting almost everything, and the factor moves above sit at the edges of that broad gain.
| Factor | Return | Z-Score | 5d Z | 20d Z | 63d Z | Category | Direction |
|---|---|---|---|---|---|---|---|
| Gold | +0.62% | +1.9 | +0.2 | -0.2 | +0.6 | Thematic | Gold-exposed names ahead |
| Morning Activity | +0.31% | +2.5 | -0.5 | -0.8 | +0.3 | Style-Flow | Habitually morning-heavy names ahead |
| International | +0.43% | +1.4 | -0.3 | -0.7 | -0.2 | Style-Risk | US-listed foreign names ahead |
| One-Day Momentum | -0.41% | -1.5 | +0.9 | +0.6 | -1.3 | Style-Momentum | Yesterday's losers ahead |
| Short-Sale Activity | -0.20% | -1.8 | +0.1 | +0.1 | +0.7 | Style-Flow | Barely short-sold beat most short-sold |
| Dividend Yield | -0.19% | -1.1 | -1.6 | -0.5 | -0.2 | Style | High yielders lagging |
| Hedge-Fund Ownership | +0.12% | +1.1 | +1.3 | 0.0 | -0.4 | Style-Positioning | Hedge-fund-heavy names ahead |
| Beta | +0.47% | +0.5 | -1.9 | -2.7 | -1.1 | Style-Risk | High-beta names slightly ahead |
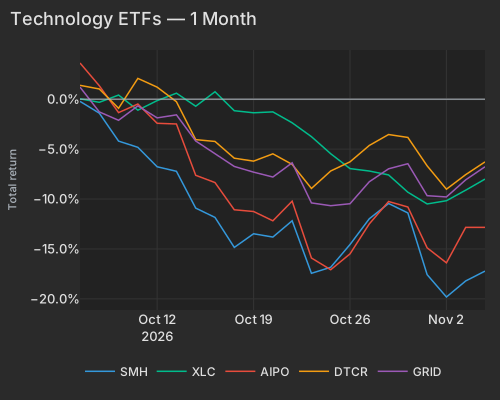
The 10-year Treasury yield is down 1.9 basis points at 4.931% CNBC. The 2-year yield is up 0.9 basis points at 4.623%, so all of the decline is at the long end CNBC. TLT is up 0.4%, about what the yield move alone implies. Over the past two weeks, chip stocks (SMH) fell 5.1% while the 10-year yield fell about 17 basis points. Chips and yields have tracked each other more closely than in all but about 2% of 20-session stretches since 2019.
| ETF | Theme | Today | 1d Ago | 5d Ago | 20d Ago | 63d Ago |
|---|---|---|---|---|---|---|
| GDX | gold miners | +6.3% | -2.0% | -6.7% | -12.0% | -7.3% |
| SLV | silver | +4.7% | -1.6% | -8.8% | -19.1% | -20.0% |
| KWEB | China internet | +2.6% | -0.3% | +0.7% | -5.1% | -18.4% |
| FEZ | Europe | +2.1% | -0.3% | -0.2% | -2.4% | -8.3% |
| SPY | large cap | +1.2% | +0.3% | -2.0% | -3.2% | -1.8% |
| SMH | semiconductors | +1.0% | +2.0% | -7.1% | -18.0% | -9.0% |
| USO | oil | -1.2% | +0.8% | -3.5% | +9.2% | +37.7% |
| VXX | volatility | -5.1% | -2.0% | +4.2% | +12.7% | -8.0% |
AMD is up 5.1% after forecasting fourth-quarter revenue above estimates on demand for its AI accelerators Bloomberg. Arista Networks is up 9.4% after third-quarter revenue grew 58.5% to $3.66 billion, its fastest growth since its IPO, and it raised its full-year guidance. The rest of the group is not following. SMH is up 1.0% after an 18.0% drop over the prior 20 sessions. High-beta stocks are only slightly ahead (Beta +0.47%, z=+0.5) after losing 11.80% over 20 sessions.
| T | SMH | XLC | AIPO | DTCR | GRID |
|---|---|---|---|---|---|
| 2026-10-06 | -0.22 | 0.04 | 3.62 | 1.39 | 1.21 |
| 2026-10-07 | -1.40 | -0.31 | 1.35 | 1.02 | -1.27 |
| 2026-10-08 | -4.20 | 0.41 | -1.35 | -0.91 | -2.11 |
| 2026-10-09 | -4.82 | -1.10 | -0.48 | 2.08 | -0.67 |
| 2026-10-12 | -6.77 | -0.14 | -2.42 | 1.20 | -1.87 |
| 2026-10-13 | -7.22 | 0.60 | -2.48 | -0.26 | -1.57 |
| 2026-10-14 | -10.91 | -0.71 | -7.63 | -4.05 | -4.19 |
| 2026-10-15 | -11.84 | 0.74 | -8.35 | -4.23 | -5.49 |
| 2026-10-16 | -14.85 | -1.16 | -11.08 | -5.91 | -6.74 |
| 2026-10-19 | -13.48 | -1.36 | -11.25 | -6.20 | -7.31 |
| 2026-10-20 | -13.81 | -1.27 | -12.18 | -5.47 | -7.80 |
| 2026-10-21 | -12.18 | -2.37 | -10.21 | -6.53 | -6.38 |
| 2026-10-22 | -17.44 | -3.75 | -15.91 | -8.94 | -10.39 |
| 2026-10-23 | -16.83 | -5.47 | -17.08 | -7.19 | -10.67 |
| 2026-10-26 | -14.56 | -6.95 | -15.49 | -6.28 | -10.47 |
| 2026-10-27 | -11.98 | -7.19 | -12.49 | -4.64 | -8.27 |
| 2026-10-28 | -10.45 | -7.59 | -10.25 | -3.54 | -6.97 |
| 2026-10-29 | -11.39 | -9.32 | -10.80 | -3.83 | -6.46 |
| 2026-10-30 | -17.58 | -10.49 | -14.89 | -6.68 | -9.66 |
| 2026-11-02 | -19.81 | -10.17 | -16.39 | -9.01 | -9.79 |
| 2026-11-03 | -18.20 | -9.11 | -12.84 | -7.55 | -8.08 |
| 2026-11-04 | -17.22 | -8.00 | -12.84 | -6.28 | -6.77 |
Skyworks (SWKS) shows what a weak outlook costs. It is down 14.9% after guiding December-quarter revenue to $1.8–1.9 billion, a roughly 7% sequential decline tied to soft Android smartphone demand Bloomberg.
Background: our research note Factor Fingerprints of Hedge Fund Deleveraging Events compares October with 31 hedge-fund deleveraging events since 2020.
October left less risk in hedge-fund books and in lower-quality credit. Goldman Sachs Prime Brokerage data for October show clients cut net leverage by 4.2 percentage points to 73.4%, the steepest monthly drop in seven months, and judging by HYG prices, high-yield spreads are roughly 40 basis points wider over the past month, while the investment-grade estimate is within the method's noise. So far today, stocks heavily owned by hedge funds are only slightly ahead (Hedge-Fund Ownership +0.12%, z=+1.1).
Earnings reactions in early tradingReporters worth over $100 billion, or moving more than 10% with a value above $5 billion
| Company | Move | Stock-specific | Market cap | What drove it |
|---|---|---|---|---|
| CVS Health CVS | -1.7% | -1.2% | $117B | — |
| Booking BKNG | -0.8% | -2.3% | $117B | — |
| McDonald's MCD | +0.1% | -0.7% | $186B | — |
| Amgen AMGN | +0.7% | +0.2% | $249B | — |
| Uber Technologies UBER | +2.0% | -0.02% | $136B | — |
| Novo Nordisk NVO | +5.0% | +3.0% | $177B | Wegovy pill sales beat; full-year guidance raised The Wall Street Journal |
| Advanced Micro Devices AMD | +5.1% | +4.3% | $790B | Q4 revenue forecast above estimates on AI demand Bloomberg |
| Arista Networks ANET | +9.4% | +8.0% | $214B | 58.5% revenue growth; full-year guidance raised |
Stock-specific: the part of a stock's move not explained by the market, style or thematic (industry and theme) factors in the FactorPulse risk model.
The ADP National Employment Report is due at 8:15 AM ET adpemploymentreport.com. FXStreet and TradingKey consensus estimates call for 67,000 to 69,000 private-sector jobs in October, down from 90,000 in September. The ISM Non-Manufacturing index is due at 10:00 AM ET, with consensus at 54.8 to 55.0. Its prices-paid gauge reached 74.0 in September, the highest since mid-2022.
Variance decomposition: live intraday — 20261104 session, bracketed against its trailing-year range. Factor returns are trailing through last close. Total cross-sectional dispersion: 41%ile of the past year.
Variance mix — % of total, today vs 1d ago vs 1-yr avg
market 85%ile style 20%ile thematic 58%ile idiosyncratic 47%ile
Variance explained — today vs. factor's trailing-year range
Marker = the factor's share of today's total variance, placed in its own trailing-year range (box 25–75%ile, ticks 90%ile and max). Amber marker = unusually load-bearing today (≥90%ile of its own year). Factor name green = up today / red = down.
Correlation & dispersion — realized vs implied
Pairwise realized correlation (20d): 8.55% 5.7%ile since 2020 · 48%ile 3m
Top-500 pairwise: 9.85% 7.7%ile since 2020 · 30%ile 3m · implied (Cboe COR1M): 16.39 14%ile since 2006 (gap -6.5pp)
Realized 20d vol (ann. pts): all stocks 46 vs VIXEQ 43 · index 11 vs VIX 18 · style factors 27 90.9%ile
20-day window (19 completed days + today); percentiles vs model history since 2020; '3m' tokens rank vs the trailing 63 trading days; definitions in Terms below. Implied prints (Cboe) are delayed ~15 min. as of 06:40 ET
High-beta momentum cohort (eq-wt, since-2020 rank): +2.0% 80%ile · rest of market +0.8%
| Factor | Today | 1d | 5d | 20d | 60d |
|---|---|---|---|---|---|
| Style-Risk | |||||
| International | +0.43% z+1.4 | -0.36% | -0.20% | -0.98% | -0.29% |
| Beta | +0.47% z+0.5 | +1.73% | -4.15% | -11.80% | -8.94% |
| Residual Volatility | -0.10% z-0.2 | +0.29% | -1.55% | -1.95% | +0.75% |
| Style | |||||
| Dividend Yield | -0.19% z-1.1 | -0.12% | -0.64% | -0.41% | -0.36% |
| Value | +0.15% z+0.7 | -0.13% | +0.40% | +0.22% | +0.26% |
| Leverage | -0.07% z-0.4 | +0.04% | +0.57% | +0.00% | -1.64% |
| Growth | +0.05% z+0.2 | +0.15% | -0.24% | -1.05% | -0.38% |
| Liquidity | -0.05% z-0.2 | +0.25% | -0.96% | -1.36% | +1.40% |
| Size | +0.02% z+0.1 | -0.03% | -1.18% | -2.06% | +2.02% |
| Profitability | -0.00% z-0.0 | -0.16% | +0.78% | +1.17% | +1.52% |
| Style-Momentum | |||||
| One-Day Momentum | -0.41% z-1.5 | -0.35% | +0.57% | +0.77% | -2.84% |
| Short-Term Momentum | -0.07% z-0.2 | -0.05% | +0.02% | +1.74% | -0.23% |
| Long-Term Momentum | -0.09% z-0.1 | +0.20% | -2.97% | -4.69% | -1.01% |
| Medium-Term Momentum | +0.01% z+0.0 | -0.58% | +0.18% | -1.43% | -1.79% |
| Style-Positioning | |||||
| Hedge-Fund Ownership | +0.12% z+1.1 | +0.12% | +0.33% | -0.00% | -0.20% |
| Short Interest | -0.15% z-0.9 | -0.21% | -0.03% | +0.74% | -0.80% |
| Style-Flow | |||||
| Morning Activity | +0.31% z+2.5 | -0.15% | -0.13% | -0.46% | -0.23% |
| Short-Sale Activity | -0.20% z-1.8 | -0.20% | +0.02% | +0.03% | +0.64% |
| Thematic | |||||
| Gold | +0.62% z+1.9 | -0.16% | +0.12% | -0.32% | +0.34% |
| Oil | -0.29% z-0.6 | +0.07% | -2.82% | -2.91% | +1.30% |
| China | +0.22% z+0.5 | +0.15% | -0.50% | -1.15% | -1.13% |
| Semiconductors | -0.28% z-0.5 | +0.86% | -1.73% | -4.89% | -3.50% |
| Treasury (Duration) | +0.08% z+0.3 | -0.35% | +0.74% | +2.55% | -1.32% |
| Bitcoin / Crypto | -0.02% z-0.1 | -0.06% | -2.06% | -1.89% | +0.49% |
5/20/60d windows include today's session; 1d is the previous session.
Pairwise realized correlation. Index variance net of the weighted idiosyncratic diagonal, over the cross terms — the estimator used for implied-correlation indices. 20-day window unless noted; history since 2020.
Market variance share. The fraction of cross-sectional variance explained by the market factor — the attribution companion to pairwise correlation, not a substitute for it.
Factor z-score. Today's factor return divided by its daily-return standard deviation over ~1,600 trading days.
Conditional importance. A factor's relative share of what a tree-based fit of today's stock returns explains; sums to 100% across factors.
High-beta momentum cohort. US names above $2B market cap in the top quintile of both raw beta and 12-month momentum; membership frozen at each month's first business day. “Top 50” = the 50 strongest by combined rank.
HF de-risking score. A FactorPulse measure of de-risking in factor returns: the average of four legs, each in its own daily-volatility units and counted only when it moves in the de-risking direction. They are the most-shorted names rising, 12-month momentum winners falling, names crowded in hedge-fund 13F filings falling net of their beta and momentum, and last week's relative moves continuing instead of reverting (counted only alongside another leg). A leg counts as firing at half its daily volatility or more, so a leg can show a small value without firing. Types: A, covering and selling together; B, selling only; C, covering only. Ranked against every session since January 2020. It reads factor returns only, never positions.
Dispersion (realized). Total cross-sectional volatility net of the market component; high dispersion is the flip side of low correlation.
Stock-specific (idiosyncratic) return. The part of a stock's move not explained by the market, style or thematic (industry and theme) factors in the FactorPulse risk model.
VIXEQ / DSPX / COR1M. Cboe implied indices: single-stock volatility, dispersion, and 1-month implied correlation (top-50 S&P names). Quotes delayed ~15 minutes.
Data compiled by FactorPulse AI; edited and verified by Jeff Klein. For informational purposes only. Does not constitute financial advice, an investment recommendation, or an offer to buy or sell any securities. Always consult a qualified financial professional before making investment decisions.
For more on factor construction methodology, see www.factorpulse.com/glossary.
← FactorPulse · All Digests · Follow us on X
FactorPulse is free during launch · Sign up free (no credit card)