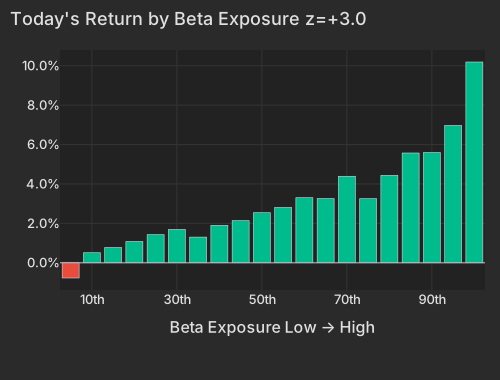
Stocks hammered in October rebounded hard for a second straight day. The S&P 500 rose 2.4% and the Nasdaq-100 gained 3.5%. Last year's high-flying, high-beta stocks rose about 8%, roughly four times the gain for the rest of the market and their seventh-best day since 2020. The bounce followed sensitivity to the market rather than past gains. Last year's winners that move less with the market rose only about 2%, and the most heavily shorted stocks trailed the least shorted. Morgan Stanley said hedge funds' net bets on stocks through Friday were among the lowest since 2010, and there is no sign yet that they are being rebuilt. At Friday's close, before today's gain, the high-flyers were still nearly 40% below their peak.
Nvidia fell 4%, erasing about $195 billion of market value. Its board opened an independent investigation into reports that Jensen Huang was the target of a foreign intelligence effort, and Huang has admitted an extramarital affair. The board said it has no reason to believe national security or company secrets were compromised. Given the broad rally, Nvidia would have been expected to gain about 5%, so the news cost it roughly 9%. The rest of the chip industry rallied. Chipmaker AMD rose 13%, chip-equipment makers Applied Materials and Lam Research rose about 11% each, and the semiconductor fund SOXX gained 7.5%. Investors treated the probe as a problem at one company rather than a question about chip demand. The nuclear power fund NLR and the AI power infrastructure fund AIPO each rose about 7%, while the oil fund USO fell 4%.
Consumers grew more worried about jobs. The New York Fed's consumer survey showed one-year inflation expectations steady at 3.9%. The expected chance of higher unemployment rose to 45%, the highest since April 2020. The 10-year Treasury yield edged up to 4.88% after the release, and corporate bond funds gained more than the move in yields would explain. The VIX fell to about 20 from nearly 26. Options on individual stocks still price swings near the high end of their range since 2014, a sign traders expect single stocks, not the broad index, to do most of the moving in the coming month. A FactorPulse gauge of hedge-fund losses has won back 27% of its drop since October 6, and seven of its eight components have now turned up, the one tracking heavily shorted stocks among them today.
The S&P 500 rose 2.4% and the Nasdaq-100 gained 3.5%, and the most market-sensitive stocks gained the most. Beta rose 2.88% at z=+3.0. The high-beta momentum cohort, last year's high-flying, high-beta stocks, rose 7.8%. That was its seventh-best session of 1,722 since 2020, against a 2.0% gain for the rest of the market. The top 50 names rose 9.8%.
Beta mattered more than past gains. High-beta stocks outside the momentum screen rose 6.6%, their 18th-best day since 2020. Twelve-month winners with ordinary beta rose 2.1%, barely ahead of the rest. The 12-month momentum factor (Long-Term Momentum) added just +0.39% at z=+0.6, after falling 6.85% over 20 sessions. This was a rebound in market sensitivity, not a fresh bid for last year's winners.
| Bucket | Avg Ret Pct |
|---|---|
| 1 | -0.77 |
| 2 | 0.51 |
| 3 | 0.78 |
| 4 | 1.08 |
| 5 | 1.43 |
| 6 | 1.69 |
| 7 | 1.30 |
| 8 | 1.90 |
| 9 | 2.14 |
| 10 | 2.54 |
| 11 | 2.81 |
| 12 | 3.30 |
| 13 | 3.26 |
| 14 | 4.39 |
| 15 | 3.25 |
| 16 | 4.44 |
| 17 | 5.57 |
| 18 | 5.59 |
| 19 | 6.97 |
| 20 | 10.19 |
The rally that started Friday kept going. Friday's winners beat Friday's losers again: the one-day factor (One-Day Momentum in the table) rose 0.48% at z=+1.7. Last week's moves reversed: the 5-day factor (Short-Term Momentum) fell 0.44% at z=-1.4. Both factors point at the same stocks, because the high-beta momentum names were Friday's winners and last week's losers.
The short side of a typical hedge-fund book worked. The most heavily shorted stocks trailed the least shorted by 0.46% (Short Interest, z=-2.7) on a day the S&P 500 rose 2.4%. Our hedge-fund pain index rose 2.4 daily standard deviations, with short interest its largest contributor, and has now won back 27% of its loss since the October 6 peak, up from 13% on Friday. Of its eight legs, seven have now confirmed a turn, with the short-interest and weekly-reversal legs confirming today; 12-month momentum is the one that has not. Seven earlier rallies recovered 46% to 71% before they failed. Stocks most owned by hedge funds roughly matched the rest (Hedge-Fund Ownership -0.05%, z=-0.5; +0.12% on a raw basis). Morgan Stanley Prime Brokerage reported that US long-short net leverage through Friday was among the lowest since 2010. Today's ownership data does not yet show that leverage being rebuilt.

| Date | Sigma Vs Peak |
|---|---|
| 20260924 | -1.05 |
| 20260925 | -0.40 |
| 20260928 | -0.97 |
| 20260929 | -0.52 |
| 20260930 | -0.98 |
| 20261001 | -0.37 |
| 20261002 | -0.03 |
| 20261005 | -0.47 |
| 20261006 | 0.00 |
| 20261007 | -0.18 |
| 20261008 | -0.86 |
| 20261009 | -0.62 |
| 20261012 | -1.47 |
| 20261013 | -1.46 |
| 20261014 | -2.82 |
| 20261015 | -4.07 |
| 20261016 | -4.86 |
| 20261019 | -4.55 |
| 20261020 | -5.45 |
| 20261021 | -4.86 |
| 20261022 | -9.42 |
| 20261023 | -9.29 |
| 20261026 | -8.57 |
| 20261027 | -7.57 |
| 20261028 | -6.98 |
| 20261029 | -7.52 |
| 20261030 | -9.36 |
| 20261102 | -11.38 |
| 20261103 | -10.18 |
| 20261104 | -12.77 |
| 20261105 | -15.86 |
| 20261106 | -13.92 |
| 20261109 | -11.57 |
Background: our research note Factor Fingerprints of Hedge Fund Deleveraging Events compares October with 31 hedge-fund deleveraging events since 2020.
At Friday's close, before today's gain, the group's index was 38.5% below its peak. Beta is still down 9.32% over 20 sessions.
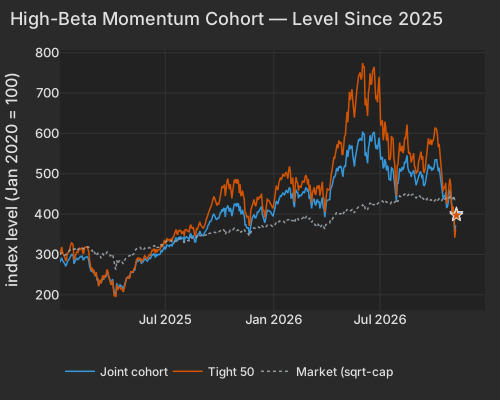
| Series | Prev Close Level |
|---|---|
| joint | 371.97 |
| tight50 | 361.86 |
| market | 432.48 |
Earnings reactions in the regular sessionReporters worth over $100 billion, or moving more than 10% with a value above $5 billion
| Company | Move | Stock-specific | Market cap | What drove it |
|---|---|---|---|---|
| Constellation Energy CEG | +10.4% | +5.4% | $89B | Q3 EPS beat, raised 2026 guidance |
| CNH Industrial CNH | +11.0% | +8.9% | $19B | — |
| Ferguson Enterprises FERG | +11.2% | +11.2% | $45B | Q3 beat, raised 2026 sales guidance |
| Immunovant IMVT | +14.6% | +11.1% | $6B | — |
Stock-specific: the part of a stock's move not explained by the market, style or thematic (industry and theme) factors in the FactorPulse risk model.
Of the 500 largest companies, 420 have reported (81% of market cap), on day 28 of the season.
How earnings reactions split, day 28 of the seasonThe 500 largest US companies with a confirmed earnings reaction so far (401), vs the same day in the past eight seasons and in four-season stretches back to mid-2020

| Season | ≤ −5σ | −5 to −2σ | −2 to 0σ | 0 to 2σ | 2 to 5σ | ≥ 5σ |
|---|---|---|---|---|---|---|
| This season | 8% | 15% | 28% | 24% | 19% | 5% |
| Past 8 seasons | 15% | 19% | 17% | 16% | 17% | 15% |
| Q2 2026 | 14% | 20% | 18% | 16% | 19% | 14% |
| Q1 2026 | 13% | 20% | 13% | 20% | 17% | 17% |
| Q4 2025 | 18% | 16% | 19% | 14% | 19% | 14% |
| Q3 2025 | 11% | 18% | 21% | 18% | 17% | 15% |
| Q2 2025 | 16% | 23% | 14% | 16% | 15% | 16% |
| Q1 2025 | 18% | 17% | 16% | 19% | 19% | 11% |
| Q4 2024 | 17% | 19% | 17% | 16% | 15% | 16% |
| Q3 2024 | 17% | 20% | 15% | 12% | 19% | 16% |
| Q3 '23–Q2 '24 | 16% | 17% | 16% | 15% | 20% | 16% |
| Q3 '22–Q2 '23 | 12% | 19% | 19% | 17% | 22% | 11% |
| Q3 '21–Q2 '22 | 13% | 18% | 15% | 19% | 23% | 12% |
| Q3 '20–Q2 '21 | 6% | 21% | 28% | 23% | 18% | 5% |
σ: a stock's earnings-day stock-specific move divided by its typical daily stock-specific move over the past year. Each bar is cut at the same business day of the season; companies weighted by the square root of market cap.
Nvidia fell 4.2%, losing about $195 billion of market value. Its board opened an independent investigation into reports that Jensen Huang was the target of a foreign intelligence effort, and Huang has admitted an extramarital affair. CNN The board said it has no reason to believe national security or company secrets were compromised. CNN The drop was Nvidia's own. The market and its factor exposures would have lifted it about 4.7%, leaving a stock-specific loss of 8.9%. WSJ
The rest of the chip sector rallied. AMD rose 13.4%, and the market and AMD's high beta account for about two-thirds of that gain. Applied Materials rose 11.4% and Lam Research 10.5%. The Semiconductors factor rose 0.88% at z=+1.4, a modest gain beyond beta after a 6.34% loss over 20 sessions. Investors treated the probe as a governance risk at one company, not a question about chip demand.
| ETF | Theme | Today | 1d Ago | 5d Ago | 20d Ago | 63d Ago |
|---|---|---|---|---|---|---|
| SOXX | semiconductors | +7.5% | +3.5% | -13.1% | -26.8% | -22.6% |
| NLR | nuclear power | +6.8% | +4.4% | -3.6% | -14.4% | -24.4% |
| AIPO | AI power infrastructure | +6.5% | +3.9% | -8.9% | -22.1% | -24.3% |
| WGMI | bitcoin miners & AI hosting | +6.1% | +10.5% | -9.5% | -36.1% | -43.5% |
| MTUM | momentum | +4.9% | +1.9% | -10.2% | -20.3% | -16.8% |
| SPY | large cap | +2.4% | +0.3% | -2.7% | -5.6% | -4.7% |
| XLU | utilities | +1.6% | -0.4% | -0.7% | +4.2% | +0.7% |
| XLP | consumer staples | +0.9% | -1.3% | +0.7% | +8.0% | +6.7% |
| USO | oil | -3.9% | +0.1% | -12.1% | +0.1% | +17.9% |
| VXX | volatility | -13.4% | -1.1% | +14.3% | +29.2% | +8.6% |
The funds hit hardest over the past month led the gains: chips, AI power, nuclear, and bitcoin miners that now host AI computing. Staples and utilities lagged, and the oil fund fell. Chip stocks have been trading as a growth bet that moves with Treasury yields. In the 20 sessions to Friday, SMH fell 23.1% while the 10-year yield dropped 37 basis points, a closer link than in 96% of 20-session stretches since 2019. Today both rose.
The 10-year Treasury yield rose 2 basis points to 4.88%. CNBC HYG and LQD both gained more than the rise in yields would explain, a sign that credit spreads narrowed slightly. Judging by fund prices, high-yield spreads are still roughly 30 basis points wider than a month ago, against about 10 for investment grade.
The index explained 37.6% of the variation in individual stock returns today. That compares with 2.3% on Friday and a one-year average of 9.4%, putting today in the 98.4th percentile of the past year. The jump lifted realized correlation over the past 20 days to 16.9%, above every close of the past three months. Since 2020, that level ranks only in the 36th percentile.
Options moved the other way. Implied correlation among the 50 largest S&P 500 stocks (Cboe COR1M) fell 7.5 points to 13.2, in the 9.1st percentile since 2006. Among the top 500, realized correlation over the past 20 days was 20.9%. Options therefore price about 7.7 points less co-movement than stocks have actually shown. The VIX fell to 19.9 from 25.6 and now sits 29% below its Nov 5 high of 28.2. Implied single-stock volatility (Cboe VIXEQ) eased only to 43.9, still in the 93.7th percentile since 2014. Fear of index swings is fading faster than fear of single-stock swings. Options are pricing a month in which individual stocks, not the index, do most of the moving.
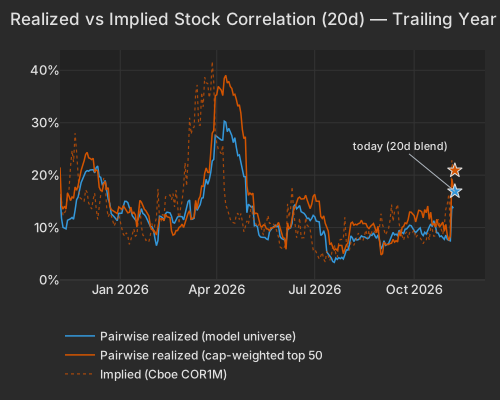
| Series | Today Pct | Prev Close Pct |
|---|---|---|
| Realized, all stocks (20d) | 16.91 | 13.69 |
| Realized, top 500 (20d) | 20.90 | 17.70 |
| Implied, Cboe COR1M | 13.23 | 20.76 |
The New York Fed's Survey of Consumer Expectations, released at 11:00 AM ET, showed median one-year inflation expectations unchanged at 3.9%. The expected chance of higher unemployment rose to 45.3%, the highest since April 2020. Bloomberg Treasury yields edged higher after the release.
Variance decomposition: live as of the Nov 9 session, compared with each factor's range over the past year. Total cross-sectional dispersion is higher than on 98.8% of days in the past year.
Variance mix — % of total, today vs 1d ago vs 1-yr avg
market 98.4%ile style 75%ile thematic 22%ile idiosyncratic 2.4%ile
Variance explained — today vs. factor's trailing-year range
Marker = the factor's share of today's total variance, placed in its own trailing-year range (box 25–75%ile, ticks 90%ile and max). Amber marker = unusually load-bearing today (≥90%ile of its own year). Factor name green = up today / red = down.
Correlation & dispersion — realized vs implied
Pairwise realized correlation (20d): 16.91% 36%ile since 2020 · 100.0%ile 3m
Top-500 pairwise: 20.90% 41%ile since 2020 · 100.0%ile 3m · implied (Cboe COR1M): 13.23 9.1%ile since 2006 (gap +7.7pp)
Realized 20d vol (ann. pts): all stocks 56 vs VIXEQ 44 · index 20 vs VIX 20 · style factors 32 98.6%ile
20-day window (19 completed days + today); percentiles vs model history since 2020; '3m' tokens rank vs the trailing 63 trading days; definitions in Terms below. Implied prints (Cboe) are delayed ~15 min. as of 17:58 ET
High-beta momentum cohort (eq-wt, since-2020 rank): +7.8% 99.7%ile · rest of market +2.0%
HF de-risking score (since-2020 rank): 37%ile today · 65%ile 5-day · HF pain index 11.6σ below peak (3rd-deepest of 32 since 2020), 27% won back · selling only: no short-covering leg
| Factor | Today | 1d | 5d | 20d | 60d |
|---|---|---|---|---|---|
| Style-Risk | |||||
| Beta | +2.88% z+3.0 | +2.53% | +1.42% | -9.32% | -10.81% |
| International | -0.42% z-1.4 | -0.06% | +0.13% | -0.94% | +0.23% |
| Residual Volatility | +0.28% z+0.6 | +0.50% | -0.62% | -2.80% | -0.81% |
| Style | |||||
| Liquidity | -0.52% z-2.0 | +0.17% | -0.93% | -1.88% | -1.28% |
| Size | -0.29% z-0.8 | -0.26% | -0.84% | -3.01% | +1.51% |
| Profitability | +0.13% z+0.7 | -0.61% | -0.23% | +1.11% | +1.30% |
| Leverage | +0.07% z+0.4 | -0.06% | -0.20% | +0.35% | -2.11% |
| Value | +0.03% z+0.1 | -0.65% | -0.83% | -0.61% | -0.70% |
| Dividend Yield | -0.03% z-0.1 | +0.03% | -1.00% | -0.94% | -1.48% |
| Growth | +0.03% z+0.1 | +0.07% | -1.22% | -2.45% | -2.02% |
| Style-Momentum | |||||
| One-Day Momentum | +0.48% z+1.7 | +0.26% | +0.65% | +2.12% | -0.57% |
| Short-Term Momentum | -0.44% z-1.4 | -0.76% | -0.28% | +1.19% | +0.44% |
| Long-Term Momentum | +0.39% z+0.6 | +0.21% | -2.40% | -6.85% | -4.93% |
| Medium-Term Momentum | -0.01% z-0.0 | -0.60% | +0.38% | -0.86% | -0.22% |
| Style-Positioning | |||||
| Short Interest | -0.46% z-2.7 | -0.26% | -0.09% | +0.93% | -0.01% |
| Hedge-Fund Ownership | -0.05% z-0.5 | -0.02% | +0.52% | +0.16% | +0.13% |
| Style-Flow | |||||
| Morning Activity | -0.10% z-0.8 | +0.00% | -0.12% | -0.77% | -0.39% |
| Short-Sale Activity | -0.06% z-0.6 | +0.02% | -0.76% | -0.26% | +0.16% |
| Thematic | |||||
| Bitcoin / Crypto | -0.54% z-1.8 | -0.41% | -0.34% | -2.53% | -0.15% |
| Semiconductors | +0.88% z+1.4 | +1.26% | -2.48% | -6.34% | -7.93% |
| Gold | -0.36% z-1.1 | +0.38% | +1.89% | +0.67% | +2.03% |
| Oil | -0.50% z-1.0 | +0.08% | -3.24% | -6.02% | -1.95% |
| Treasury (Duration) | +0.14% z+0.4 | -0.18% | -0.10% | +2.50% | -0.61% |
| China | +0.06% z+0.1 | +0.28% | +0.87% | -0.57% | -0.14% |
5/20/60d windows include today's session; 1d is the previous session.
Factor z-score. Today's factor return divided by its daily-return standard deviation over ~1,600 trading days.
High-beta momentum cohort. US names above $2B market cap in the top quintile of both raw beta and 12-month momentum; membership frozen at each month's first business day. “Top 50” = the 50 strongest by combined rank.
Stock-specific (idiosyncratic) return. The part of a stock's move not explained by the market, style or thematic (industry and theme) factors in the FactorPulse risk model.
VIXEQ / DSPX / COR1M. Cboe implied indices: single-stock volatility, dispersion, and 1-month implied correlation (top-50 S&P names). Quotes delayed ~15 minutes.
Data compiled by FactorPulse AI; edited and verified by Jeff Klein. For informational purposes only. Does not constitute financial advice, an investment recommendation, or an offer to buy or sell any securities. Always consult a qualified financial professional before making investment decisions.
For more on factor construction methodology, see www.factorpulse.com/glossary.
← FactorPulse · All Digests · Follow us on X
FactorPulse is free during launch · Sign up free (no credit card)