
A much stronger October jobs report pushed Treasury yields up and pushed down the rate-sensitive stocks that had climbed in October. Employers added 165,000 jobs, nearly three times the roughly 60,000 economists expected, and unemployment was 4.1%. The two-year Treasury yield climbed to about 4.52%, and futures traders put the odds of a Federal Reserve rate hike in December at about 80%. The consumer staples fund XLP fell 1.3% and the homebuilder fund ITB fell 2.1%. Meanwhile, the S&P 500 rose 0.4% and the Nasdaq-100 gained 1.5%.
The stocks hit hardest in a month-long selloff led the rebound. The 50 stocks most sensitive to market moves that had also gained the most over the past year rose 6%, their 26th-best day since 2020, while stocks with neither high beta nor big 12-month gains fell 0.6%. The semiconductor fund SMH rose 3.6% after losing 26% in four weeks, its worst stretch since March 2020. Chipmaker AMD jumped about 11% and chipmaker Intel 7.5%, mostly moving with the group. Chipmaker TSMC's U.S.-listed shares rose 6% after Bloomberg, citing The Information, reported the company is drafting plans to make 3D memory chips at Nvidia's request.
Many hedge funds lost money in the slide. A Bloomberg tally showed 29 of 47 large hedge funds lost money in October. Morgan Stanley's prime brokerage said that over November 2–5, hedge funds held less AI stock than the market as a whole for the first time since early 2023. A FactorPulse gauge of hedge-fund losses, in its third-deepest slump since 2020, made a fresh low on Thursday and won back 13% of its drop from the October 6 peak today. In Asia, Taiwan authorized its NT$500 billion National Stabilization Fund to buy stocks and tightened short-selling rules after its main index fell 12% in a week. South Korea suspended margin-call rules for brokerages for three months, according to Seoul Economic Daily, after the Kospi fell about 6% on Friday. In New York, the South Korea fund EWY rose 4% alongside the chip rebound.
Hopes for peace with Iran and the Democratic sweep of Congress turned a month-long retreat from AI stocks into a market-wide selloff. Oil fell below $100 a barrel on Monday as Iran moved toward talks, and the past year's biggest winners began to slide. Beaten-down AI stocks bounced on Tuesday, but the election results on Wednesday hit the companies building data centers. Voters rejected data centers in all but one of 41 local ballot measures, and Texas elected a governor who pledged to halt new approvals. On Thursday the Nasdaq-100 fell 6.4%, and the high-beta stocks that had led the past year fell about 12%, their second-worst day since 2020. Chip stocks bounced on Friday even as a strong jobs report pushed Treasury yields higher. For the week, the Nasdaq-100 is down 4.9% and the S&P 500 2.6%. The chip fund SMH is down 11% and the memory-chip fund DRAM 18%. Oil fell about 12%, gold rose about 5%, and consumer staples edged up.
| Fund | ETF | Friday | Week |
|---|---|---|---|
| S&P 500 | SPY | +0.39% | -2.6% |
| Nasdaq-100 | QQQ | +1.49% | -4.9% |
| Chips | SMH | +3.86% | -11.0% |
| Memory chips | DRAM | +6.18% | -18.1% |
| Momentum stocks | MTUM | +2.26% | -9.9% |
| Energy | XLE | +0.22% | -11.8% |
| Crude oil | USO | +0.03% | -12.2% |
| Gold | GLD | -0.80% | +4.7% |
| Consumer staples | XLP | -1.39% | +0.6% |
| Long Treasuries | TLT | -0.02% | +0.5% |
| Date | Sigma Vs Peak |
|---|---|
| 20260924 | -1.05 |
| 20260925 | -0.40 |
| 20260928 | -0.97 |
| 20260929 | -0.52 |
| 20260930 | -0.98 |
| 20261001 | -0.37 |
| 20261002 | -0.03 |
| 20261005 | -0.47 |
| 20261006 | 0.00 |
| 20261007 | -0.18 |
| 20261008 | -0.86 |
| 20261009 | -0.62 |
| 20261012 | -1.47 |
| 20261013 | -1.46 |
| 20261014 | -2.82 |
| 20261015 | -4.07 |
| 20261016 | -4.86 |
| 20261019 | -4.55 |
| 20261020 | -5.45 |
| 20261021 | -4.86 |
| 20261022 | -9.42 |
| 20261023 | -9.29 |
| 20261026 | -8.57 |
| 20261027 | -7.57 |
| 20261028 | -6.98 |
| 20261029 | -7.52 |
| 20261030 | -9.36 |
| 20261102 | -11.38 |
| 20261103 | -10.18 |
| 20261104 | -12.77 |
| 20261105 | -15.86 |
| 20261106 | -13.81 |
The top 50 high-beta momentum names rose 6.2%, their 26th-best day since 2020. Stocks outside both screens fell 0.6%. The S&P 500 rose 0.4% and the Nasdaq-100 1.5%, both little changed after the close. The top 50 peaked at 9:52, up 7.5%, slipped to 3.0% by 10:37 and won back most of that drop in the afternoon. The gain barely dents the damage: through Thursday, the wider group of roughly 100 names stood 41% below its peak.
The factor numbers show the same thing. Beta rose 2.58% (z=+2.6), but it is still down 13.80% over 20 sessions (z=-3.2). Semiconductors gained 1.35% (z=+2.2), yet the factor is still down 4.78% over five sessions including today (z=-3.5). Through Thursday, SMH's 20-session loss of 26.3% was its worst since March 2020.
Most of the chip gains came from shared factors rather than company news. AMD closed up 10.7%, and more than half of that came from its beta exposure. Intel closed up 7.5%, almost all of it explained by factors. TSMC is the exception. Bloomberg, citing The Information, reported that TSMC is drafting plans to make 3D DRAM memory chips at Nvidia's request. Bloomberg Its ADRs closed up 6.3%, with a stock-specific gain of 3.6%.
| Factor | Return | Z-Score | 5d Z | 20d Z | 63d Z | Category | Direction |
|---|---|---|---|---|---|---|---|
| Profitability | -0.66% | -3.4 | +0.4 | +1.2 | +0.8 | Style | Least profitable led |
| Short-Term Momentum | -0.84% | -2.8 | +0.4 | +1.3 | +0.1 | Style-Momentum | Last week's decliners led |
| Beta | +2.58% | +2.6 | -1.4 | -3.2 | -1.6 | Style-Risk | High-beta stocks led |
| Value | -0.56% | -2.4 | -0.9 | -0.3 | -0.2 | Style | Most expensive led |
| Medium-Term Momentum | -0.66% | -2.3 | +0.9 | -0.6 | -0.4 | Style-Momentum | Last month's decliners led |
| Semiconductors | +1.35% | +2.2 | -3.5 | -2.7 | -1.4 | Thematic | Chip exposure led |
| Short Interest | -0.33% | -1.9 | +1.1 | +1.8 | -0.2 | Style-Positioning | Most-shorted lagged |
| Hedge-Fund Ownership | -0.09% | -0.8 | +2.4 | +0.3 | +0.1 | Style-Positioning | In line with the market |
Earnings reactions in the regular sessionReporters worth over $100 billion, or moving more than 10% with a value above $5 billion
| Company | Move | Stock-specific | Market cap | Revenue YoY | Margin YoY | What drove it |
|---|---|---|---|---|---|---|
| DraftKings DKNG | -21.3% | -22.1% | $12B | — | — | Cut profit outlook to fund prediction markets The Wall Street Journal |
| Axon Enterprise AXON | -17.9% | -18.3% | $31B | +28% | +4.9 pts operating | — |
| Atlassian TEAM | -16.1% | -17.4% | $46B | +24% | +10.0 pts adj. operating | Cautious full-year guidance and billings miss |
| Natera NTRA | -14.2% | -19.0% | $52B | +34% | +7.9 pts operating | EPS miss and unexpected CEO transition |
| Globus Medical GMED | -13.2% | -11.8% | $11B | — | — | — |
| Enbridge ENB | -2.7% light volume | -1.8% | $107B | — | — | — |
| Cloudflare NET | +10.2% | +5.1% | $87B | +39% | +2.2 pts adj. operating | Revenue beat and raised full-year guidance |
| Vistra VST | +10.3% | +7.1% | $38B | +28% | +6.0 pts operating | — |
| Airbnb ABNB | +11.9% | +12.0% | $100B | +19%† | — | Raised outlook on resilient travel demand The Wall Street Journal |
| Ubiquiti UI | +15.2% | +12.6% | $31B | +40% | +2.5 pts operating | — |
| IREN IREN | +20.2% | +14.1% | $7B | — | — | — |
Stock-specific: the part of a stock's move not explained by the market, style or thematic (industry and theme) factors in the FactorPulse risk model.
Revenue and margin from the company's earnings release, year over year; margin change in percentage points; — where the release is not parsed or the figures failed checks.
† The company's year-ago figure differs from the one originally filed, usually a restatement; growth is on its current basis.
Light volume: the company's earnings filing confirms the report, but trading volume has not caught up yet, so the move is an early read.
Of the 500 largest companies, 411 have reported (79% of market cap), on day 27 of the season.
How earnings reactions split, day 27 of the seasonThe 500 largest US companies with a confirmed earnings reaction so far (393), vs the same day in the past eight seasons and in four-season stretches back to mid-2020

| Season | ≤ −5σ | −5 to −2σ | −2 to 0σ | 0 to 2σ | 2 to 5σ | ≥ 5σ |
|---|---|---|---|---|---|---|
| This season | 9% | 16% | 27% | 25% | 19% | 4% |
| Past 8 seasons | 15% | 19% | 17% | 16% | 17% | 15% |
| Q2 2026 | 14% | 20% | 18% | 16% | 19% | 14% |
| Q1 2026 | 13% | 20% | 13% | 20% | 17% | 17% |
| Q4 2025 | 19% | 17% | 19% | 14% | 18% | 14% |
| Q3 2025 | 11% | 18% | 21% | 17% | 17% | 16% |
| Q2 2025 | 16% | 23% | 14% | 16% | 15% | 16% |
| Q1 2025 | 18% | 17% | 16% | 19% | 19% | 10% |
| Q4 2024 | 18% | 18% | 17% | 16% | 15% | 16% |
| Q3 2024 | 17% | 21% | 15% | 12% | 19% | 16% |
| Q3 '23–Q2 '24 | 16% | 17% | 16% | 15% | 20% | 16% |
| Q3 '22–Q2 '23 | 12% | 19% | 19% | 17% | 21% | 11% |
| Q3 '21–Q2 '22 | 13% | 18% | 15% | 19% | 23% | 12% |
| Q3 '20–Q2 '21 | 6% | 21% | 28% | 23% | 18% | 5% |
σ: a stock's earnings-day stock-specific move divided by its typical daily stock-specific move over the past year. Each bar is cut at the same business day of the season; companies weighted by the square root of market cap.
Profitability fell 0.66% (z=-3.4). The least profitable 5% of stocks rose 3.6%. Biotech names such as BridgeBio (BBIO) and Insmed (INSM) were among them, so the move went well beyond chips. Value fell 0.56% (z=-2.4) as the most expensive stocks beat the cheapest.
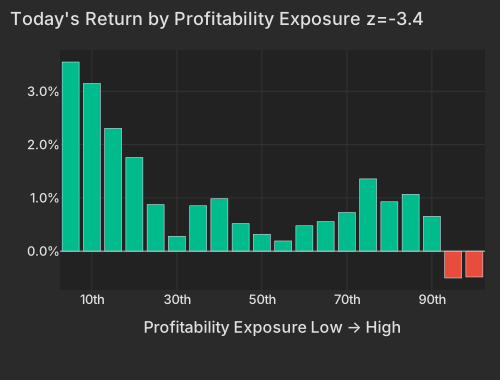
| Bucket | Avg Ret Pct |
|---|---|
| 1 | 3.55 |
| 2 | 3.15 |
| 3 | 2.31 |
| 4 | 1.76 |
| 5 | 0.88 |
| 6 | 0.28 |
| 7 | 0.85 |
| 8 | 0.98 |
| 9 | 0.52 |
| 10 | 0.32 |
| 11 | 0.19 |
| 12 | 0.48 |
| 13 | 0.55 |
| 14 | 0.73 |
| 15 | 1.36 |
| 16 | 0.93 |
| 17 | 1.07 |
| 18 | 0.66 |
| 19 | -0.50 |
| 20 | -0.48 |
The stocks that had fallen furthest did most of the rebounding. Last week's biggest decliners beat last week's biggest gainers: 5-day reversion (Short-Term Momentum in the table) came in at -0.84%, z=-2.8. The bottom 5% by last week's return rose 2.8%. Last month's decliners also beat last month's gainers, with 20-day momentum (Medium-Term Momentum) at -0.66%, z=-2.3.
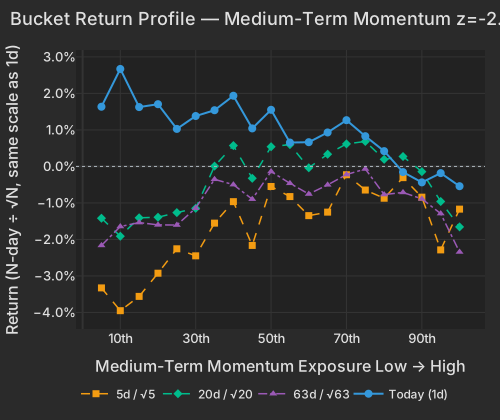
| Bucket | Ret 1D Pct | Ret 5D Norm Pct | Ret 20D Norm Pct | Ret 63D Norm Pct |
|---|---|---|---|---|
| 1 | 1.64 | -3.33 | -1.42 | -2.16 |
| 2 | 2.67 | -3.95 | -1.91 | -1.65 |
| 3 | 1.63 | -3.56 | -1.41 | -1.54 |
| 4 | 1.70 | -2.92 | -1.39 | -1.60 |
| 5 | 1.03 | -2.26 | -1.26 | -1.61 |
| 6 | 1.38 | -2.45 | -1.15 | -1.14 |
| 7 | 1.54 | -1.55 | 0.01 | -0.35 |
| 8 | 1.94 | -0.96 | 0.57 | -0.50 |
| 9 | 1.04 | -2.16 | -0.33 | -0.90 |
| 10 | 1.55 | -0.55 | 0.54 | -0.14 |
| 11 | 0.65 | -0.83 | 0.60 | -0.46 |
| 12 | 0.66 | -1.35 | -0.04 | -0.76 |
| 13 | 0.93 | -1.25 | 0.33 | -0.51 |
| 14 | 1.27 | -0.23 | 0.62 | -0.22 |
| 15 | 0.83 | -0.65 | 0.68 | -0.07 |
| 16 | 0.42 | -0.87 | 0.19 | -0.77 |
| 17 | -0.16 | -0.31 | 0.27 | -0.71 |
| 18 | -0.44 | -0.84 | -0.14 | -0.89 |
| 19 | -0.18 | -2.29 | -0.96 | -1.29 |
| 20 | -0.54 | -1.17 | -1.66 | -2.34 |
The most-shorted stocks did not lead the rebound. The most heavily shorted stocks trailed the least shorted by 0.33% (Short Interest, z=-1.9). Stocks heavily owned by hedge funds moved in line with the market on both the raw and the factor-adjusted measures. A bounce led by last week's decliners, the least profitable and the most expensive stocks is a recovery in the selloff's worst-hit names, not a move into quality.
After the payrolls beat, the 2-year Treasury yield rose 3.9 basis points to 4.516%, and the 10-year rose 2.4 basis points to 4.861%. CNBC Futures pricing of a quarter-point hike at the December 9 meeting rose to about 80% from about 67% before the report, according to CME's FedWatch tool. October's rate-sensitive winners fell: consumer staples, homebuilders and low-volatility shares all ended lower, while the beaten-down AI funds rose.
| ETF | Theme | Today | 1d Ago | 5d Ago | 20d Ago | 63d Ago |
|---|---|---|---|---|---|---|
| WGMI | bitcoin miners & AI hosting | +10.7% | -13.3% | -25.2% | -42.2% | -51.9% |
| DRAM | memory chips | +6.1% | -18.0% | -28.5% | -35.0% | -26.9% |
| EWY | South Korea | +4.3% | -13.5% | -18.7% | -25.3% | -20.7% |
| AIPO | AI power infrastructure | +3.9% | -8.6% | -16.3% | -24.3% | -28.2% |
| SMH | semiconductors | +3.6% | -11.2% | -20.3% | -26.3% | -23.2% |
| USMV | minimum volatility | -0.5% | -2.6% | -1.3% | +1.7% | +1.5% |
| XLP | consumer staples | -1.3% | -0.8% | +3.5% | +9.4% | +7.9% |
| ITB | homebuilders | -2.1% | -1.7% | +7.1% | +14.9% | -1.7% |
Chip stocks have recently been moving with Treasury yields. Over the ten sessions to Thursday, SMH fell about 14% while the 10-year yield fell about 12 basis points, and today both rose. SMH's 20-session correlation with the 10-year yield has risen to +0.61 from -0.11 in the previous 20 sessions, the 96th percentile since 2018.
Our HF de-risking score showed no de-risking on the day. Its one-day reading was at the 20th percentile since 2020, with none of its four legs firing. The longer windows still show October's selling. The five-day score is at the 95.5th percentile and the 20-day at the 98th, where 12-month winners fell, the most-shorted names rose and last week's moves kept going. Over 20 sessions the pattern is the one our score labels de-grossing.
Background: our research note Factor Fingerprints of Hedge Fund Deleveraging Events compares October with 31 hedge-fund deleveraging events since 2020.
The hedge-fund pain index is 13.8 daily standard deviations below its October 6 peak, the third-deepest of 32 such events since 2020. It has won back about 13% of its loss since the November 5 low, and 5 of its 8 legs have confirmed a turn: beta, 13F crowding, volatility, short-sale P&L and the one-day reversal. In past events, seven rallies won back 46% to 71% of the loss before a fresh low.
Morgan Stanley's prime brokerage reported that hedge funds turned underweight the AI theme over November 2–5, the first time since early 2023. Bloomberg's October tally showed 29 of 47 large hedge funds losing money for the month. Millennium fell 2.3% and Balyasny 3.4%, while Citadel's Wellington fund gained 1.7%. The high-beta names that carried October's losses bounced hard on Friday. Hedge-fund-owned stocks, however, did no better than the market.
Through Thursday, credit cracked hardest at the leveraged end. Judging by fund prices, high-yield spreads widened about 32 basis points over the 20 sessions to Thursday, against about 13 for investment grade. CoreWeave's 2032 bond yielded above 16% on Thursday, according to Quartz. Its shares rose 6.3% on Friday, almost all of it from their beta exposure. Implied index volatility (Cboe VIX) eased to 25.6 from Thursday's 28.2. Implied single-stock volatility (Cboe VIXEQ) eased to 47.4 from 49.7, still at the 97th percentile of its history.
Asia's chip markets fell again on Friday before the U.S. rebound. Taiwan's Taiex closed down 4.5%, for a 12% drop on the week, and TSMC fell 4.7% in Taipei hours before its New York shares rebounded. Taiwan authorized its NT$500 billion National Stabilization Fund to buy stocks. The Wall Street Journal South Korea's Kospi fell about 6%.
The Employment Situation report, released at 8:30 AM ET, showed payrolls up 165,000 against a consensus near 60,000, with unemployment at 4.1% and average hourly earnings up 0.4% on the month. BLS The preliminary Michigan Consumer Survey, released at 10:00 AM ET, rose to 51.0 from 48.0, beating the 48.0 consensus, and year-ahead inflation expectations eased to 4.3% from 4.7% data.sca.isr.umich.edu. The New York Fed Staff Nowcast, released at 12:45 PM ET, held its fourth-quarter growth estimate at 2.9%.
Variance decomposition: live as of the Nov 6 session, compared with each factor's range over the past year. Total cross-sectional dispersion is higher than on 94.4% of days in the past year.
Variance mix — % of total, today vs 1d ago vs 1-yr avg
market 34%ile style 86%ile thematic 75%ile idiosyncratic 26%ile
Variance explained — today vs. factor's trailing-year range
Marker = the factor's share of today's total variance, placed in its own trailing-year range (box 25–75%ile, ticks 90%ile and max). Amber marker = unusually load-bearing today (≥90%ile of its own year). Factor name green = up today / red = down.
Correlation & dispersion — realized vs implied
Pairwise realized correlation (20d): 13.60% 24%ile since 2020 · 98.4%ile 3m
Top-500 pairwise: 17.88% 33%ile since 2020 · 98.4%ile 3m · implied (Cboe COR1M): 20.76 20%ile since 2006 (gap -2.9pp)
Realized 20d vol (ann. pts): all stocks 54 vs VIXEQ 47 · index 18 vs VIX 26 · style factors 32 98.4%ile
20-day window (19 completed days + today); percentiles vs model history since 2020; '3m' tokens rank vs the trailing 63 trading days; definitions in Terms below. Implied prints (Cboe) are delayed ~15 min. as of 16:41 ET
Top 50 high-beta momentum names (eq-wt, since-2020 rank): +6.2% 98.5%ile · rest of market -0.6%
HF de-risking score (since-2020 rank): 20%ile today · 95.5%ile 5-day · HF pain index 13.8σ below peak (3rd-deepest of 32 since 2020), 13% won back
| Factor | Today | 1d | 5d | 20d | 60d |
|---|---|---|---|---|---|
| Style-Risk | |||||
| Beta | +2.58% z+2.6 | -3.79% | -3.02% | -13.80% | -13.33% |
| Residual Volatility | +0.50% z+1.0 | -0.96% | -2.01% | -3.45% | -1.23% |
| International | +0.01% z+0.0 | +0.66% | +0.62% | -0.36% | +0.66% |
| Style | |||||
| Profitability | -0.66% z-3.4 | +0.12% | +0.17% | +0.98% | +1.04% |
| Value | -0.56% z-2.4 | +0.28% | -0.44% | -0.36% | -0.49% |
| Liquidity | +0.18% z+0.7 | -0.89% | -1.29% | -1.41% | -0.19% |
| Size | -0.16% z-0.5 | -0.22% | -0.77% | -2.27% | +1.57% |
| Leverage | -0.06% z-0.4 | +0.07% | -0.38% | +0.24% | -2.24% |
| Dividend Yield | +0.06% z+0.3 | -0.23% | -1.35% | -0.89% | -1.34% |
| Growth | +0.05% z+0.2 | -0.58% | -1.52% | -2.51% | -2.09% |
| Style-Momentum | |||||
| Short-Term Momentum | -0.84% z-2.8 | +0.17% | +0.26% | +1.74% | +0.61% |
| Medium-Term Momentum | -0.66% z-2.3 | +0.39% | +0.56% | -0.82% | -0.53% |
| One-Day Momentum | +0.18% z+0.7 | +1.75% | +0.77% | +1.55% | -1.79% |
| Long-Term Momentum | +0.26% z+0.4 | -1.48% | -4.75% | -7.41% | -4.72% |
| Style-Positioning | |||||
| Short Interest | -0.33% z-1.9 | +0.10% | +0.42% | +1.39% | +0.07% |
| Hedge-Fund Ownership | -0.09% z-0.8 | +0.09% | +0.58% | +0.16% | +0.25% |
| Style-Flow | |||||
| Morning Activity | +0.02% z+0.2 | +0.19% | -0.28% | -0.67% | -0.31% |
| Short-Sale Activity | -0.01% z-0.1 | -0.05% | -0.60% | -0.10% | +0.23% |
| Thematic | |||||
| Semiconductors | +1.35% z+2.2 | -2.27% | -4.78% | -7.58% | -8.14% |
| Bitcoin / Crypto | -0.40% z-1.3 | -0.19% | -0.37% | -1.85% | +0.33% |
| Gold | +0.35% z+1.1 | +1.07% | +2.33% | +1.03% | +2.38% |
| Treasury (Duration) | -0.27% z-0.9 | -0.26% | -0.10% | +2.11% | -0.81% |
| China | +0.26% z+0.6 | +0.11% | +0.42% | -0.94% | -0.67% |
| Oil | +0.13% z+0.3 | -0.37% | -4.90% | -5.45% | -1.12% |
5/20/60d windows include today's session; 1d is the previous session.
Pairwise realized correlation. Index variance net of the weighted idiosyncratic diagonal, over the cross terms — the estimator used for implied-correlation indices. 20-day window unless noted; history since 2020.
Market variance share. The fraction of cross-sectional variance explained by the market factor — the attribution companion to pairwise correlation, not a substitute for it.
Factor z-score. Today's factor return divided by its daily-return standard deviation over ~1,600 trading days.
Conditional importance. A factor's relative share of what a tree-based fit of today's stock returns explains; sums to 100% across factors.
High-beta momentum cohort. US names above $2B market cap in the top quintile of both raw beta and 12-month momentum; membership frozen at each month's first business day. “Top 50” = the 50 strongest by combined rank.
HF de-risking score. A FactorPulse measure of de-risking in factor returns: the average of four legs, each in its own daily-volatility units and counted only when it moves in the de-risking direction. They are the most-shorted names rising, 12-month momentum winners falling, names crowded in hedge-fund 13F filings falling net of their beta and momentum, and last week's relative moves continuing instead of reverting (counted only alongside another leg). A leg counts as firing at half its daily volatility or more, so a leg can show a small value without firing. Types: A, covering and selling together; B, selling only; C, covering only. Ranked against every session since January 2020. It reads factor returns only, never positions.
Dispersion (realized). Total cross-sectional volatility net of the market component; high dispersion is the flip side of low correlation.
Stock-specific (idiosyncratic) return. The part of a stock's move not explained by the market, style or thematic (industry and theme) factors in the FactorPulse risk model.
VIXEQ / DSPX / COR1M. Cboe implied indices: single-stock volatility, dispersion, and 1-month implied correlation (top-50 S&P names). Quotes delayed ~15 minutes.
Data compiled by FactorPulse AI; edited and verified by Jeff Klein. For informational purposes only. Does not constitute financial advice, an investment recommendation, or an offer to buy or sell any securities. Always consult a qualified financial professional before making investment decisions.
For more on factor construction methodology, see www.factorpulse.com/glossary.
← FactorPulse · All Digests · Follow us on X
FactorPulse is free during launch · Sign up free (no credit card)