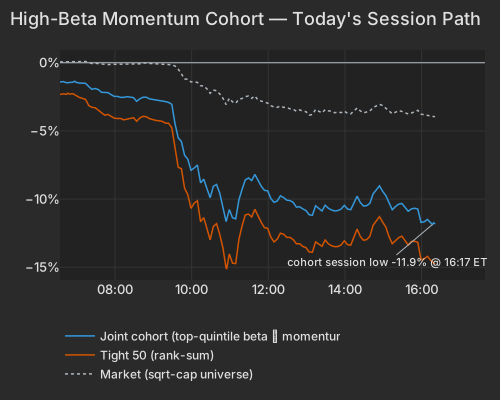
Two sessions after Democrats swept Congress, a month-long selloff in AI suppliers and high-beta stocks spread to the whole market. The S&P 500 fell more than 4% and the Nasdaq-100 more than 6%. In Texas, Democrats won every statewide race and Gina Hinojosa beat Governor Greg Abbott. Across 10 states, voters sided against data centers in all but one of 41 local ballot measures. Hinojosa has called for an immediate halt to AI data-center development, and CNBC reported Thursday that top Democrats want a national moratorium on new permits. The high-beta stocks that had also been the past year's biggest winners fell about 12%, their second-worst day since 2020. Beneath the index, Thursday repeated Wednesday: the stocks that fell most on Wednesday fell again, one of the strongest such repeats since 2020. Cboe's volatility index jumped to 28 from about 17.
Nvidia fell 9%, erasing about $430 billion of market value, and Microsoft, up almost 7% on Wednesday, fell 3.6%. The semiconductor fund SMH dropped more than 11%, and the South Korea fund EWY fell almost 13%. Memory-chip stocks fell hardest: the memory-chip fund DRAM fell 16% and memory maker Micron fell more than 17%, even as contract prices for a common type of memory chip hit a record in October. High memory costs are hurting the buyers. Nintendo said Switch 2 sales fell 41% after price increases driven by memory costs, chip designer Arm fell 13% as its royalty growth slowed, and smartphone-chip maker Qualcomm fell almost 10% on weak handset sales and a weak outlook.
Japanese automaker Toyota rose almost 10% after raising its full-year earnings forecast, and Sony rose 6% on a profit jump from its Spider-Man film and gaming. The gold-miner fund GDX gained about 1%, with spot gold near $4,090, and the China internet fund KWEB rose almost 2% as Hong Kong tech shares rallied. Even the consumer-staples fund XLP, up about 12% over the past month, slipped 0.7%. Treasuries rallied, led by short-term bonds, even though weekly jobless claims fell to 189,000, below forecasts: the 2-year yield fell about 13 basis points to 4.45%, and the 10-year fell about 6 basis points to 4.84%.
For a month, the selling had stayed inside high-beta and AI-supplier stocks. On Thursday, the second session after Democrats swept Congress, it spread to the whole index. Democrats won every statewide race in Texas, where Gina Hinojosa beat Greg Abbott. Across 10 states, voters sided against data centers in all but one of 41 local ballot measures Financial Times. Governor-elect Hinojosa has called for an immediate moratorium on AI data-center development. CNBC reported Thursday that top Democrats want a national moratorium on new facility permits. The high-beta momentum cohort fell 11.8%, its second-worst day since 2020. The roughly 1,200 stocks outside both screens fell 2.5%. This trade was already in trouble before the vote: Beta's 20-session loss reached 15.96% (z=-3.7), and most of it came before today.
| Series | Ret Pct |
|---|---|
| joint | -11.77 |
| tight50 | -14.72 |
| market | -3.95 |
| rest | -2.50 |
Earnings reactions in the regular sessionReporters worth over $100 billion, or moving more than 10% with a value above $5 billion
| Company | Move | Stock-specific | Market cap | Revenue YoY | Margin YoY | What drove it |
|---|---|---|---|---|---|---|
| Caris Life Sciences CAI | -21.4% | -15.2% | $9B | — | — | — |
| Dutch Bros BROS | -21.3% | -17.8% | $6B | — | — | — |
| Remitly Global RELY | -20.5% | -16.0% | $6B | — | — | — |
| MACOM Technology Solutions MTSI | -18.3% | -4.2% | $18B | — | — | — |
| Figma FIG | -16.9% | -14.5% | $12B | — | — | — |
| Rockwell Automation ROK | -14.5% | -8.6% | $49B | +1% | +3.2 pts adj. operating | Profit rose; issued fiscal-year outlook The Wall Street Journal |
| Snap SNAP | -14.1% | -10.8% | $10B | — | — | — |
| Expedia EXPE | -13.8% | -11.4% | $38B | +12% | +1.9 pts adj. pre-tax | — |
| Coherent COHR | -13.6% | +2.7% | $38B | +50% | +3.7 pts adj. operating | — |
| Arm ARM | -13.1% | +1.1% | $205B | — | — | Royalty growth slowed on memory costs |
| SiTime SITM | -12.4% | +6.6% | $12B | — | — | — |
| Cytokinetics CYTK | -12.2% | -9.1% | $9B | — | — | — |
| Mercado Libre MELI | -11.9% | -10.2% | $88B | +45% | -3.4 pts operating | EPS miss on logistics, marketing spending |
| Iron Mountain IRM | -11.3% | -6.2% | $35B | +13% | +3.0 pts operating | — |
| Revolution Medicines RVMD | -11.1% | -3.4% | $43B | — | — | — |
| Zillow Z | -10.8% | -10.1% | $8B | — | — | — |
| Sun Life Financial SLF | -10.4% | -8.2% | $46B | — | — | — |
| IonQ IONQ | -10.2% | +4.4% | $13B | — | — | — |
| Qualcomm QCOM | -9.6% | -4.3% | $185B | -8% | -7.0 pts adj. operating | Weak handset sales and outlook MarketWatch |
| Parker-Hannifin PH | -2.0% | +3.8% | $115B | +18% | +1.3 pts adj. operating | — |
| ConocoPhillips COP | -0.9% light volume | +0.3% | $164B | +29%† | +10.2 pts† operating | — |
| Southern SO | +0.3% | +2.4% | $107B | +13% | +0.8 pts operating | — |
| McKesson MCK | +0.6% | -1.4% | $125B | +8% | +0.1 pts adj. operating | — |
| Duke Energy DUK | +0.7% | +0.7% | $101B | +7% | +2.8 pts operating | — |
| Sony SONY | +5.9% | +6.4% | $152B | — | — | Profit jump on Spider-Man film, gaming The Wall Street Journal |
| Toyota Motor TM | +9.6% | +10.2% | $235B | — | — | Raised full-year earnings forecast The Wall Street Journal |
| Epam Systems EPAM | +21.7% | +21.2% | $7B | — | — | — |
| Applovin APP | +30.7% | +33.4% | $91B | +55% | +1.4 pts operating | Q3 beat, Q4 guidance above consensus |
Stock-specific: the part of a stock's move not explained by the market, style or thematic (industry and theme) factors in the FactorPulse risk model.
Revenue and margin from the company's earnings release, year over year; margin change in percentage points; — where the release is not parsed or the figures failed checks.
† The company's year-ago figure differs from the one originally filed, usually a restatement; growth is on its current basis.
Light volume: the company's earnings filing confirms the report, but trading volume has not caught up yet, so the move is an early read.
Of the 500 largest companies, 385 have reported (77% of market cap), on day 26 of the season.
How earnings reactions split, day 26 of the seasonThe 500 largest US companies with a confirmed earnings reaction so far (368), vs the same day in the past eight seasons and in four-season stretches back to mid-2020

| Season | ≤ −5σ | −5 to −2σ | −2 to 0σ | 0 to 2σ | 2 to 5σ | ≥ 5σ |
|---|---|---|---|---|---|---|
| This season | 8% | 16% | 28% | 24% | 19% | 4% |
| Past 8 seasons | 15% | 19% | 17% | 16% | 17% | 15% |
| Q2 2026 | 14% | 20% | 18% | 16% | 19% | 14% |
| Q1 2026 | 12% | 19% | 14% | 20% | 18% | 18% |
| Q4 2025 | 19% | 17% | 19% | 13% | 18% | 14% |
| Q3 2025 | 11% | 19% | 20% | 17% | 17% | 16% |
| Q2 2025 | 16% | 23% | 14% | 16% | 15% | 16% |
| Q1 2025 | 19% | 17% | 16% | 19% | 18% | 10% |
| Q4 2024 | 18% | 19% | 17% | 17% | 15% | 15% |
| Q3 2024 | 16% | 21% | 15% | 12% | 19% | 16% |
| Q3 '23–Q2 '24 | 15% | 17% | 16% | 15% | 20% | 17% |
| Q3 '22–Q2 '23 | 12% | 19% | 18% | 17% | 22% | 11% |
| Q3 '21–Q2 '22 | 13% | 18% | 15% | 19% | 23% | 12% |
| Q3 '20–Q2 '21 | 6% | 21% | 28% | 23% | 18% | 4% |
σ: a stock's earnings-day stock-specific move divided by its typical daily stock-specific move over the past year. Each bar is cut at the same business day of the season; companies weighted by the square root of market cap.
The S&P 500 fell 4.4% and the Nasdaq-100 fell 6.4%. The megacaps that rallied on Wednesday fell with everything else. On Wednesday, Microsoft rose 6.7% while CoreWeave fell 9.9%. Today Microsoft (MSFT) fell 3.6%. Nvidia's drop erased about $431 billion of market value, and only 0.4 percentage point of its 9.1% drop was specific to Nvidia. The market and its style exposures account for the rest.
Market-wide moves explained 38% of stock-level variance today, the most since April 8, against 9% on Wednesday. That lifted 20-day realized correlation to 15.2%, the highest in three months but still only the 29th percentile since 2020. The faster five-day measure, at 26.2%, is above every close of the past three months. In options, implied correlation among the 50 largest S&P 500 stocks (Cboe COR1M) jumped to 23.4 from 9.5. That is about 3 points above the 20.3% realized across the S&P 500 over the past month, so options now price more co-movement than stocks have actually shown. Implied index volatility (Cboe VIX) rose to 28.2 from 16.6, above every close of the prior 20 sessions. For a month, single stocks had moved on their own stories; today they moved together on the index.
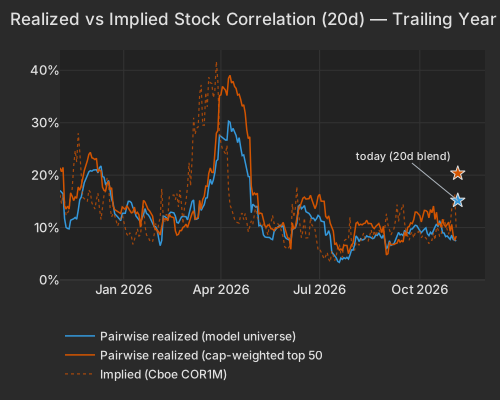
| Series | Today Pct | Prev Close Pct |
|---|---|---|
| Realized, all stocks (20d) | 15.16 | 7.47 |
| Realized, top 500 (20d) | 20.34 | 8.38 |
| Implied, Cboe COR1M | 23.43 | 9.53 |
Beta fell 3.75% (z=-3.9), its worst session since 2020 and its fourth loss in five days. Beta did more of the damage than momentum: stocks ranking high on beta alone fell 7.4%, those high only on 12-month momentum 3.7%.
| Factor | Return | Z-Score | 5d Z | 20d Z | 63d Z | Category | Direction |
|---|---|---|---|---|---|---|---|
| Beta | -3.75% | -3.9 | -4.2 | -3.7 | -2.1 | Style-Risk | Most market-sensitive names lagging |
| One-Day Momentum | +1.55% | +5.5 | +1.5 | +0.9 | -1.0 | Style-Momentum | Wednesday's losers falling further |
| Liquidity | -0.98% | -3.7 | -2.8 | -1.8 | +0.2 | Style | Highest-turnover names lagging |
| Semiconductors | -2.03% | -3.3 | -4.8 | -3.3 | -1.7 | Thematic | Chip-exposed names lagging |
| Gold | +0.99% | +3.1 | +2.4 | +0.7 | +0.9 | Thematic | Gold-exposed names ahead |
| Long-Term Momentum | -1.37% | -2.1 | -3.8 | -2.6 | -0.8 | Style-Momentum | 12-month winners lagging |
| Hedge-Fund Ownership | +0.05% | +0.5 | +2.2 | +0.8 | +0.1 | Style-Positioning | Flat after netting style tilts |
| Short Interest | -0.05% | -0.3 | +2.3 | +2.1 | +0.1 | Style-Positioning | Flat today; most-shorted up over the month |
Wednesday's hardest-hit stocks kept falling. The one-day factor (One-Day Momentum in the table) rose 1.55% at z=+5.5, a 99.9th-percentile session since 2020. The biggest group among Wednesday's worst performers, five defense stocks led by Mercury Systems and Viasat, fell another 6.7%. CoreWeave (CRWV) fell 10.3% on top of Wednesday's drop, and its beta and turnover exposures alone explain more than the whole loss. Liquidity (-0.98%, z=-3.7) and Residual Volatility (-1.01%, z=-2.0) mostly pick out the same high-turnover, volatile stocks that Beta does. They reflect the same selling seen from two more angles.
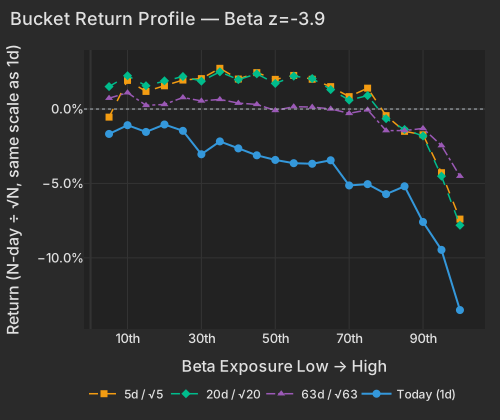
| Bucket | Ret 1D Pct | Ret 5D Norm Pct | Ret 20D Norm Pct | Ret 63D Norm Pct |
|---|---|---|---|---|
| 1 | -1.67 | -0.54 | 1.51 | 0.73 |
| 2 | -1.09 | 1.92 | 2.24 | 1.10 |
| 3 | -1.54 | 1.18 | 1.57 | 0.25 |
| 4 | -1.04 | 1.56 | 1.90 | 0.31 |
| 5 | -1.46 | 1.95 | 2.19 | 0.78 |
| 6 | -3.04 | 2.04 | 1.87 | 0.55 |
| 7 | -2.18 | 2.74 | 2.50 | 0.65 |
| 8 | -2.65 | 2.02 | 1.97 | 0.40 |
| 9 | -3.11 | 2.45 | 2.37 | 0.31 |
| 10 | -3.42 | 1.99 | 1.72 | -0.10 |
| 11 | -3.64 | 2.26 | 2.21 | 0.16 |
| 12 | -3.68 | 2.00 | 2.05 | 0.13 |
| 13 | -3.44 | 1.51 | 1.31 | 0.01 |
| 14 | -5.13 | 0.83 | 0.60 | -0.29 |
| 15 | -5.05 | 1.40 | 0.90 | -0.06 |
| 16 | -5.72 | -0.44 | -0.65 | -1.45 |
| 17 | -5.19 | -1.50 | -1.37 | -1.45 |
| 18 | -7.59 | -1.73 | -1.81 | -1.30 |
| 19 | -9.46 | -4.28 | -4.51 | -2.45 |
| 20 | -13.51 | -7.40 | -7.81 | -4.51 |
The Roundhill Memory ETF (DRAM) fell 16.1%. Micron (MU) fell 17.5%, and only 1.8 percentage points of that was its own move. Semiconductors fell 2.03% (z=-3.3), extending a 20-session loss that runs at z=-3.3. TrendForce data points the other way: TrendForce figures reported November 4 put October's DDR4 contract price at a record $27.5, with November prices projected slightly higher. The damage from high memory prices is landing on the buyers. Nintendo said Switch 2 sales fell 41% after price increases driven by memory costs, and Arm's royalty growth slowed as memory prices hurt smartphone sales CNBC. Bloomberg reported Wednesday that supply costs are eroding Qualcomm's margins. Record prices did not help: worries about data-center moratoriums drove AI stocks lower worldwide, the AP reported AP, and memory makers fell with them.
The Gold factor rose 0.99% (z=+3.1), mostly because the least gold-exposed stocks, led by defense and AI-hardware names, fell 8.5%. Spot gold was at $4,090.28 at 4:24 PM ET, up 0.8% CNBC. Foreign-listed names outperformed (International, +0.69%, z=+2.3), led by Toyota and Sony after both reported stronger profits The Wall Street Journal. China internet stocks also gained (KWEB +1.8%) as Hong Kong's Hang Seng Tech index rose 5.6% JAPANTIMES. Even consumer staples (XLP), up 12.5% over 20 sessions, fell today.
| ETF | Theme | Today | 1d Ago | 5d Ago | 20d Ago | 63d Ago |
|---|---|---|---|---|---|---|
| DRAM | memory chips & storage | -16.1% | -5.3% | -16.7% | -24.8% | -12.3% |
| EWY | South Korea | -12.6% | -1.9% | -8.3% | -17.2% | -7.3% |
| SMH | semiconductors | -11.5% | -2.8% | -11.2% | -19.3% | -11.8% |
| AIPO | AI power infrastructure | -8.7% | -6.3% | -9.0% | -19.4% | -20.7% |
| QQQ | large cap growth | -6.4% | +1.0% | -4.6% | -8.7% | -3.1% |
| SPY | large cap | -4.4% | +1.7% | -0.7% | -1.3% | +0.02% |
| XLP | consumer staples | -0.7% | +3.4% | +5.9% | +12.5% | +8.7% |
| TLT | long-term bonds | +0.3% | +0.8% | +1.4% | +6.4% | +0.3% |
| GDX | gold miners | +1.3% | +9.0% | +0.8% | -1.0% | +0.8% |
| KWEB | China internet | +1.8% | +4.5% | +5.8% | -0.04% | -14.3% |
Today's worst ETFs are the same ones that led the 20-session decline, while the few gainers sit outside the AI-hardware complex. In bonds, short maturities led the rally: the 2-year Treasury yield fell 12.7 basis points to 4.45% CNBC. The 10-year yield fell 5.7 basis points to 4.84% CNBC. The 30-year fell only 2.4 basis points, so the curve steepened from the front. Chip stocks and yields have been falling together: in the 20 sessions through Wednesday, SMH's daily moves tracked the 10-year yield more closely than in 98% of 20-day stretches since 2019. Bloomberg tied Thursday's Treasury gain to haven demand from the tech selloff Bloomberg.
Corporate bonds lagged Treasuries. HYG slipped 0.2%, even though the drop in yields alone pointed to a gain. LQD rose only 0.1%. CoreWeave's 2031 bonds were yielding 15.9% Bloomberg.
The hedge-fund pain index made a new low, 15.6 daily standard deviations below its October 6 peak. That is the third-deepest of 32 such drawdowns since 2020; the deepest, in March 2020, reached 26.3. Our HF de-risking score puts the past five sessions in the 98.6th percentile since 2020 and the past 20 in the 99.1st. Over those windows, 12-month winners fell, the most-shorted names rose, and last week's moves kept going instead of fading. That pattern matches a de-gross.
Background: our research note Factor Fingerprints of Hedge Fund Deleveraging Events compares October with 31 hedge-fund deleveraging events since 2020.
Prime-brokerage data agrees. Morgan Stanley's prime brokerage reported that hedge funds cut gross equity exposure 7.8% from peak to trough, its largest sustained de-grossing since 2016. Goldman Sachs prime brokerage data showed a steep fall in hedge-fund net leverage in October, and Goldman traders saw few buyers on Thursday Bloomberg. On Wednesday, the systematic hedge fund Engineers Gate cut a team of fundamental stock pickers that held about 14% of the firm's gross market value at the end of October, Bloomberg reported Bloomberg. Our ownership factors show how hedge-fund-owned stocks were hit. On a raw basis, they lagged lightly owned names by 0.45% (z=-3.1). That gap shrinks to +0.05% once their beta and momentum tilts are netted out, so the losses came through those tilts.
The one-day de-risking score sat only at the 82nd percentile because the most-shorted names did not rise: today was selling without short covering (Short Interest -0.05%, z=-0.3). In Wednesday's session, the high-beta momentum names traded on light volume, and the easiest-to-sell names fell hardest.

| Date | Sigma Vs Peak |
|---|---|
| 20260924 | -1.05 |
| 20260925 | -0.40 |
| 20260928 | -0.97 |
| 20260929 | -0.52 |
| 20260930 | -0.98 |
| 20261001 | -0.37 |
| 20261002 | -0.03 |
| 20261005 | -0.47 |
| 20261006 | 0.00 |
| 20261007 | -0.18 |
| 20261008 | -0.86 |
| 20261009 | -0.62 |
| 20261012 | -1.47 |
| 20261013 | -1.46 |
| 20261014 | -2.82 |
| 20261015 | -4.07 |
| 20261016 | -4.86 |
| 20261019 | -4.55 |
| 20261020 | -5.45 |
| 20261021 | -4.86 |
| 20261022 | -9.42 |
| 20261023 | -9.29 |
| 20261026 | -8.57 |
| 20261027 | -7.57 |
| 20261028 | -6.98 |
| 20261029 | -7.52 |
| 20261030 | -9.36 |
| 20261102 | -11.38 |
| 20261103 | -10.18 |
| 20261104 | -12.77 |
| 20261105 | -15.55 |
None of the drawdown has been recovered. Today the beta, 12-month momentum, weekly-reversal, one-day-reversal and VIX legs of the pain index were still falling; only the 13F-crowding and short-sale legs moved back.
Initial jobless claims, released at 8:30 AM ET, fell to 189,000 for the week ending October 31, below the 197,000 consensus and the prior week's revised 195,000 Labor Department. The dollar index ended at 101.60, little changed CNBC. The New York Fed's Global Supply Chain Pressure Index, released at 10:00 AM ET, eased to 1.26 in October from a revised 1.36 in September.
Variance decomposition: live as of the Nov 5 session, compared with each factor's range over the past year. Total cross-sectional dispersion is higher than on 100.0% of days in the past year.
Variance mix — % of total, today vs 1d ago vs 1-yr avg
market 98.4%ile style 84%ile thematic 2.0%ile idiosyncratic 1.6%ile
Variance explained — today vs. factor's trailing-year range
Marker = the factor's share of today's total variance, placed in its own trailing-year range (box 25–75%ile, ticks 90%ile and max). Amber marker = unusually load-bearing today (≥90%ile of its own year). Factor name green = up today / red = down.
Correlation & dispersion — realized vs implied
Pairwise realized correlation (20d): 15.16% 29%ile since 2020 · 100.0%ile 3m
Top-500 pairwise: 20.34% 39%ile since 2020 · 100.0%ile 3m · implied (Cboe COR1M): 23.43 25%ile since 2006 (gap -3.1pp)
Realized 20d vol (ann. pts): all stocks 53 vs VIXEQ 50 · index 18 vs VIX 28 · style factors 31 98.2%ile
20-day window (19 completed days + today); percentiles vs model history since 2020; '3m' tokens rank vs the trailing 63 trading days; definitions in Terms below. Implied prints (Cboe) are delayed ~15 min. as of 16:21 ET
High-beta momentum cohort (eq-wt, since-2020 rank): -11.8% 0.1%ile worst since 2020-03-16 · rest of market -2.5%
HF de-risking score (since-2020 rank): 82%ile today · 98.6%ile 5-day · HF pain index 15.6σ below peak (3rd-deepest of 32 since 2020), 0% won back · selling only: no short-covering leg
| Factor | Today | 1d | 5d | 20d | 60d |
|---|---|---|---|---|---|
| Style-Risk | |||||
| Beta | -3.75% z-3.9 | -1.93% | -9.04% | -15.96% | -16.15% |
| International | +0.69% z+2.3 | +0.32% | +0.64% | -0.25% | +0.48% |
| Residual Volatility | -1.01% z-2.0 | -0.73% | -2.63% | -3.57% | -1.07% |
| Style | |||||
| Liquidity | -0.98% z-3.7 | +0.07% | -1.67% | -2.20% | -0.01% |
| Growth | -0.60% z-2.5 | -0.88% | -1.61% | -2.51% | -1.95% |
| Value | +0.36% z+1.6 | -0.38% | +0.41% | -0.20% | +0.22% |
| Profitability | +0.19% z+1.0 | +0.30% | +0.85% | +1.47% | +1.87% |
| Dividend Yield | -0.11% z-0.7 | -0.66% | -1.39% | -1.12% | -1.14% |
| Size | -0.19% z-0.6 | -0.04% | -0.61% | -2.04% | +1.82% |
| Leverage | +0.05% z+0.3 | -0.32% | -0.13% | +0.13% | -2.20% |
| Style-Momentum | |||||
| One-Day Momentum | +1.55% z+5.5 | -1.49% | +0.91% | +1.18% | -2.42% |
| Long-Term Momentum | -1.37% z-2.1 | -1.72% | -5.44% | -7.38% | -5.17% |
| Medium-Term Momentum | +0.17% z+0.6 | +1.18% | +1.48% | +0.01% | -0.27% |
| Short-Term Momentum | +0.04% z+0.1 | +0.81% | +0.69% | +2.77% | +1.01% |
| Style-Positioning | |||||
| Hedge-Fund Ownership | +0.05% z+0.5 | +0.40% | +0.54% | +0.39% | +0.21% |
| Short Interest | -0.05% z-0.3 | +0.74% | +0.85% | +1.59% | +0.32% |
| Style-Flow | |||||
| Morning Activity | +0.23% z+1.8 | -0.07% | -0.08% | -0.66% | -0.30% |
| Short-Sale Activity | +0.00% z+0.0 | -0.47% | -0.50% | -0.22% | +0.31% |
| Thematic | |||||
| Semiconductors | -2.03% z-3.3 | -3.20% | -6.63% | -8.96% | -9.60% |
| Gold | +0.99% z+3.1 | +0.96% | +1.74% | +1.04% | +1.82% |
| Treasury (Duration) | -0.38% z-1.2 | +0.54% | +0.34% | +2.27% | -0.95% |
| Bitcoin / Crypto | -0.25% z-0.8 | +0.86% | -0.41% | -1.23% | +1.08% |
| Oil | -0.29% z-0.6 | -2.53% | -4.67% | -5.59% | -1.32% |
| China | -0.04% z-0.1 | +0.28% | -0.12% | -1.00% | -0.73% |
5/20/60d windows include today's session; 1d is the previous session.
Pairwise realized correlation. Index variance net of the weighted idiosyncratic diagonal, over the cross terms — the estimator used for implied-correlation indices. 20-day window unless noted; history since 2020.
Market variance share. The fraction of cross-sectional variance explained by the market factor — the attribution companion to pairwise correlation, not a substitute for it.
Factor z-score. Today's factor return divided by its daily-return standard deviation over ~1,600 trading days.
Conditional importance. A factor's relative share of what a tree-based fit of today's stock returns explains; sums to 100% across factors.
High-beta momentum cohort. US names above $2B market cap in the top quintile of both raw beta and 12-month momentum; membership frozen at each month's first business day. “Top 50” = the 50 strongest by combined rank.
HF de-risking score. A FactorPulse measure of de-risking in factor returns: the average of four legs, each in its own daily-volatility units and counted only when it moves in the de-risking direction. They are the most-shorted names rising, 12-month momentum winners falling, names crowded in hedge-fund 13F filings falling net of their beta and momentum, and last week's relative moves continuing instead of reverting (counted only alongside another leg). A leg counts as firing at half its daily volatility or more, so a leg can show a small value without firing. Types: A, covering and selling together; B, selling only; C, covering only. Ranked against every session since January 2020. It reads factor returns only, never positions.
Dispersion (realized). Total cross-sectional volatility net of the market component; high dispersion is the flip side of low correlation.
Stock-specific (idiosyncratic) return. The part of a stock's move not explained by the market, style or thematic (industry and theme) factors in the FactorPulse risk model.
VIXEQ / DSPX / COR1M. Cboe implied indices: single-stock volatility, dispersion, and 1-month implied correlation (top-50 S&P names). Quotes delayed ~15 minutes.
Data compiled by FactorPulse AI; edited and verified by Jeff Klein. For informational purposes only. Does not constitute financial advice, an investment recommendation, or an offer to buy or sell any securities. Always consult a qualified financial professional before making investment decisions.
For more on factor construction methodology, see www.factorpulse.com/glossary.
← FactorPulse · All Digests · Follow us on X
FactorPulse is free during launch · Sign up free (no credit card)