Democratic Sweep Sinks Last Year's AI Winners as S&P 500 Rises 2%
Macro: Democrats swept Congress, and oil took the hit: WTI fell 7.9% to $88.53 as of 12:10 PM ET on bets the sweep speeds a deal to end the Iran war. The 10-year yield fell 5.0 basis points to 4.90% (12:21 PM ET) as the sweep cooled fiscal-expansion bets.
Market Moves: The S&P 500rose 1.8%. The Russell 2000rose 1.3%. Lower yields and a weaker dollar lifted homebuilders and gold miners (GDX +8.9%). Crude's slide sank oil producers (XOP -7.1%). Chips and AI power, the past year's leaders, lagged too.
Factors:Semiconductors (z=-5.7) slid as chips sold off despite strong results. Oil (z=-5.6) tracked crude's slide. Short Interest (z=+5.0) rose as the most-shorted names led, while 12-month winners lagged (Long-Term Momentum, z=-3.3).
Micro:AMDrose only 0.3% on an above-estimate revenue forecast, as chip and high-beta selling nearly cancelled its stock-specific gain. FISfell 24.2% on a weak 2027 outlook and CFO departure. CVSfell 12.2% on its plan to split in two.
Watch: When Qualcomm reports after today's close, will its own results move the stock, or will the chip-factor selling that nearly cancelled AMD's stock-specific gain swamp it too?
November 4, 2026 · 12:33 ET · Updated 13:00 ET · intraday
Democrats' sweep of the House and Senate has the S&P 500up about 2% at midday, but the past year's AI winners are being sold into the rally. The 50 high-beta stocks with the strongest past runs are down 5%, while the rest of the market is up nearly 3%, on pace for its best day in a year. The AI-power fund AIPOfell 6% and power-equipment maker GE Vernovadropped 11% after Texas elected a governor who has called for a pause on new data centers. Data-center cloud provider CoreWeavefell 10%. The semiconductor fund SMHis down 2%, adding to an 18% drop over the past four weeks, even though chipmaker AMD raised its forecast on AI chip demand. The most heavily shorted stocks are beating the least shorted. Apple, Microsoft and Amazon, with less riding on chips, are each up about 7%, together adding roughly $770 billion in market value.
Crude oil fell 8% to about $89 a barrel as traders bet the sweep makes a deal to end the Iran war more likely. Oil giant ExxonMobilis down 5% and the oil fund USOis down 9%. The 10-year Treasury yield slipped to 4.90% and the dollar weakened, while gold rose 3.5% to about $4,060 an ounce. The gold-miner fund GDXjumped 9% and the homebuilder fund ITBrose nearly 8%. Electric-car maker Teslais down 3% on worries about congressional scrutiny of Elon Musk's companies. A FactorPulse gauge of hedge-fund losses made a new low, its fourth-deepest slide since 2020, after Goldman Sachs's prime-brokerage desk had called October the fastest pullback in risk-taking since March.
In earnings, pharmacy chain CVS Healthfell 12% on a plan to split into two companies, and ride-hailing company Uberrose nearly 8% on a 20% jump in bookings. Chipmaker Qualcommis up 2% after agreeing to build network equipment for SpaceX's US mobile service, and it reports results after the close. On the economy, ADP said private employers added 86,000 jobs in October, above the 69,000 expected, while a gauge of service-sector activity fell to a three-month low. Futures traders now see about an 83% chance the Fed raises rates by a quarter point on December 9.
Democrats won control of both the House and the Senate Bloomberg. The S&P 500 is up 1.8% and the Nasdaq-100 1.5%. The past year's leaders are being sold into that gain. The top 50 high-beta momentum names are down 5.0%, while the rest of the market is up 2.8%, on pace for its best day in a year and its 30th-best since 2020. The selling extends a move that was already under way. Beta has lost 14.24% over 20 sessions including today, and the same top 50 names had extreme down days on October 30 and November 2. Tuesday's bounce is gone: yesterday's winners are trailing yesterday's hardest-hit stocks by 1.49% (One-Day Momentum, z=-5.4).
WTI Crude Fell 8% on Bets the Sweep Speeds an Iran Deal
WTI crude is at $88.53 a barrel as of 12:10 PM ET, down 7.9%CNBC. The sweep gives Congress leverage to push for an end to the Iran war, and traders are betting the White House is now more inclined to make a deal CNBC. Oil futures extended their retreat as the results came in The Wall Street Journal. Stocks most exposed to oil are trailing the least exposed by 2.66% (Oil, z=-5.6), with the five-day reading at z=-4.9. ExxonMobil (XOM) is down 5.0%, and its oil exposure accounts for most of that drop. Energy was the past year's biggest winner in our ETF list. USO, up 118% over the past year, is down 9.2% today.
Earnings reactions so far todayReporters worth over $100 billion, or moving more than 10% with a value above $5 billion
Company
Move
Stock-specific
Market cap
Revenue YoY
Margin YoY
What drove it
Fidelity National Information Services FIS
-24.2%
-29.1%
$20B
—
—
weak 2027 outlook and CFO departure
Unum UNM
-16.4%
-17.6%
$14B
—
—
—
Datadog DDOG
-14.1%
-9.4%
$79B
+35%
+6.9 pts operating
cautious fourth-quarter revenue outlook
CVS Health CVS
-12.2%
-9.8%
$117B
+5%
+0.5 pts adj. operating
plan to split into two companies
Advanced Micro Devices AMD
+0.3%
+6.8%
$790B
+45%
+5.1 pts adj. operating
AI chip demand lifts fourth-quarter forecast Bloomberg
Stock-specific: the part of a stock's move not explained by the market, style or thematic (industry and theme) factors in the FactorPulse risk model.
Revenue and margin from the company's earnings release, year over year; margin change in percentage points; — where the release is not parsed or the figures failed checks.
Of the 500 largest companies, 340 have reported (73% of market cap), on day 25 of the season.
How earnings reactions split, day 25 of the seasonThe 500 largest US companies with a confirmed earnings reaction so far (321), vs the same day in the past eight seasons and in four-season stretches back to mid-2020
Weighted by size, 23% of this season's reporters rose 2σ or more on a stock-specific basis, against 32% at this point in the past eight seasons; 25% fell 2σ or more (past: 35%).
Earnings reactions this season vs the past eight seasons, day 25
Season
≤ −5σ
−5 to −2σ
−2 to 0σ
0 to 2σ
2 to 5σ
≥ 5σ
This season
8%
17%
29%
23%
19%
4%
Past 8 seasons
15%
19%
17%
16%
17%
15%
Q2 2026
14%
21%
16%
17%
19%
14%
Q1 2026
12%
20%
14%
19%
18%
17%
Q4 2025
19%
17%
19%
13%
18%
14%
Q3 2025
11%
18%
21%
17%
17%
16%
Q2 2025
16%
22%
15%
16%
15%
16%
Q1 2025
20%
17%
16%
19%
19%
9%
Q4 2024
18%
19%
17%
17%
15%
14%
Q3 2024
17%
21%
15%
12%
19%
16%
Q3 '23–Q2 '24
16%
17%
16%
15%
19%
17%
Q3 '22–Q2 '23
12%
20%
18%
17%
22%
11%
Q3 '21–Q2 '22
13%
18%
15%
18%
23%
12%
Q3 '20–Q2 '21
7%
21%
28%
23%
17%
4%
σ: a stock's earnings-day stock-specific move divided by its typical daily stock-specific move over the past year. Each bar is cut at the same business day of the season; companies weighted by the square root of market cap.
Chip Stocks Fell Despite Strong AMD and Arista Results
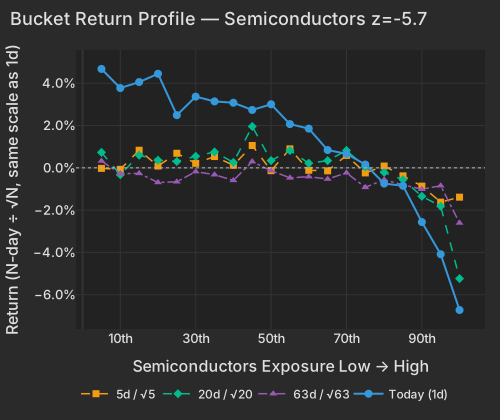
Chip-exposed stocks are trailing the least exposed by 3.46% even after their beta and momentum tilts are accounted for (Semiconductors, z=-5.7). The factor is down 8.07% over 20 sessions including today. Through Tuesday, SMH's 20-day loss of 18.0% ranked in the worst 1.2% of 20-day stretches since 2019.
Strong company results are not holding the group up. AMD is up only 0.3% after forecasting fourth-quarter revenue above estimates Bloomberg. Its own move is a gain of 6.8%, but its style exposures cost it 6.0%. Arista Networks (ANET) reported revenue up 58.5%. It is up 4.8%, against a stock-specific gain of 8.1%. This season, 23% of the 500 largest US reporters have risen 2σ or more on their own news. That is below every one of the past eight seasons at the same point, which averaged 32%, and 142 of this season's reactions are still intraday.
AI power suppliers are taking the political hit directly. AIPO is down 6.2% after Texas elected Democrat Gina Hinojosa, who has called for a moratorium on new data-center projects, in a state that holds 27% of planned US data-center capacity Seeking Alpha. Data-center cloud providers fell further: CoreWeave (CRWV) is down 9.7% and Nebius (NBIS) 6.1%. GE Vernova (GEV) is down 10.7%, mostly because of its factor exposures: it was among Tuesday's biggest gainers, and that group is now reversing.
Today, the more chip-exposed the stock, the worse it did (z=-5.7). The most exposed names have also lagged over five days, 20 days and three months.
Bucket Return Profile — Semiconductors z=-5.7
Bucket
Ret 1D Pct
Ret 5D Norm Pct
Ret 20D Norm Pct
Ret 63D Norm Pct
1
4.68
-0.03
0.73
0.33
2
3.77
-0.07
-0.33
-0.28
3
4.06
0.83
0.60
-0.26
4
4.45
0.09
0.36
-0.69
5
2.49
0.69
0.30
-0.66
6
3.37
0.21
0.55
-0.18
7
3.14
0.53
0.75
-0.32
8
3.08
0.12
0.26
-0.59
9
2.74
1.06
1.96
0.29
10
3.01
-0.13
0.34
-0.13
11
2.07
0.90
0.82
-0.47
12
1.85
-0.12
0.22
-0.42
13
0.84
-0.14
0.34
-0.53
14
0.66
0.59
0.82
-0.24
15
0.16
-0.24
0.04
-0.92
16
-0.75
0.08
-0.22
-0.56
17
-0.85
-0.38
-0.56
-0.80
18
-2.56
-0.87
-1.34
-1.01
19
-4.09
-1.62
-1.82
-0.85
20
-6.73
-1.39
-5.24
-2.61
Qualcomm (QCOM) is up 2.2% after agreeing to build network equipment for SpaceX's US mobile service Bloomberg. It reports results after the close.
Apple, Microsoft and Amazon Added $772 Billion as AI Builders Fell
The largest companies are leading the index. Apple, Microsoft and Amazon are each up about 6.7%, together adding about $772 billion of market value. Amazon's gain comes mostly from factors, especially its low exposure to chips. Tesla (TSLA) is down 3.2% on worries about congressional scrutiny of Elon Musk's companies Bloomberg. Its stock-specific loss of 10.4% is larger than the headline drop because its factor exposures lifted it.
Hedge-Fund Pain Index Hits a New Low, 4th-Deepest Since 2020
Our HF de-risking score is at the 99.5th percentile since 2020 so far today. That is the 8th-highest reading of 1,680 sessions, though the ranks compare a partial session with full days. Three of its four legs are firing. 12-month winners are trailing the year's hardest-hit stocks by 2.08% (Long-Term Momentum, z=-3.3). The most-shorted stocks are beating the least shorted by 0.83% (Short Interest, z=+5.0), the reverse of that factor's usual persistent drag. Last week's moves are continuing instead of reverting.
The momentum factors at every horizon are tracking the same trade. The high-beta names that bounced on Tuesday are giving the gain back, which shows up in the one-day factor's z=-5.4. Names that fell last week kept falling (5-day trend, Short-Term Momentum+0.93%, z=+3.1). The 20-day factor (Medium-Term Momentum, +1.18% at z=+4.2) is rising for the same reason: October's hardest-hit names now sit in its losing basket.
The score has been at or above the 98th percentile over 3, 5, 10 and 20 days. The hedge-fund pain index is 13.6 daily standard deviations below its October 6 peak. That is the 4th-deepest of 32 such events since 2020, and none of the loss has been won back. Goldman Sachs Prime Brokerage had already called October the fastest pullback in risk-taking since March. Hedge-fund longs as a group are holding up, though. Stocks most owned by hedge funds are beating the least owned by 0.31% (Hedge-Fund Ownership, z=+2.8), and the score's 13F-crowding leg is quiet.
The hedge-fund pain index made a new low so far today, with 0% of its loss since the October 6 peak won back. The drawdown ranks 4th-deepest of 32 since 2020.
HF pain index: how much of the loss is back
Date
Sigma Vs Peak
20260924
-1.05
20260925
-0.40
20260928
-0.97
20260929
-0.52
20260930
-0.98
20261001
-0.37
20261002
-0.03
20261005
-0.47
20261006
0.00
20261007
-0.18
20261008
-0.86
20261009
-0.62
20261012
-1.47
20261013
-1.46
20261014
-2.82
20261015
-4.07
20261016
-4.86
20261019
-4.55
20261020
-5.45
20261021
-4.86
20261022
-9.42
20261023
-9.29
20261026
-8.57
20261027
-7.57
20261028
-6.98
20261029
-7.52
20261030
-9.36
20261102
-11.38
20261103
-10.18
20261104
-13.56
Lower Yields and a Weaker Dollar Lifted Homebuilders and Gold Miners
The 10-year Treasury yield is at 4.90%, down 5.0 basis points CNBC. The dollar index is down 0.4% at 101.50 CNBC. Spot gold is up 3.5% at $4,064 an ounce as of 12:20 PM ET CNBC.
ETF
Theme
Today
1d Ago
5d Ago
20d Ago
63d Ago
GDX
gold miners
+8.9%
-2.0%
-6.7%
-12.0%
-7.3%
ITB
homebuilders
+7.6%
-3.6%
+3.5%
+7.6%
-6.5%
XLY
consumer discretionary
+4.6%
-0.7%
+1.6%
+5.0%
-0.9%
XLV
healthcare
+2.7%
-0.3%
+2.7%
+10.1%
+12.5%
SPY
S&P 500
+1.8%
+0.3%
-2.0%
-3.2%
-1.8%
SMH
semiconductors
-2.1%
+2.0%
-7.1%
-18.0%
-9.0%
MTUM
momentum
-2.1%
+1.2%
-7.1%
-14.2%
-10.0%
AIPO
AI power infrastructure
-6.2%
+4.3%
-0.4%
-15.9%
-16.2%
XOP
oil & gas producers
-7.1%
-1.1%
-4.2%
+1.6%
+16.4%
USO
oil
-9.2%
+0.8%
-3.5%
+9.2%
+37.7%
The funds that usually rise with Treasuries are all up today. The funds that usually move against them are mostly down, and they include the chip and AI-power funds that led the past year.
As of 12:20 ET, all 10 of the funds that moved most with Treasuries are up, by 3.0% on average. Only 3 of the 10 that moved most against them are up (IGV, XLK and BITO), and that group is down 3.8% on average.
Funds by sensitivity to Treasuries: today's move
Sym
Fund
Group
Today Pct
Past Year Pct
Tlt Sensitivity
ITB
Home construction
moved most with Treasuries
7.70
-5.60
1.56
XHB
Homebuilders
moved most with Treasuries
5.70
-1.80
1.31
XLU
Utilities
moved most with Treasuries
0.41
0.20
0.63
IYR
US real estate
moved most with Treasuries
2.58
9.20
0.54
XBI
Biotech
moved most with Treasuries
0.96
38.10
0.54
VNQ
REITs
moved most with Treasuries
2.61
10.60
0.54
XLRE
Real estate sector
moved most with Treasuries
2.76
10.50
0.52
XLP
Staples
moved most with Treasuries
3.83
19.80
0.51
LQD
Corporate bonds
moved most with Treasuries
0.65
-1.90
0.49
XLV
Health care
moved most with Treasuries
2.61
29.70
0.49
IGV
Software
moved most against Treasuries
0.88
-11.10
-0.20
MTUM
Momentum stocks
moved most against Treasuries
-2.51
10.20
-0.29
AIPO
AI & power
moved most against Treasuries
-6.78
0.10
-0.33
XLK
Technology
moved most against Treasuries
0.21
18.00
-0.35
SMH
Chips
moved most against Treasuries
-2.60
43.30
-0.45
BITO
Bitcoin futures
moved most against Treasuries
3.14
-31.30
-0.52
XLE
Energy
moved most against Treasuries
-5.83
55.60
-0.59
WGMI
Bitcoin miners
moved most against Treasuries
-8.57
-48.90
-0.76
XOP
Oil producers
moved most against Treasuries
-7.10
54.10
-0.90
USO
Crude oil
moved most against Treasuries
-8.49
118.00
-1.65
Credit Spreads Narrowed and Index Volatility Fell
Corporate credit is holding up while AI stocks fall. LQD and HYG are each up 0.7%, more than the drop in yields explains, so credit spreads narrowed slightly. Meta drew a record €53 billion of orders for its debut euro bond sale Bloomberg. Index options are calming much faster than single-stock options. Implied index volatility (Cboe VIX) is 17.7, down from 20.8 at Tuesday's close. Implied single-stock volatility (Cboe VIXEQ) has eased only to 41.7 from 42.8. Implied correlation among the 50 largest S&P 500 stocks (Cboe COR1M) fell to 10.5 from 16.4, the 4.9th percentile since 2006.
Economic Context
The ADP National Employment Report, released at 8:15 AM ET, showed private payrolls up 86,000 in October, above the 69,000 Reuters consensus adpemploymentreport.comThe Wall Street Journal. Fed funds futures now put the odds of a quarter-point hike at the December 9 decision at 82.6%, up from 77.4% The Wall Street Journal.
The ISM Non-Manufacturing index, released at 10:00 AM ET, fell to 54.5, below the 54.8 consensus and a three-month low The Wall Street Journal.
Factor Regime Reference
Variance decomposition: live intraday — 20261104 session, bracketed against its trailing-year range. Factor returns are trailing through last close. Total cross-sectional dispersion: 99.6%ile of the past year.
Variance mix — % of total, today vs 1d ago vs 1-yr avg
Variance explained — today vs. factor's trailing-year range
Marker = the factor's share of today's total variance, placed in its own trailing-year range (box 25–75%ile, ticks 90%ile and max). Amber marker = unusually load-bearing today (≥90%ile of its own year). Factor name green = up today / red = down.
Correlation & dispersion — realized vs implied
Pairwise realized correlation (20d): 7.27%2.0%ilesince 2020 ·6.3%ile3mmost extreme since 2026-09-08
Realized 20d vol (ann. pts): all stocks 49 vs VIXEQ 42 · index 12 vs VIX 18 · style factors 2995.8%ile
20-day window (19 completed days + today); percentiles vs model history since 2020; '3m' tokens rank vs the trailing 63 trading days; definitions in Terms below. Implied prints (Cboe) are delayed ~15 min. as of 11:58 ET
Top 50 high-beta momentum names (eq-wt, since-2020 rank): -5.0%4.5%ile · rest of market +2.8%
HF de-risking score (since-2020 rank so far today): 99.5%ile today · 98.6%ile 5-day · HF pain index 13.6σ below peak (4th-deepest of 32 since 2020), 0% won back · covering plus selling
Trailing factor returns
Factor
Today
1d
5d
20d
60d
Style-Risk
Beta
-1.97%z-2.0
+1.73%
-6.59%
-14.24%
-11.38%
International
+0.48%z+1.6
-0.36%
-0.14%
-0.93%
-0.24%
Residual Volatility
-0.75%z-1.5
+0.29%
-2.20%
-2.60%
+0.09%
Style
Dividend Yield
-0.70%z-4.0
-0.12%
-1.14%
-0.92%
-0.87%
Growth
-0.71%z-3.0
+0.15%
-1.00%
-1.81%
-1.14%
Profitability
+0.54%z+2.8
-0.16%
+1.32%
+1.71%
+2.06%
Leverage
-0.27%z-1.6
+0.04%
+0.36%
-0.20%
-1.84%
Value
-0.20%z-0.8
-0.13%
+0.05%
-0.13%
-0.08%
Liquidity
+0.14%z+0.5
+0.25%
-0.76%
-1.17%
+1.59%
Size
+0.11%z+0.3
-0.03%
-1.09%
-1.97%
+2.10%
Style-Momentum
One-Day Momentum
-1.49%z-5.4
-0.35%
-0.52%
-0.32%
-3.92%
Medium-Term Momentum
+1.18%z+4.2
-0.58%
+1.36%
-0.25%
-0.61%
Long-Term Momentum
-2.08%z-3.3
+0.20%
-4.96%
-6.68%
-3.00%
Short-Term Momentum
+0.93%z+3.1
-0.05%
+1.01%
+2.73%
+0.76%
Style-Positioning
Short Interest
+0.83%z+5.0
-0.21%
+0.95%
+1.72%
+0.19%
Hedge-Fund Ownership
+0.31%z+2.8
+0.12%
+0.51%
+0.18%
-0.02%
Style-Flow
Short-Sale Activity
-0.51%z-4.7
-0.20%
-0.29%
-0.28%
+0.33%
Morning Activity
-0.00%z-0.0
-0.15%
-0.44%
-0.77%
-0.55%
Thematic
Semiconductors
-3.46%z-5.7
+0.86%
-4.91%
-8.07%
-6.67%
Oil
-2.66%z-5.6
+0.07%
-5.18%
-5.27%
-1.06%
Gold
+0.93%z+2.9
-0.16%
+0.43%
-0.01%
+0.65%
Bitcoin / Crypto
+0.83%z+2.7
-0.06%
-1.22%
-1.05%
+1.34%
Treasury (Duration)
+0.48%z+1.5
-0.35%
+1.14%
+2.95%
-0.92%
China
+0.22%z+0.5
+0.15%
-0.50%
-1.15%
-1.13%
5/20/60d windows include today's session; 1d is the previous session.
Terms
Pairwise realized correlation.Index variance net of the weighted idiosyncratic diagonal, over the cross terms — the estimator used for implied-correlation indices. 20-day window unless noted; history since 2020.
Market variance share.The fraction of cross-sectional variance explained by the market factor — the attribution companion to pairwise correlation, not a substitute for it.
Factor z-score.Today's factor return divided by its daily-return standard deviation over ~1,600 trading days.
Conditional importance.A factor's relative share of what a tree-based fit of today's stock returns explains; sums to 100% across factors.
High-beta momentum cohort.US names above $2B market cap in the top quintile of both raw beta and 12-month momentum; membership frozen at each month's first business day. “Top 50” = the 50 strongest by combined rank.
HF de-risking score.A FactorPulse measure of de-risking in factor returns: the average of four legs, each in its own daily-volatility units and counted only when it moves in the de-risking direction. They are the most-shorted names rising, 12-month momentum winners falling, names crowded in hedge-fund 13F filings falling net of their beta and momentum, and last week's relative moves continuing instead of reverting (counted only alongside another leg). A leg counts as firing at half its daily volatility or more, so a leg can show a small value without firing. Types: A, covering and selling together; B, selling only; C, covering only. Ranked against every session since January 2020. It reads factor returns only, never positions.
Dispersion (realized).Total cross-sectional volatility net of the market component; high dispersion is the flip side of low correlation.
Stock-specific (idiosyncratic) return.The part of a stock's move not explained by the market, style or thematic (industry and theme) factors in the FactorPulse risk model.
Data compiled by FactorPulse AI; edited and verified by Jeff Klein. For informational purposes only. Does not constitute financial advice, an investment recommendation, or an offer to buy or sell any securities. Always consult a qualified financial professional before making investment decisions.