Shares of the companies building America's AI capacity fell after voters turned against data centers. Voters sided against data centers in all but one of 41 local ballot measures across 10 states, and in Texas, Gina Hinojosa beat Greg Abbott in the governor's race on a pledge to immediately halt new data-center approvals. Texas hosts 27% of planned US data-center capacity. The AI power-infrastructure fund AIPO fell about 6%, and the semiconductor fund SMH lost about 3%, adding to an 18% slide over the past month. Chipmaker Nvidia fell 3%. AI builders were hit hardest: CoreWeave's bonds due 2031 dropped to about 80 cents on the dollar, and bitcoin miners Hut 8 and Cipher Digital, which host AI data centers, fell 23% and 19%. The biggest AI spenders went the other way: Microsoft rose about 7% and Amazon about 6%. The S&P 500 rose 1.6% and the Nasdaq-100 0.9%. Chipmaker AMD rose less than 1% even after its fourth-quarter forecast beat estimates on AI chip demand.
The selling landed hardest on the past year's stars. The 50 high-beta stocks that led the past year fell about 5%, while the rest of the market rose nearly 3%. FactorPulse's gauge of hedge-fund pain hit a new low, the fifth-deepest slump of 32 since 2020. The past two weeks most resemble the July 2024 yen-carry selloff and the February 2021 rate shock. Goldman Sachs Prime Brokerage said hedge funds' net leverage fell about 4 percentage points in October, the steepest monthly drop since March. The broad market's calm hid how extreme the day was: individual stocks moved further apart than on any day since July 30, yet the VIX fell to about 17 from about 21.
Oil fell 8% to about $88 a barrel on hopes that a Democratic Congress will limit pressure tactics on Iran and help bring a diplomatic end to the war. The oil fund USO dropped 8%, though it is still up 118% over the past year, and the energy fund XLE lost about 5%. The 10-year Treasury yield slipped to 4.88%, and gold climbed 3.5% to about $4,060 an ounce. The gold-miner fund GDX jumped 9% and the homebuilder fund ITB rose more than 7%. Health stocks rallied on the election result: the health-care fund XLV gained about 3% and health-care company Intuitive Surgical rose 9%. In earnings, drugmaker Novo Nordisk rose 5% on sales of its Wegovy pill, fast-food chain McDonald's gained 6.5% on international sales, and health company CVS Health fell about 13% on a plan to split into two companies.
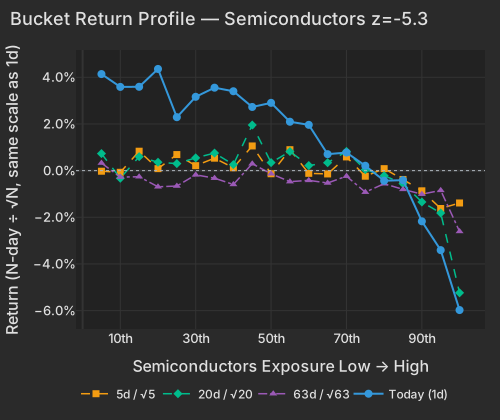
Democrats won both chambers of Congress. Voters sided against data centers in all but one of 41 local ballot measures in 10 states CNBC. In Texas, Gina Hinojosa beat Greg Abbott on a pledge of an immediate moratorium on new data-center approvals. Texas hosts 27% of planned US data-center capacity Financial Times. The S&P 500 rose 1.6% and the Nasdaq-100 0.9%. Underneath, the AI trade split. Chip-exposed stocks trailed the least exposed by 3.21% (Semiconductors, z=-5.3). AIPO fell 6.4%.
| Factor | Return | Z-Score | 5d Z | 20d Z | 63d Z | Category | Direction |
|---|---|---|---|---|---|---|---|
| Semiconductors | -3.21% | -5.3 | -3.4 | -2.9 | -1.4 | Thematic | Chip-exposed stocks lagged |
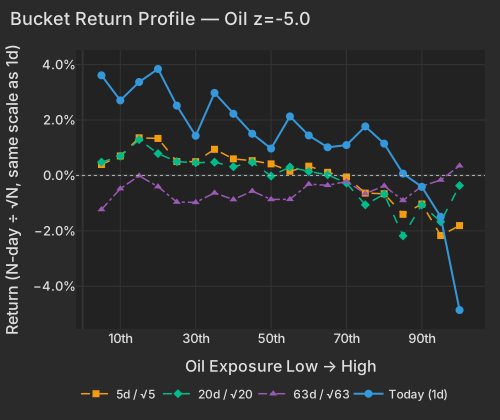
| Oil | -2.40% | -5.0 | -4.6 | -2.4 | 0.0 | Thematic | Oil-exposed stocks lagged |
| One-Day Momentum | -1.33% | -4.8 | -0.6 | -0.1 | -1.7 | Style-Momentum | Yesterday's winners reversed |
| Short-Sale Activity | -0.48% | -4.4 | -1.1 | -0.5 | +0.4 | Style-Flow | Barely short-sold names led |
| Short Interest | +0.73% | +4.3 | +2.3 | +2.2 | +0.2 | Style-Positioning | Most-shorted names led |
| Medium-Term Momentum | +1.06% | +3.7 | +1.9 | -0.3 | -0.2 | Style-Momentum | Last month's winners led |
| Hedge-Fund Ownership | +0.37% | +3.3 | +2.3 | +0.5 | -0.1 | Style-Positioning | Hedge-fund-heavy names led |
| Long-Term Momentum | -1.70% | -2.7 | -3.2 | -2.2 | -0.6 | Style-Momentum | 12-month winners lagged |
AI builders were hit hardest. CoreWeave's notes due 2031 fell to 79.5 cents on the dollar and now yield more than 15%. The election set off a broad sell-off in AI infrastructure stocks Bloomberg. Hut 8 and Cipher Digital, bitcoin miners that host AI data centers, fell 23.0% and 18.9%. Vertiv lost 13.0%, more than half of it the stock's own move. GE Vernova's 9.4% drop came mostly from its factor exposures, led by the reversal of its Tuesday gain. Nvidia fell 3.2%.
The companies with the biggest balance sheets rose instead Financial Times. Microsoft rose 6.7%, about half of it stock-specific. Amazon gained 6.2%, mostly from its factor exposures, chiefly its low exposure to chip stocks.
Today's drop adds to a month of losses. The Semiconductors factor has lost 7.82% over 20 sessions including today. SMH fell 18.0% in the 20 sessions to Tuesday, a result in its worst 1.2% of 20-day stretches since 2019. Over the same window the 10-year Treasury yield fell about 32 basis points. Chips and yields have moved together more closely than in 98% of 20-session windows since 2019: chip stocks now fall when yields fall.
| Bucket | Ret 1D Pct | Ret 5D Norm Pct | Ret 20D Norm Pct | Ret 63D Norm Pct |
|---|---|---|---|---|
| 1 | 4.14 | -0.03 | 0.73 | 0.33 |
| 2 | 3.59 | -0.07 | -0.33 | -0.28 |
| 3 | 3.59 | 0.83 | 0.60 | -0.26 |
| 4 | 4.36 | 0.09 | 0.36 | -0.69 |
| 5 | 2.29 | 0.69 | 0.30 | -0.66 |
| 6 | 3.16 | 0.21 | 0.55 | -0.18 |
| 7 | 3.55 | 0.53 | 0.75 | -0.32 |
| 8 | 3.40 | 0.12 | 0.26 | -0.59 |
| 9 | 2.73 | 1.06 | 1.96 | 0.29 |
| 10 | 2.90 | -0.13 | 0.34 | -0.13 |
| 11 | 2.10 | 0.90 | 0.82 | -0.47 |
| 12 | 1.96 | -0.12 | 0.22 | -0.42 |
| 13 | 0.71 | -0.14 | 0.34 | -0.53 |
| 14 | 0.77 | 0.59 | 0.82 | -0.24 |
| 15 | 0.21 | -0.24 | 0.04 | -0.92 |
| 16 | -0.43 | 0.08 | -0.22 | -0.56 |
| 17 | -0.41 | -0.38 | -0.56 | -0.80 |
| 18 | -2.17 | -0.87 | -1.34 | -1.01 |
| 19 | -3.41 | -1.62 | -1.82 | -0.85 |
| 20 | -5.98 | -1.39 | -5.24 | -2.61 |
Strong company results did not stop the selling. AMD's fourth-quarter forecast beat estimates on AI chip demand Bloomberg, but the stock closed up only 0.8%. Our model credits AMD with a stock-specific gain of 6.7%. Its style exposures, mainly beta, took away 4.9%. Qualcomm fell 6.0% in late trading after the close, when it was due to report. Few companies are getting much credit for results this season. Among the 500 largest US companies, 23% of reporters so far have risen 2σ or more on their own news, weighted by size. That is below every one of the past eight seasons at the same point.
Earnings reactions in the regular sessionReporters worth over $100 billion, or moving more than 10% with a value above $5 billion
| Company | Move | Stock-specific | Market cap | Revenue YoY | Margin YoY | What drove it |
|---|---|---|---|---|---|---|
| Everus Construction ECG | -28.9% | -23.7% | $6B | — | — | — |
| Fidelity National Information Services FIS | -23.4% | -27.8% | $20B | — | — | weak 2027 outlook and CFO departure |
| Unum UNM | -17.8% | -19.3% | $14B | — | — | higher disability claims, $853 million investment loss |
| Trimble TRMB | -17.3% | -24.2% | $15B | — | — | cut full-year recurring revenue growth guidance |
| SM Energy SM | -15.1% | -6.6% | $9B | — | — | — |
| Datadog DDOG | -14.2% | -10.3% | $79B | +35% | +6.9 pts operating | cautious fourth-quarter revenue outlook |
| Mercury General MCY | -13.6% | -14.5% | $6B | — | — | — |
| CVS Health CVS | -12.6% | -10.4% | $117B | +5% | +0.5 pts adj. operating | plan to split into two companies |
| Kratos Defense & Security Solutions KTOS | -12.3% | -10.4% | $8B | — | — | — |
| Advanced Micro Devices AMD | +0.8% | +6.7% | $790B | +45% | +5.1 pts adj. operating | fourth-quarter forecast beat on AI chip demand Bloomberg |
| Amgen AMGN | +3.7% | -1.5% | $249B | +8% | +0.1 pts adj. operating | — |
| Arista Networks ANET | +4.9% | +7.7% | $214B | +58% | +0.5 pts adj. operating | 58.5% revenue growth, raised full-year guidance |
| Novo Nordisk NVO | +5.0% | -0.1% | $177B | — | — | Wegovy pill sales, raised full-year guidance The Wall Street Journal |
| Uber Technologies UBER | +5.0% | -0.5% | $136B | +10% | +3.2 pts adj. operating | earnings beat on 20% gross bookings growth |
| McDonald's MCD | +6.5% | +0.5% | $186B | +1% | +3.0 pts adj. operating | earnings beat on international sales |
| Booking BKNG | +9.8% | +3.7% | $117B | -1% | -0.2 pts operating | earnings beat despite $900 million FTC charge |
| GXO Logistics GXO | +10.0% | +2.5% | $6B | — | — | — |
| Wayfair W | +10.8% | +3.1% | $15B | — | — | — |
| Mirum Pharmaceuticals MIRM | +11.0% | +11.9% | $6B | — | — | — |
| Installed Building Products IBP | +11.0% | +4.1% | $6B | — | — | — |
| Coupang CPNG | +11.8% | +3.6% | $27B | +7% | -6.3 pts operating | — |
| Zimmer Biomet ZBH | +12.9% | +10.7% | $18B | — | — | — |
| Stanley Black & Decker SWK | +13.3% | +10.2% | $16B | — | — | — |
| Performance Food PFGC | +13.6% | +6.2% | $15B | — | — | — |
| Trex TREX | +14.4% | +8.9% | $5B | — | — | — |
| Block XYZ | +15.2% | +8.1% | $46B | +10% | +5.9 pts adj. operating | — |
| Medline MDLN | +18.6% | +14.8% | $30B | +10% | -1.7 pts operating | — |
| Procore Technologies PCOR | +19.7% | +11.5% | $10B | — | — | — |
| Duolingo DUOL | +26.4% | +21.9% | $6B | — | — | — |
Stock-specific: the part of a stock's move not explained by the market, style or thematic (industry and theme) factors in the FactorPulse risk model.
Revenue and margin from the company's earnings release, year over year; margin change in percentage points; — where the release is not parsed or the figures failed checks.
Of the 500 largest companies, 340 have reported (73% of market cap), on day 25 of the season.
How earnings reactions split, day 25 of the seasonThe 500 largest US companies with a confirmed earnings reaction so far (320), vs the same day in the past eight seasons and in four-season stretches back to mid-2020

| Season | ≤ −5σ | −5 to −2σ | −2 to 0σ | 0 to 2σ | 2 to 5σ | ≥ 5σ |
|---|---|---|---|---|---|---|
| This season | 8% | 17% | 29% | 23% | 19% | 4% |
| Past 8 seasons | 15% | 19% | 17% | 16% | 17% | 15% |
| Q2 2026 | 14% | 21% | 16% | 17% | 19% | 14% |
| Q1 2026 | 12% | 20% | 14% | 19% | 18% | 17% |
| Q4 2025 | 19% | 17% | 19% | 13% | 18% | 14% |
| Q3 2025 | 11% | 18% | 21% | 17% | 17% | 16% |
| Q2 2025 | 16% | 22% | 15% | 16% | 15% | 16% |
| Q1 2025 | 20% | 17% | 16% | 19% | 19% | 9% |
| Q4 2024 | 18% | 19% | 17% | 17% | 15% | 14% |
| Q3 2024 | 17% | 21% | 15% | 12% | 19% | 16% |
| Q3 '23–Q2 '24 | 16% | 17% | 16% | 15% | 19% | 17% |
| Q3 '22–Q2 '23 | 12% | 20% | 18% | 17% | 22% | 11% |
| Q3 '21–Q2 '22 | 13% | 18% | 15% | 18% | 23% | 12% |
| Q3 '20–Q2 '21 | 7% | 21% | 28% | 23% | 17% | 4% |
σ: a stock's earnings-day stock-specific move divided by its typical daily stock-specific move over the past year. Each bar is cut at the same business day of the season; companies weighted by the square root of market cap.
Our HF de-risking score ranked 16th of 1,680 sessions since 2020, in the top 1%. Three of its four signals fired: 12-month winners fell, the most-shorted names rose, and last week's relative moves continued instead of reversing. 12-month momentum lost 1.70% (Long-Term Momentum, z=-2.7). The most-shorted stocks beat the least shorted by 0.73% (Short Interest, z=+4.3). The 20-day score is at the 98.6th percentile: the factor pattern of a de-gross has now run for a month.
The hedge-fund pain index is 12.8 daily standard deviations below its October 6 peak, the 5th-deepest of 32 such events since 2020. It has won back none of the loss. The past two weeks most resemble two earlier episodes: the July 2024 yen-carry selloff and the February 2021 rate shock. Goldman Sachs Prime Brokerage reported that hedge-fund net leverage fell 4.2 percentage points in October to 73.4%, the steepest monthly drop since March. The desk's data covers October, and our gauge was still making new lows today.

| Date | Type | Most-shorted names up | 12-month winners down | 13F-crowded names down | Last week's moves continuing |
|---|---|---|---|---|---|
| 20261015 | A | 1.10 | 1.99 | 0.00 | 0.93 |
| 20261016 | B | 0.32 | 0.52 | 0.91 | 0.19 |
| 20261019 | C | 0.74 | 0.00 | 0.00 | 0.00 |
| 20261020 | C | 0.80 | 0.13 | 0.00 | 1.10 |
| 20261021 | B | 0.42 | 0.00 | 2.35 | 0.00 |
| 20261022 | A | 1.86 | 2.34 | 0.33 | 3.21 |
| 20261023 | B | 0.04 | 0.00 | 1.42 | 0.58 |
| 20261026 | — | 0.00 | 0.00 | 0.14 | 0.00 |
| 20261027 | — | 0.00 | 0.00 | 0.42 | 0.00 |
| 20261028 | — | 0.00 | 0.00 | 0.43 | 0.00 |
| 20261029 | A | 1.06 | 0.69 | 0.00 | 0.66 |
| 20261030 | A | 0.82 | 0.71 | 0.72 | 0.00 |
| 20261102 | A | 0.83 | 2.62 | 0.00 | 0.52 |
| 20261103 | — | 0.00 | 0.00 | 0.00 | 0.00 |
| 20261104 | A | 1.92 | 2.11 | 0.00 | 2.25 |
Background: our research note Factor Fingerprints of Hedge Fund Deleveraging Events compares October with 31 hedge-fund deleveraging events since 2020.
The losses fell heaviest on the stocks that led the past year. The top 50 high-beta momentum names fell 5.2% while the rest of the market rose 2.6%, its 34th-best session since 2020. The wider group of about 95 high-beta momentum names fell 3.2%, so the selling hit hardest the names that most fit the profile. Beta has lost 14.03% over 20 sessions including today. Stocks heavily owned by hedge funds held up. They beat lightly owned names by 0.37% (Hedge-Fund Ownership, z=+3.3), and by 0.27% on a raw basis.
The faster factors show how the week is trading. Yesterday's winners trailed yesterday's decliners by 1.33% (One-Day Momentum, z=-4.8), reversing Tuesday's high-beta bounce. Last week's moves kept going (Short-Term Momentum +0.75%, z=+2.5). 20-day momentum (Medium-Term Momentum in the table) rose 1.06% at z=+3.7. After a month of selling, the high-beta names that fell furthest now sit at the bottom of that factor, so its gain is the same selloff showing up under another factor.
Index volatility hides most of this. Stock-level dispersion reached 83.3 vol points, the widest since July 30 and higher than on 99.6% of days in the past year. VIX fell to 16.8 from 20.8. Implied single-stock volatility (Cboe VIXEQ) eased only to 41.2 from 42.8. Implied correlation among the 50 largest S&P 500 stocks (Cboe COR1M) fell to 10.0 from 16.4. Over 20 sessions, realized correlation between stocks is 7.1%, its lowest since September 8 and in the 1.7th percentile since 2020.
The 10-year Treasury yield fell 6.6 basis points to 4.88% CNBC. The 2-year yield fell 4.1 basis points to 4.57% CNBC. Futures still put the odds of a December rate hike near 83% after the ADP payrolls beat adpemploymentreport.com The Wall Street Journal. Long-term yields fell further than short-term ones: markets still expect a hike, but now see less long-run inflation and government borrowing. Spot gold rose 3.5% to $4,064.55 at 4:24 PM ET CNBC. The dollar index slipped 0.4% to 101.50 CNBC.

| Sym | Fund | Group | Today Pct | Past Year Pct | Tlt Sensitivity |
|---|---|---|---|---|---|
| ITB | Home construction | moved most with Treasuries | 7.21 | -5.60 | 1.56 |
| XHB | Homebuilders | moved most with Treasuries | 5.51 | -1.80 | 1.31 |
| XLU | Utilities | moved most with Treasuries | 0.30 | 0.20 | 0.63 |
| IYR | US real estate | moved most with Treasuries | 3.28 | 9.20 | 0.54 |
| XBI | Biotech | moved most with Treasuries | 2.54 | 38.10 | 0.54 |
| VNQ | REITs | moved most with Treasuries | 2.99 | 10.60 | 0.54 |
| XLRE | Real estate sector | moved most with Treasuries | 3.29 | 10.50 | 0.52 |
| XLP | Staples | moved most with Treasuries | 3.52 | 19.80 | 0.51 |
| LQD | Corporate bonds | moved most with Treasuries | 0.72 | -1.90 | 0.49 |
| XLV | Health care | moved most with Treasuries | 3.18 | 29.70 | 0.49 |
| IGV | Software | moved most against Treasuries | 1.63 | -11.10 | -0.20 |
| MTUM | Momentum stocks | moved most against Treasuries | -1.92 | 10.20 | -0.29 |
| AIPO | AI & power | moved most against Treasuries | -5.94 | 0.10 | -0.33 |
| XLK | Technology | moved most against Treasuries | 0.11 | 18.00 | -0.35 |
| SMH | Chips | moved most against Treasuries | -2.62 | 43.30 | -0.45 |
| BITO | Bitcoin futures | moved most against Treasuries | 2.89 | -31.30 | -0.52 |
| XLE | Energy | moved most against Treasuries | -4.78 | 55.60 | -0.59 |
| WGMI | Bitcoin miners | moved most against Treasuries | -8.24 | -48.90 | -0.76 |
| XOP | Oil producers | moved most against Treasuries | -6.42 | 54.10 | -0.90 |
| USO | Crude oil | moved most against Treasuries | -8.28 | 118.00 | -1.65 |
Health care also had its own story. XLV rose 3.1%, putting its 20-day gain in the 98.8th percentile since 2019. Intuitive Surgical jumped 9.4% as health stocks rallied on the election result Morningstar. The table shows the spread: funds tied to lower yields and gold sit at the top, and the AI, chip and oil funds at the bottom.
| ETF | Theme | Today | 1d Ago | 5d Ago | 20d Ago | 63d Ago |
|---|---|---|---|---|---|---|
| GDX | gold miners | +9.0% | -2.0% | -6.7% | -12.0% | -7.3% |
| ITB | homebuilders | +7.5% | -3.6% | +3.5% | +7.6% | -6.5% |
| XLV | health care | +3.1% | -0.3% | +2.7% | +10.1% | +12.5% |
| SPY | S&P 500 | +1.6% | +0.3% | -2.0% | -3.2% | -1.8% |
| QQQ | Nasdaq-100 | +0.9% | +0.6% | -5.0% | -9.8% | -4.4% |
| SMH | semiconductors | -2.9% | +2.0% | -7.1% | -18.0% | -9.0% |
| XLE | energy | -4.7% | -0.9% | -2.2% | +4.6% | +17.1% |
| AIPO | AI power infrastructure | -6.4% | +4.3% | -0.4% | -15.9% | -16.2% |
| USO | oil | -8.0% | +0.8% | -3.5% | +9.2% | +37.7% |
| WGMI | bitcoin miners | -8.8% | +11.1% | -6.1% | -34.6% | -41.6% |
Corporate bonds split the same way stocks did. LQD, an investment-grade bond fund, rose 0.8%, close to what the drop in yields explains. Meta's €9 billion debut euro bond drew record demand Bloomberg. Judging by fund prices, high-yield spreads still widened roughly 40 basis points over the month to Tuesday.
WTI crude was at $88.45 a barrel at 4:13 PM ET, down 8.0% on the day CNBC. Traders expect a Democratic Congress to limit pressure tactics on Iran and to lower the war risk built into crude prices. Oil-exposed stocks trailed by 2.40% (Oil, z=-5.0), and by 4.93% over five sessions. Oil exposure added more to stock-level volatility today than on any session since 2020. Kosmos Energy fell 13.7%, almost all of it from its factor exposures, oil first. The selling hit the past year's biggest winner: USO is still up 118.0% over 12 months.
| Bucket | Ret 1D Pct | Ret 5D Norm Pct | Ret 20D Norm Pct | Ret 63D Norm Pct |
|---|---|---|---|---|
| 1 | 3.61 | 0.39 | 0.48 | -1.23 |
| 2 | 2.71 | 0.70 | 0.69 | -0.48 |
| 3 | 3.37 | 1.36 | 1.29 | -0.01 |
| 4 | 3.84 | 1.34 | 0.79 | -0.41 |
| 5 | 2.52 | 0.50 | 0.50 | -0.96 |
| 6 | 1.43 | 0.50 | 0.46 | -0.97 |
| 7 | 2.98 | 0.94 | 0.48 | -0.63 |
| 8 | 2.22 | 0.60 | 0.31 | -0.87 |
| 9 | 1.50 | 0.53 | 0.48 | -0.57 |
| 10 | 0.97 | 0.42 | -0.02 | -0.87 |
| 11 | 2.13 | 0.15 | 0.30 | -0.86 |
| 12 | 1.44 | 0.33 | 0.14 | -0.31 |
| 13 | 1.02 | 0.11 | 0.02 | -0.36 |
| 14 | 1.09 | -0.06 | -0.28 | -0.22 |
| 15 | 1.77 | -0.64 | -1.06 | -0.65 |
| 16 | 1.15 | -0.66 | -0.67 | -0.38 |
| 17 | 0.07 | -1.40 | -2.18 | -0.90 |
| 18 | -0.41 | -1.03 | -1.06 | -0.39 |
| 19 | -1.49 | -2.17 | -1.67 | -0.17 |
| 20 | -4.86 | -1.81 | -0.37 | 0.35 |
ConocoPhillips and Canadian Natural Resources report before Thursday's open.
The ADP National Employment Report, released at 8:15 AM ET, showed private employers added 86,000 jobs in October, above forecasts The Wall Street Journal. The ISM Non-Manufacturing index, released at 10:00 AM ET, slipped to 54.5 from 54.9 The Wall Street Journal. That was below the 54.8 consensus, and prices paid stayed high at 73.0.
Variance decomposition: live intraday — 20261104 session, bracketed against its trailing-year range. Factor returns are trailing through last close. Total cross-sectional dispersion: 99.6%ile of the past year.
Variance mix — % of total, today vs 1d ago vs 1-yr avg
market 59%ile style 77%ile thematic 100.0%ile idiosyncratic 19%ile
Variance explained — today vs. factor's trailing-year range
Marker = the factor's share of today's total variance, placed in its own trailing-year range (box 25–75%ile, ticks 90%ile and max). Amber marker = unusually load-bearing today (≥90%ile of its own year). Factor name green = up today / red = down.
Correlation & dispersion — realized vs implied
Pairwise realized correlation (20d): 7.09% 1.7%ile since 2020 · 6.3%ile 3m most extreme since 2026-09-08
Top-500 pairwise: 8.68% 5.5%ile since 2020 · 24%ile 3m · implied (Cboe COR1M): 10.03 4.4%ile since 2006 (gap -1.4pp)
Realized 20d vol (ann. pts): all stocks 49 vs VIXEQ 41 · index 12 vs VIX 17 · style factors 28 95.5%ile
20-day window (19 completed days + today); percentiles vs model history since 2020; '3m' tokens rank vs the trailing 63 trading days; definitions in Terms below. Implied prints (Cboe) are delayed ~15 min. as of 16:21 ET
Top 50 high-beta momentum names (eq-wt, since-2020 rank): -5.2% 4.1%ile · rest of market +2.6%
HF de-risking score (since-2020 rank): 99.0%ile today · 98.2%ile 5-day · HF pain index 12.8σ below peak (5th-deepest of 32 since 2020), 0% won back · covering plus selling
| Factor | Today | 1d | 5d | 20d | 60d |
|---|---|---|---|---|---|
| Style-Risk | |||||
| Beta | -1.75% z-1.8 | +1.73% | -6.37% | -14.03% | -11.17% |
| Residual Volatility | -0.76% z-1.5 | +0.29% | -2.21% | -2.61% | +0.09% |
| International | +0.32% z+1.1 | -0.36% | -0.31% | -1.09% | -0.40% |
| Style | |||||
| Dividend Yield | -0.68% z-3.9 | -0.12% | -1.13% | -0.90% | -0.85% |
| Growth | -0.85% z-3.6 | +0.15% | -1.14% | -1.95% | -1.28% |
| Profitability | +0.34% z+1.8 | -0.16% | +1.13% | +1.52% | +1.87% |
| Leverage | -0.28% z-1.7 | +0.04% | +0.35% | -0.21% | -1.86% |
| Value | -0.35% z-1.5 | -0.13% | -0.10% | -0.29% | -0.24% |
| Liquidity | +0.09% z+0.4 | +0.25% | -0.81% | -1.22% | +1.54% |
| Size | +0.06% z+0.2 | -0.03% | -1.15% | -2.03% | +2.05% |
| Style-Momentum | |||||
| One-Day Momentum | -1.33% z-4.8 | -0.35% | -0.36% | -0.16% | -3.76% |
| Medium-Term Momentum | +1.06% z+3.7 | -0.58% | +1.24% | -0.37% | -0.73% |
| Long-Term Momentum | -1.70% z-2.7 | +0.20% | -4.57% | -6.29% | -2.62% |
| Short-Term Momentum | +0.75% z+2.5 | -0.05% | +0.83% | +2.55% | +0.58% |
| Style-Positioning | |||||
| Short Interest | +0.73% z+4.3 | -0.21% | +0.85% | +1.62% | +0.08% |
| Hedge-Fund Ownership | +0.37% z+3.3 | +0.12% | +0.57% | +0.24% | +0.04% |
| Style-Flow | |||||
| Short-Sale Activity | -0.48% z-4.4 | -0.20% | -0.26% | -0.26% | +0.36% |
| Morning Activity | -0.00% z-0.0 | -0.15% | -0.44% | -0.77% | -0.55% |
| Thematic | |||||
| Semiconductors | -3.21% z-5.3 | +0.86% | -4.66% | -7.82% | -6.43% |
| Oil | -2.40% z-5.0 | +0.07% | -4.93% | -5.02% | -0.80% |
| Gold | +0.90% z+2.8 | -0.16% | +0.40% | -0.04% | +0.62% |
| Bitcoin / Crypto | +0.83% z+2.7 | -0.06% | -1.22% | -1.05% | +1.34% |
| Treasury (Duration) | +0.38% z+1.2 | -0.35% | +1.04% | +2.85% | -1.02% |
| China | +0.34% z+0.8 | +0.15% | -0.37% | -1.03% | -1.00% |
5/20/60d windows include today's session; 1d is the previous session.
Pairwise realized correlation. Index variance net of the weighted idiosyncratic diagonal, over the cross terms — the estimator used for implied-correlation indices. 20-day window unless noted; history since 2020.
Market variance share. The fraction of cross-sectional variance explained by the market factor — the attribution companion to pairwise correlation, not a substitute for it.
Factor z-score. Today's factor return divided by its daily-return standard deviation over ~1,600 trading days.
Conditional importance. A factor's relative share of what a tree-based fit of today's stock returns explains; sums to 100% across factors.
High-beta momentum cohort. US names above $2B market cap in the top quintile of both raw beta and 12-month momentum; membership frozen at each month's first business day. “Top 50” = the 50 strongest by combined rank.
HF de-risking score. A FactorPulse measure of de-risking in factor returns: the average of four legs, each in its own daily-volatility units and counted only when it moves in the de-risking direction. They are the most-shorted names rising, 12-month momentum winners falling, names crowded in hedge-fund 13F filings falling net of their beta and momentum, and last week's relative moves continuing instead of reverting (counted only alongside another leg). A leg counts as firing at half its daily volatility or more, so a leg can show a small value without firing. Types: A, covering and selling together; B, selling only; C, covering only. Ranked against every session since January 2020. It reads factor returns only, never positions.
Dispersion (realized). Total cross-sectional volatility net of the market component; high dispersion is the flip side of low correlation.
Stock-specific (idiosyncratic) return. The part of a stock's move not explained by the market, style or thematic (industry and theme) factors in the FactorPulse risk model.
VIXEQ / DSPX / COR1M. Cboe implied indices: single-stock volatility, dispersion, and 1-month implied correlation (top-50 S&P names). Quotes delayed ~15 minutes.
Data compiled by FactorPulse AI; edited and verified by Jeff Klein. For informational purposes only. Does not constitute financial advice, an investment recommendation, or an offer to buy or sell any securities. Always consult a qualified financial professional before making investment decisions.
For more on factor construction methodology, see www.factorpulse.com/glossary.
← FactorPulse · All Digests · Follow us on X
FactorPulse is free during launch · Sign up free (no credit card)