Apple Drops 4% on Memory Costs; Shopify Falls 17% on a Revenue Miss
Macro:Apple's holiday guidance shows the memory-chip shortage now squeezing margins at the companies that buy chips, and Zebra Technologies flagged the same cost. Oil fell again on easing Iran-war worries, with WTI at $95.29 at 8:30 AM ET.
Market Moves: The S&P 500rose 0.2% pre-market. The Russell 2000rose 0.6%. Memory and chip ETFs led a bounce in high-beta names, with DRAM up 4.2%. Oil funds lagged as crude slid again, with USOfalling 1.8%.
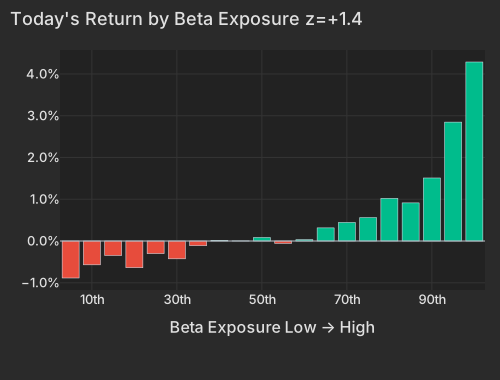
Factors:Beta rose 1.33%, z=+1.4, as high-beta names led the bounce. Semiconductors added 0.61%, z=+1.0, carrying the chip rally. 20-day momentum fell 0.41%, z=-1.4, as last month's losers beat its winners.
Micro:Applefell 4.3% after memory costs cut its holiday-quarter gross-margin guidance. Zebra Technologiesfell 16.2% as memory component costs and business mix cut gross margin. Shopifyfell 16.5% on its first quarterly revenue miss since 2022.
Watch: Will tonight's midterm results and after-the-close reports from AMD and Arista Networks, the first test for AI hardware stocks after two days of selling, extend the chip bounce?
November 3, 2026 · 08:48 ET · Updated 09:10 ET · pre-market
Rising memory-chip prices are eating into Apple's profits. The iPhone maker is down about 4% before the opening bell, erasing roughly $200 billion in market value, after forecasting a holiday-quarter gross margin of 45% to 46%, down from about 48%. Chief Executive John Ternus called the rise in memory prices "unprecedented." Apple's inventory more than doubled from a year earlier to $14.5 billion, a sign it may be buying ahead of further increases. Slower growth in services also weighed on the outlook, outweighing a quarter in which revenue rose 12% to about $114 billion and beat forecasts. The S&P 500is up 0.2%.
Earnings disappointments drew heavy selling this morning. E-commerce platform Shopifyis down about 17% after missing revenue estimates for the first time since 2022, and data-analytics company Palantiris down about 5% as growth in the value of its contracts slowed sharply. Good results are rarely rewarded this season: weighted by size, about a fifth of the big companies that have reported posted solid gains on their results, against about a third at this point in each of the past eight seasons. Chipmaker AMD, up 4% before the open, reports after the close.
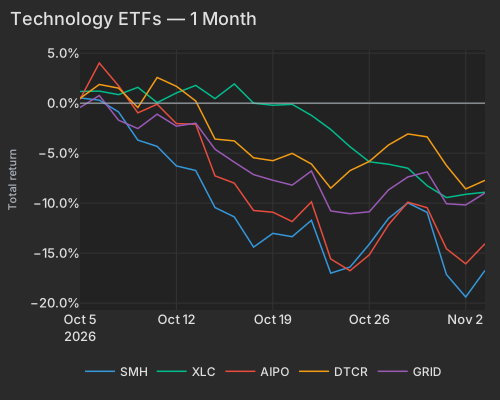
Chip stocks are leading an early bounce in the high-beta shares that fell hardest over the past month. The semiconductor fund SMHis up about 3% after losing about 20% over the prior 20 sessions, one of its worst stretches since 2019. Memory-chip makers Micron and Sandiskare up about 5% and 6%, but mostly on the broad rebound rather than their own news. The market is treating Apple's warning as Apple's problem rather than a windfall for its suppliers. Goldman Sachs said hedge funds cut their market exposure in October at the fastest pace since March. Recent winners are giving some ground: the consumer-staples fund XLPis down about 1% after a 12% gain over the past month. Oil is down about 1% to around $95 a barrel, following Monday's sharp drop on easing worries over the Iran war. Voters go to the polls in today's midterm elections, and September job-openings data are due at 10 a.m.
Apple Down 4% as Memory Prices Squeeze Its Margin Guide
Apple beat on fiscal fourth-quarter results. Revenue rose 12% to $114.48 billion and earnings per share came in at $2.10. CNBC It guided December-quarter gross margin to 45%–46%, down from 47.9%, and Ternus called the rise in memory prices "unprecedented." Without tariff refunds, gross margin would have fallen about a point from the prior quarter, mainly because of memory. 9to5Mac Inventory more than doubled year over year to $14.5 billion, which suggests Apple is buying ahead of further price rises. MacRumors
Memory is not the only drag on Apple's guidance: slower services growth also weighed. CNBC Zebra Technologies points to the same cost problem. It is down 16.2% after reporting a 230-basis-point gross-margin contraction, driven mainly by higher memory component costs and business mix. Zebra's revenue rose 22.3%, but the market is focused on margins rather than demand.
Both companies grew revenue, and both stocks fell. This season's share of solid stock-specific gains, 22% by size, is below every one of the past eight seasons at this point, none of which was under 29%; 43 reactions are still being priced today.
Earnings reactions in early tradingReporters worth over $100 billion, or moving more than 10% with a value above $5 billion
Stock-specific: the part of a stock's move not explained by the market, style or thematic (industry and theme) factors in the FactorPulse risk model.
Revenue and margin from the company's earnings release, year over year; margin change in percentage points; — where the release is not parsed or the figures failed checks.
Light volume: the company's earnings filing confirms the report, but trading volume has not caught up yet, so the move is an early read.
Of the 500 largest companies, 316 have reported (70% of market cap), on day 24 of the season.
How earnings reactions split, day 24 of the seasonThe 500 largest US companies with a confirmed earnings reaction so far (283), vs the same day in the past eight seasons and in four-season stretches back to mid-2020
Weighted by size, 22% of this season's reporters rose 2σ or more on a stock-specific basis, against 33% at this point in the past eight seasons; 28% fell 2σ or more (past: 34%).
Earnings reactions this season vs the past eight seasons, day 24
Season
≤ −5σ
−5 to −2σ
−2 to 0σ
0 to 2σ
2 to 5σ
≥ 5σ
This season
9%
19%
26%
24%
18%
4%
Past 8 seasons
16%
19%
17%
16%
17%
15%
Q2 2026
15%
20%
16%
16%
19%
15%
Q1 2026
12%
20%
13%
19%
19%
16%
Q4 2025
18%
17%
20%
12%
18%
15%
Q3 2025
11%
19%
19%
19%
16%
17%
Q2 2025
15%
22%
16%
16%
15%
17%
Q1 2025
21%
15%
16%
20%
19%
9%
Q4 2024
19%
17%
18%
18%
15%
14%
Q3 2024
16%
20%
16%
12%
19%
17%
Q3 '23–Q2 '24
16%
18%
15%
15%
19%
16%
Q3 '22–Q2 '23
12%
20%
18%
17%
21%
11%
Q3 '21–Q2 '22
13%
19%
14%
18%
24%
12%
Q3 '20–Q2 '21
7%
20%
29%
23%
17%
4%
σ: a stock's earnings-day stock-specific move divided by its typical daily stock-specific move over the past year. Each bar is cut at the same business day of the season; companies weighted by the square root of market cap.
Memory-Chip Makers Rise With the Beta Bounce
Micron is up 4.7% and Sandisk is up 5.7%. The Roundhill Memory ETF (DRAM) is up 4.2% after losing 24.9% over the prior 20 sessions. Most of Micron's gain comes from its style exposures, about 3.1%, led by beta. Only 1.0% is its own move, and Sandisk's own move is 0.7%. The cost shows up in Apple's price, but the market is not yet giving the suppliers credit for it.
Chip stocks are leading a broad pre-market bounce in the most market-sensitive names. Beta is up 1.33% at z=+1.4, and the Semiconductors factor is up 0.61% at z=+1.0. Intel is up 4.2%, all of it from common factors and none of it company-specific. 20-day momentum (Medium-Term Momentum in the table) is at -0.41%, z=-1.4. That means the past month's losers are beating its winners, which is the same bounce seen from the other side. Consumer staples (XLP) are down 0.9% after a 12.1% 20-day gain.
Nothing in the morning factor moves points to forced buying. The most-shorted names are behind the un-shorted ones (Short Interest-0.10%, z=-0.6). Hedge-fund-owned names are flat, both after adjusting for other factors and on a raw basis. None of the legs of our HF de-risking score has fired so far in pre-market trading.
The gain is concentrated at the high end of the beta range: the highest-exposure bucket is up 4.2%.
Today's Return by Beta Exposure z=+1.4
Bucket
Avg Ret Pct
1
-0.89
2
-0.57
3
-0.35
4
-0.64
5
-0.30
6
-0.43
7
-0.11
8
0.01
9
0.00
10
0.08
11
-0.06
12
0.03
13
0.31
14
0.44
15
0.56
16
1.02
17
0.91
18
1.51
19
2.85
20
4.29
October's 13% Beta Slide Is Still the Bigger Number
This morning's gain is small next to Beta's 13.46% 20-day loss (z=-3.1). SMH lost 19.8% over the 20 sessions through Monday. That ranks in the bottom 0.7% of 20-session windows since 2019.
ETF
Theme
Today
1d Ago
5d Ago
20d Ago
63d Ago
DRAM
memory chips & storage
+4.2%
-3.5%
-4.2%
-24.9%
-15.6%
EWY
south korea
+3.4%
-0.8%
-0.7%
-20.8%
-11.4%
SMH
semiconductors
+3.3%
-2.7%
-6.2%
-19.8%
-11.7%
AIPO
AI power infrastructure
+2.8%
-1.8%
-1.1%
-16.4%
-20.0%
MTUM
momentum
+1.8%
-3.2%
-6.6%
-14.9%
-12.0%
SPY
large cap
+0.2%
-0.5%
-1.7%
-2.9%
-2.3%
XLP
consumer staples
-0.9%
+1.6%
+3.3%
+12.1%
+7.1%
XLE
energy
-1.1%
-4.0%
-3.4%
+6.0%
+15.6%
USO
oil
-1.8%
-7.1%
-5.6%
+9.0%
+35.5%
Even with this morning's gain, SMH is down 16.7% over the month.
As of Monday's close, our HF de-risking score was at the 97.1st percentile since 2020 over 10 days and the 97.4th over 20 days. Over those windows, 12-month winners fell and the most-shorted names rose, a pattern consistent with a de-gross. As of the same close, the hedge-fund pain index was 11.4 daily standard deviations below its October 6 peak. That is the 6th-deepest of 32 such drops since 2020, and its lowest point so far was Monday's close. Goldman Sachs Prime Brokerage reported that net leverage fell 4.2 percentage points in October to 73.4%, its fastest monthly de-risking since March.
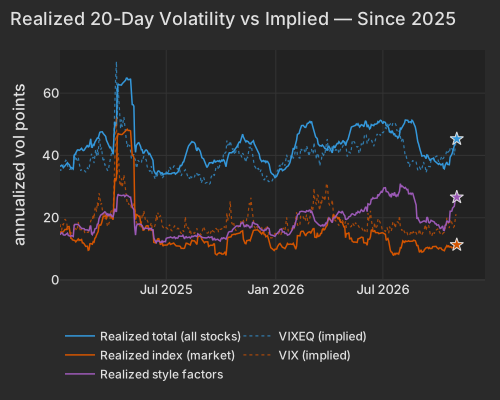
Single stocks are moving far more than the index. Realized 20-day volatility from style factors is 26.6 vol points, in the 90.1st percentile since 2020, while the index component is 11.3 points. Realized correlation remains near its lows: 7.79% over 20 days, in the 3.2nd percentile since 2020. Implied single-stock volatility (Cboe VIXEQ) is 44.67 and implied index volatility (Cboe VIX) is 21.41. Both are at the top of their 20-session ranges.
Realized 20-day volatility since 2025, single stocks and style factors against the index, with Cboe's implied VIXEQ and VIX for comparison.
Realized 20-Day Volatility vs Implied — Since 2025
Series
Today Vol Pts
Prev Close Vol Pts
total
45.30
45.60
market
11.30
11.38
style
26.60
26.61
Oil Falls Again While Yields Edge Higher
WTI crude was at $95.29 at 8:30 AM ET, down 1.2%. CNBC USO is trading at 3.2× its typical pace after Monday's 7.1% drop on easing worries over the Iran war. The ten-year Treasury yield is 4.917%, up 2.3 basis points. CNBC Chip stocks have been moving with yields: over the past ten sessions SMH fell 7.3% as the 10-year yield dropped 24 basis points. Over 20 sessions, that link is tighter than in 97% of comparable stretches since 2019. Chips and yields falling together suggests investors are pricing slower growth.
Based on bond-fund prices, high-yield spreads are roughly 40 basis points wider over the past month and investment-grade spreads roughly 20 wider. Voters are going to the polls in today's US midterm elections. WSJ AMD, up 4.2% pre-market, reports after the close, along with Arista Networks.
Economic Context
September JOLTS job openings are due at 10:00 AM ET bls.gov. Economists expect openings to keep falling as demand for workers gradually cools.
Factor Regime Reference
Variance decomposition: live intraday — 20261103 session, bracketed against its trailing-year range. Factor returns are trailing through last close. Total cross-sectional dispersion: 6.4%ile of the past year.
Variance mix — % of total, today vs 1d ago vs 1-yr avg
Variance explained — today vs. factor's trailing-year range
Marker = the factor's share of today's total variance, placed in its own trailing-year range (box 25–75%ile, ticks 90%ile and max). Amber marker = unusually load-bearing today (≥90%ile of its own year). Factor name green = up today / red = down.
Realized 20d vol (ann. pts): all stocks 45 vs VIXEQ 45 · index 11 vs VIX 21 · style factors 2790.1%ile
20-day window (19 completed days + today); percentiles vs model history since 2020; '3m' tokens rank vs the trailing 63 trading days; definitions in Terms below. Implied prints (Cboe) are delayed ~15 min. as of 08:21 ET
Top 50 high-beta momentum names (eq-wt, since-2020 rank): +2.2%78%ile · rest of market -0.3%
HF de-risking score (since-2020 rank so far today): 23%ile today · 88%ile 5-day · HF pain index 11.4σ below peak (6th-deepest of 32 since 2020)
Trailing factor returns
Factor
Today
1d
5d
20d
60d
Style-Risk
Beta
+1.33%z+1.4
-1.60%
-3.92%
-13.46%
-9.33%
International
-0.12%z-0.4
+0.00%
-0.33%
-1.34%
-0.71%
Residual Volatility
-0.01%z-0.0
-1.12%
-1.41%
-1.76%
+0.57%
Style
Value
+0.18%z+0.8
+0.34%
+0.78%
+0.42%
+0.64%
Liquidity
+0.11%z+0.4
-0.89%
-0.87%
-1.19%
+1.46%
Size
-0.11%z-0.3
-0.31%
-1.24%
-1.57%
+1.55%
Dividend Yield
+0.05%z+0.3
-0.41%
-0.34%
-0.07%
+0.18%
Leverage
+0.05%z+0.3
-0.11%
+0.90%
+0.08%
-1.35%
Growth
+0.02%z+0.1
-0.26%
-0.31%
-1.00%
-0.67%
Profitability
-0.00%z-0.0
+0.58%
+0.86%
+1.34%
+1.64%
Style-Momentum
Medium-Term Momentum
-0.41%z-1.4
+0.23%
+0.04%
-1.23%
-1.73%
Short-Term Momentum
+0.15%z+0.5
+0.19%
+0.35%
+1.98%
+0.22%
Long-Term Momentum
+0.20%z+0.3
-2.00%
-2.59%
-4.41%
-1.11%
One-Day Momentum
-0.02%z-0.1
+0.67%
+1.38%
+1.50%
-1.95%
Style-Positioning
Short Interest
-0.10%z-0.6
+0.12%
+0.14%
+1.16%
-0.63%
Hedge-Fund Ownership
-0.05%z-0.4
+0.07%
-0.01%
-0.12%
-0.51%
Style-Flow
Short-Sale Activity
-0.04%z-0.3
+0.12%
+0.28%
+0.29%
+1.13%
Morning Activity
+0.01%z+0.1
-0.27%
-0.33%
-0.52%
-0.43%
Thematic
Bitcoin / Crypto
-0.33%z-1.1
-0.58%
-2.42%
-2.01%
-0.01%
Semiconductors
+0.61%z+1.0
-1.51%
-1.11%
-5.08%
-3.03%
Oil
-0.19%z-0.4
-2.21%
-2.68%
-2.87%
+1.19%
Gold
-0.10%z-0.3
+0.12%
-0.21%
-1.14%
-0.24%
China
+0.04%z+0.1
-0.38%
-0.65%
-1.11%
-1.45%
Treasury (Duration)
+0.00%z+0.0
+0.24%
+1.18%
+2.87%
-0.92%
5/20/60d windows include today's session; 1d is the previous session.
Terms
Factor z-score.Today's factor return divided by its daily-return standard deviation over ~1,600 trading days.
HF de-risking score.A FactorPulse measure of de-risking in factor returns: the average of four legs, each in its own daily-volatility units and counted only when it moves in the de-risking direction. They are the most-shorted names rising, 12-month momentum winners falling, names crowded in hedge-fund 13F filings falling net of their beta and momentum, and last week's relative moves continuing instead of reverting (counted only alongside another leg). A leg counts as firing at half its daily volatility or more, so a leg can show a small value without firing. Types: A, covering and selling together; B, selling only; C, covering only. Ranked against every session since January 2020. It reads factor returns only, never positions.
Stock-specific (idiosyncratic) return.The part of a stock's move not explained by the market, style or thematic (industry and theme) factors in the FactorPulse risk model.
Data compiled by FactorPulse AI; edited and verified by Jeff Klein. For informational purposes only. Does not constitute financial advice, an investment recommendation, or an offer to buy or sell any securities. Always consult a qualified financial professional before making investment decisions.