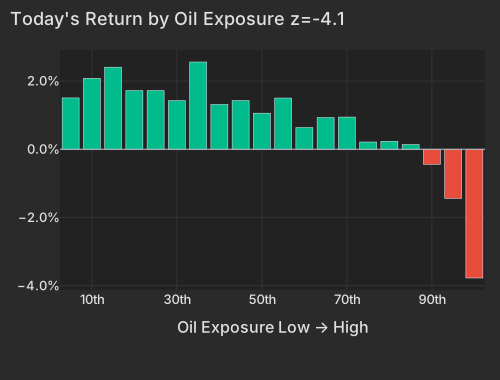
Hopes for a deal to end the US-Israeli war on Iran sent oil down 8% to about $96 a barrel by early Monday afternoon, after Iranian and Qatari officials held talks. No deal has been reached. Energy was last month's safe place and the past year's biggest winner, and it fell today. The energy fund XLE dropped 3% after gaining 64% over the past year, and oil giant ExxonMobil lost 4%. Cheaper oil eased inflation worries and pulled the 10-year Treasury yield down to about 4.9%.
The selling spread to the rest of the past year's winners, while the S&P 500 edged up 0.2%. Chipmaker Micron, one of the strongest performers of the past year, fell 4%. The semiconductor fund SMH slipped 1%, adding to a 17% drop over the past month. High-beta stocks rose before the open, then reversed lower, and Friday's biggest losers lagged again while the rest of the market rose. The crypto-miner fund WGMI fell 6% while bitcoin slipped 1%. The pattern fits hedge funds cutting their bets. FactorPulse's gauge of hedge-fund pain hit a new low for this episode, and Morgan Stanley's prime-brokerage desk has called October's pullback the largest in about a decade.
Profitable companies and stocks that had lagged for months rose. The homebuilder fund ITB jumped 5%. The regional-bank fund KRE rose 3%, and home-improvement retailer Home Depot gained 3%. Industrials rose 2% after a survey showed US factory activity picking up in October. Hotel chain Marriott rose 4% after beating third-quarter expectations and raising its full-year outlook. Oracle fell 7% after filing to sell $10 billion of stock and $10 billion of bonds at the same time, raising in one shot the full $20 billion it had flagged at its October 28 investor day to fund data-center spending through fiscal 2030. iPhone maker Apple, down 2% today, and software maker Palantir report after the close.
WTI crude is down 7.9% at $95.85 as of 1:26 PM ET CNBC. Talks between Iranian and Qatari officials on ending the US-Israeli war on Iran raised hopes that supply disruptions could ease Kitco. No deal has been reached, and Iran's negotiators have left the talks. The Oil factor is -1.94% at z=-4.1. ExxonMobil is down 3.6%, and almost all of that comes from its oil and style exposures rather than company news. Energy was October's safe place and the past year's biggest winner: XLE gained 11.5% over the prior 20 sessions and 63.6% over the past year.
| Factor | Return | Z-Score | 5d Z | 20d Z | 63d Z | Category | Direction |
|---|---|---|---|---|---|---|---|
| Oil | -1.94% | -4.1 | -2.2 | -1.3 | +0.7 | Thematic | Oil-exposed names lagging |
| Long-Term Momentum | -1.88% | -3.0 | -1.8 | -1.9 | -0.4 | Style-Momentum | 12-month winners lagging |
| Liquidity | -0.83% | -3.1 | -1.2 | -0.9 | +0.4 | Style | Highest-turnover names lagging |
| Profitability | +0.52% | +2.7 | +1.4 | +1.7 | +0.2 | Style | More profitable names leading |
| Semiconductors | -1.54% | -2.5 | -1.0 | -2.1 | -1.0 | Thematic | Chip stocks lagging |
| One-Day Momentum | +0.66% | +2.4 | +2.2 | +0.9 | -1.2 | Style-Momentum | Friday's losers still losing |
| Short Interest | +0.22% | +1.3 | +0.7 | +1.1 | -0.4 | Style-Positioning | Most-shorted names leading |
| Beta | -0.79% | -0.8 | -1.0 | -3.2 | -1.4 | Style-Risk | High-beta names lagging |
| Bucket | Avg Ret Pct |
|---|---|
| 1 | 1.51 |
| 2 | 2.08 |
| 3 | 2.41 |
| 4 | 1.72 |
| 5 | 1.72 |
| 6 | 1.43 |
| 7 | 2.56 |
| 8 | 1.32 |
| 9 | 1.43 |
| 10 | 1.06 |
| 11 | 1.50 |
| 12 | 0.64 |
| 13 | 0.93 |
| 14 | 0.94 |
| 15 | 0.21 |
| 16 | 0.23 |
| 17 | 0.14 |
| 18 | -0.44 |
| 19 | -1.44 |
| 20 | -3.78 |
Cheaper oil is pulling long-term yields down as inflation worries ease Bloomberg. The 10-year Treasury yield is at 4.89%, down 4.3 basis points CNBC. The 2-year yield is almost unchanged at 4.59%, so the curve has flattened from the long end CNBC. Over the 20 sessions through Friday, the 10-year yield fell about 35 basis points while chip stocks (SMH) fell 17.1%. Chips falling alongside yields suggests the bond market is pricing in slower growth.

| Sym | Fund | Group | Today Pct | Past Year Pct | Tlt Sensitivity |
|---|---|---|---|---|---|
| ITB | Home construction | moved most with Treasuries | 4.58 | -6.60 | 1.51 |
| XHB | Homebuilders | moved most with Treasuries | 3.57 | -3.00 | 1.27 |
| XLU | Utilities | moved most with Treasuries | 0.61 | -0.90 | 0.63 |
| XBI | Biotech | moved most with Treasuries | -2.13 | 41.20 | 0.56 |
| IYR | US real estate | moved most with Treasuries | 0.93 | 8.60 | 0.53 |
| VNQ | REITs | moved most with Treasuries | 0.90 | 10.10 | 0.53 |
| XLRE | Real estate sector | moved most with Treasuries | 0.80 | 9.90 | 0.52 |
| LQD | Corporate bonds | moved most with Treasuries | 0.24 | -2.70 | 0.49 |
| XLP | Staples | moved most with Treasuries | 1.44 | 20.00 | 0.49 |
| XLV | Health care | moved most with Treasuries | -0.15 | 30.50 | 0.48 |
| IGV | Software | moved most against Treasuries | -0.11 | -9.50 | -0.20 |
| MTUM | Momentum stocks | moved most against Treasuries | -1.84 | 10.80 | -0.27 |
| AIPO | AI & power | moved most against Treasuries | -0.62 | -4.00 | -0.29 |
| XLK | Technology | moved most against Treasuries | -1.22 | 18.60 | -0.34 |
| SMH | Chips | moved most against Treasuries | -0.74 | 42.20 | -0.43 |
| BITO | Bitcoin futures | moved most against Treasuries | 0.24 | -32.80 | -0.52 |
| XLE | Energy | moved most against Treasuries | -3.31 | 63.60 | -0.57 |
| WGMI | Bitcoin miners | moved most against Treasuries | -5.47 | -51.60 | -0.65 |
| XOP | Oil producers | moved most against Treasuries | -4.05 | 64.50 | -0.89 |
| USO | Crude oil | moved most against Treasuries | -6.85 | 135.10 | -1.60 |
Earnings reactions so far todayReporters worth over $100 billion, or moving more than 10% with a value above $5 billion
| Company | Move | Stock-specific | Market cap | Revenue YoY | Margin YoY | What drove it |
|---|---|---|---|---|---|---|
| Krystal Biotech KRYS | -14.2% | -15.1% | $10B | — | — | Clinical readouts pushed into 2027 despite beat |
| Marriott International MAR | +3.8% | +2.7% | $104B | +8% | +0.8 pts adj. operating | Q3 beat, raised full-year outlook Bloomberg |
| Idexx Laboratories IDXX | +20.2% | +18.0% | $43B | +10% | +1.0 pts operating | Q3 beat, raised full-year guidance Morningstar |
Stock-specific: the part of a stock's move not explained by the market, style or thematic (industry and theme) factors in the FactorPulse risk model.
Revenue and margin from the company's earnings release, year over year; margin change in percentage points; — where the release is not parsed or the figures failed checks.
Of the 500 largest companies, 286 have reported (60% of market cap), on day 23 of the season.
How earnings reactions split, day 23 of the seasonThe 500 largest US companies with a confirmed earnings reaction so far (271), vs the same day in the past eight seasons and in four-season stretches back to mid-2020

| Season | ≤ −5σ | −5 to −2σ | −2 to 0σ | 0 to 2σ | 2 to 5σ | ≥ 5σ |
|---|---|---|---|---|---|---|
| This season | 9% | 17% | 27% | 24% | 19% | 4% |
| Past 8 seasons | 16% | 19% | 16% | 16% | 18% | 15% |
| Q2 2026 | 16% | 20% | 16% | 13% | 20% | 15% |
| Q1 2026 | 12% | 20% | 13% | 19% | 19% | 17% |
| Q4 2025 | 17% | 17% | 19% | 14% | 18% | 15% |
| Q3 2025 | 11% | 19% | 19% | 18% | 16% | 17% |
| Q2 2025 | 15% | 21% | 16% | 16% | 15% | 17% |
| Q1 2025 | 20% | 14% | 16% | 20% | 19% | 9% |
| Q4 2024 | 19% | 16% | 17% | 19% | 16% | 13% |
| Q3 2024 | 18% | 19% | 16% | 12% | 18% | 17% |
| Q3 '23–Q2 '24 | 16% | 18% | 16% | 15% | 19% | 17% |
| Q3 '22–Q2 '23 | 12% | 19% | 19% | 18% | 21% | 11% |
| Q3 '21–Q2 '22 | 13% | 19% | 14% | 18% | 23% | 12% |
| Q3 '20–Q2 '21 | 7% | 20% | 29% | 22% | 17% | 4% |
σ: a stock's earnings-day stock-specific move divided by its typical daily stock-specific move over the past year. Each bar is cut at the same business day of the season; companies weighted by the square root of market cap.
12-month momentum (Long-Term Momentum in the table) is -1.88% at z=-3.0. That figure is measured after the oil and chip-stock effects are taken out, so this is a separate sell-off, not energy or chips under another name. The factor has lost 5.30% over 20 sessions. Micron, one of the market's strongest 12-month winners, is down 3.9%, and its factor exposures account for more than the whole decline. The Semiconductors factor is -1.54% at z=-2.5, bringing its 20-session loss to 5.74%.
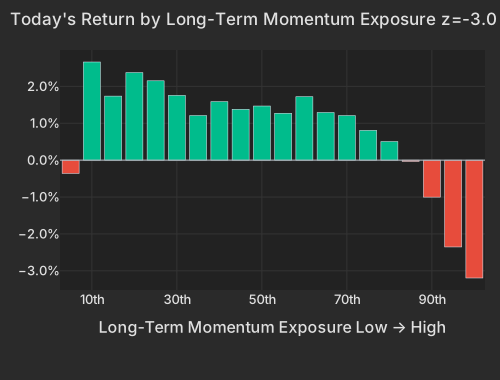
| Bucket | Avg Ret Pct |
|---|---|
| 1 | -0.36 |
| 2 | 2.66 |
| 3 | 1.74 |
| 4 | 2.37 |
| 5 | 2.15 |
| 6 | 1.76 |
| 7 | 1.21 |
| 8 | 1.59 |
| 9 | 1.38 |
| 10 | 1.47 |
| 11 | 1.27 |
| 12 | 1.72 |
| 13 | 1.29 |
| 14 | 1.21 |
| 15 | 0.81 |
| 16 | 0.50 |
| 17 | -0.03 |
| 18 | -1.00 |
| 19 | -2.35 |
| 20 | -3.19 |
The pre-market bounce in high-beta stocks has reversed. Beta was up 0.94% at 6:31 AM and is now down 0.79%, leaving it 13.84% lower over 20 sessions. Friday's losers are still falling: yesterday's winners and losers (One-Day Momentum) is +0.66% at z=+2.4, and the same pattern has held over five sessions at z=+2.2. The stocks that fell hardest on Friday are mostly the high-beta names, so the Beta reversal and the one-day continuation are the same trade. The top 50 high-beta momentum names are down 5.8% as of 2:40 PM ET, the 55th-worst day of 1,717 since 2020, against a 1.4% gain for the rest of the market.
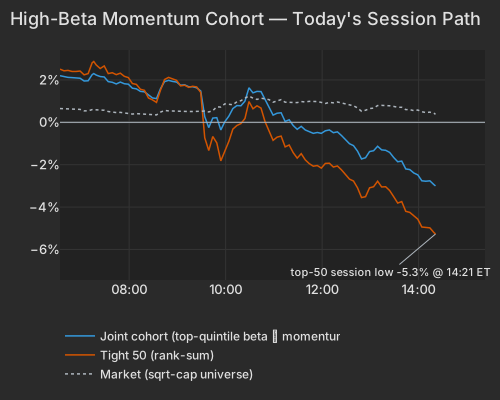
| Series | Ret Pct |
|---|---|
| joint | -3.51 |
| tight50 | -5.84 |
| market | 0.18 |
| rest | 1.43 |
Liquidity is -0.83% at z=-3.1: the highest-turnover, most heavily optioned stocks are trailing the lowest-turnover ones. Crypto miners such as MARA and AI data-center stocks make up much of that group. WGMI is down 5.9%, while bitcoin is down only 1.1% at $76,918 as of 1:36 PM ET CNBC.
Profitability is +0.52% at z=+2.7, meaning more profitable companies are beating less profitable ones. Home Depot is up 3.2%, carried by its factor exposures rather than its own news: it is a 12-month laggard with strong ties to profitability and interest rates. ITB is up 4.6% even though September construction spending data showed residential outlays down 5.5% CENSUS. The ISM manufacturing index rose to 55.5 in October Bloomberg. Industrials are up 2.0% and materials 1.9%.
| ETF | Theme | Today | 1d Ago | 5d Ago | 20d Ago | 63d Ago |
|---|---|---|---|---|---|---|
| ITB | Homebuilders | +4.6% | +0.7% | +2.4% | +7.0% | -3.6% |
| XLY | Consumer discretionary | +2.8% | -0.7% | +2.0% | +4.9% | -2.2% |
| KRE | Regional banks | +2.7% | -1.2% | -0.6% | +1.7% | -6.0% |
| XLP | Consumer staples | +1.5% | +1.4% | +1.3% | +11.0% | +6.1% |
| SPY | S&P 500 | +0.2% | -1.8% | -0.6% | -1.8% | -0.01% |
| SMH | Semiconductors | -1.1% | -7.0% | -0.9% | -17.1% | -4.2% |
| MTUM | Momentum | -2.0% | -4.8% | -1.9% | -12.0% | -5.7% |
| XLE | Energy | -3.3% | +1.9% | +1.0% | +11.5% | +19.8% |
| WGMI | Crypto miners | -5.9% | -8.6% | -2.2% | -37.3% | -48.1% |
| USO | Oil | -6.7% | +0.4% | -0.4% | +14.6% | +38.3% |
The table divides along the 63-day column. Funds that had rallied over three months, in oil and energy, are falling. Funds that lagged over three months, such as homebuilders and regional banks, are rising. Style factors explained 35% of stock-level variance today, against a 24% one-year average, so stocks moved more on their factor exposures than on the index.
Our HF de-risking score's 20-day reading is in the 98th percentile since 2020 so far today, ranked against full-day history. Over that window, 12-month winners fell, the most-shorted names rose and last week's moves continued instead of reversing. Today the most-shorted names are again outperforming, with Short Interest +0.22% at z=+1.3. The factor pattern is consistent with a de-gross. The hedge-fund pain index is 11.1 daily standard deviations below its October 6 peak, the 6th-deepest of 32 such events since 2020. Three of its eight legs have confirmed a turn: beta, the VIX and short-sale P&L. The 12-month momentum and short-interest legs added to the pain today. Morgan Stanley's prime brokerage desk has called October's hedge-fund de-grossing the largest in about a decade, with net leverage at a one-year low as of October 30.
Background: our research note Factor Fingerprints of Hedge Fund Deleveraging Events compares October with 31 hedge-fund deleveraging events since 2020.

| Date | Sigma Vs Peak |
|---|---|
| 20260924 | -1.05 |
| 20260925 | -0.40 |
| 20260928 | -0.97 |
| 20260929 | -0.52 |
| 20260930 | -0.98 |
| 20261001 | -0.37 |
| 20261002 | -0.03 |
| 20261005 | -0.47 |
| 20261006 | 0.00 |
| 20261007 | -0.18 |
| 20261008 | -0.86 |
| 20261009 | -0.62 |
| 20261012 | -1.47 |
| 20261013 | -1.46 |
| 20261014 | -2.82 |
| 20261015 | -4.07 |
| 20261016 | -4.86 |
| 20261019 | -4.55 |
| 20261020 | -5.45 |
| 20261021 | -4.86 |
| 20261022 | -9.42 |
| 20261023 | -9.29 |
| 20261026 | -8.57 |
| 20261027 | -7.57 |
| 20261028 | -6.98 |
| 20261029 | -7.52 |
| 20261030 | -9.36 |
| 20261102 | -11.06 |
Oracle is down 7.0% after filing to sell $10 billion of common stock alongside a concurrent $10 billion senior notes offering SEC. The notes come in six series, from floating-rate paper due 2029 to fixed-rate bonds due 2046, with coupons not yet set SEC. The $20 billion is the full cap Oracle set at its October 28 investor day to fund data-center spending through fiscal 2030, and the company now plans to raise all of it at once.
Apple, down 2.1% today, and Palantir are due to report after the close.
Variance decomposition: live intraday — 20261102 session, bracketed against its trailing-year range. Factor returns are trailing through last close. Total cross-sectional dispersion: 81%ile of the past year.
Variance mix — % of total, today vs 1d ago vs 1-yr avg
market 53%ile style 87%ile thematic 97.2%ile idiosyncratic 18%ile
Variance explained — today vs. factor's trailing-year range
Marker = the factor's share of today's total variance, placed in its own trailing-year range (box 25–75%ile, ticks 90%ile and max). Amber marker = unusually load-bearing today (≥90%ile of its own year). Factor name green = up today / red = down.
Correlation & dispersion — realized vs implied
Pairwise realized correlation (20d): 8.38% 4.7%ile since 2020 · 35%ile 3m
Top-500 pairwise: 8.79% 5.5%ile since 2020 · 21%ile 3m · implied (Cboe COR1M): 13.10 8.8%ile since 2006 (gap -4.3pp)
Realized 20d vol (ann. pts): all stocks 45 vs VIXEQ 43 · index 12 vs VIX 20 · style factors 26 89%ile
20-day window (19 completed days + today); percentiles vs model history since 2020; '3m' tokens rank vs the trailing 63 trading days; definitions in Terms below. Implied prints (Cboe) are delayed ~15 min. as of 13:21 ET
Top 50 high-beta momentum names (eq-wt, since-2020 rank, 14:40 ET): -5.8% 3.1%ile · rest of market +1.4%
HF de-risking score (since-2020 rank so far today): 93.4%ile today · 80%ile 5-day · HF pain index 11.1σ below peak (6th-deepest of 32 since 2020), 0% won back · covering plus selling
| Factor | Today | 1d | 5d | 20d | 60d |
|---|---|---|---|---|---|
| Style-Risk | |||||
| Residual Volatility | -0.85% z-1.7 | -0.07% | -1.15% | -1.82% | +1.25% |
| Beta | -0.79% z-0.8 | -3.49% | -2.16% | -13.84% | -11.00% |
| International | +0.02% z+0.1 | -0.01% | -0.37% | -1.30% | -0.43% |
| Style | |||||
| Liquidity | -0.83% z-3.1 | -0.11% | -0.70% | -1.07% | +1.20% |
| Profitability | +0.52% z+2.7 | -0.05% | +0.59% | +1.41% | +1.07% |
| Dividend Yield | -0.42% z-2.4 | -0.10% | -0.25% | -0.09% | -0.06% |
| Leverage | -0.22% z-1.3 | +0.20% | +1.01% | +0.24% | -2.01% |
| Value | +0.28% z+1.2 | +0.21% | +0.43% | +0.28% | +0.46% |
| Size | -0.22% z-0.6 | -0.04% | -1.37% | -1.21% | +2.08% |
| Growth | -0.08% z-0.4 | -0.01% | -0.34% | -0.59% | -0.21% |
| Style-Momentum | |||||
| Long-Term Momentum | -1.88% z-3.0 | -0.55% | -2.50% | -5.30% | -0.91% |
| One-Day Momentum | +0.66% z+2.4 | +0.52% | +1.34% | +1.10% | -1.97% |
| Medium-Term Momentum | +0.44% z+1.5 | +0.49% | -0.01% | -0.74% | -0.64% |
| Short-Term Momentum | +0.05% z+0.2 | -0.29% | -0.20% | +2.17% | -0.02% |
| Style-Positioning | |||||
| Short Interest | +0.22% z+1.3 | +0.25% | +0.26% | +0.79% | -0.28% |
| Hedge-Fund Ownership | +0.08% z+0.7 | -0.09% | -0.01% | -0.18% | -0.50% |
| Style-Flow | |||||
| Morning Activity | -0.21% z-1.7 | +0.19% | -0.19% | -0.43% | +0.03% |
| Short-Sale Activity | +0.08% z+0.7 | +0.04% | +0.16% | +0.34% | +1.04% |
| Thematic | |||||
| Oil | -1.94% z-4.1 | +0.28% | -2.38% | -2.66% | +2.83% |
| Semiconductors | -1.54% z-2.5 | -0.74% | -1.32% | -5.74% | -3.86% |
| Bitcoin / Crypto | -0.31% z-1.0 | -0.38% | -2.26% | -1.89% | +0.71% |
| Treasury (Duration) | +0.24% z+0.7 | +0.28% | +1.19% | +2.56% | -0.83% |
| China | -0.26% z-0.6 | -0.13% | -0.50% | -1.39% | -1.37% |
| Gold | +0.16% z+0.5 | -0.16% | +0.23% | -1.25% | +0.52% |
5/20/60d windows include today's session; 1d is the previous session.
Factor z-score. Today's factor return divided by its daily-return standard deviation over ~1,600 trading days.
High-beta momentum cohort. US names above $2B market cap in the top quintile of both raw beta and 12-month momentum; membership frozen at each month's first business day. “Top 50” = the 50 strongest by combined rank.
HF de-risking score. A FactorPulse measure of de-risking in factor returns: the average of four legs, each in its own daily-volatility units and counted only when it moves in the de-risking direction. They are the most-shorted names rising, 12-month momentum winners falling, names crowded in hedge-fund 13F filings falling net of their beta and momentum, and last week's relative moves continuing instead of reverting (counted only alongside another leg). A leg counts as firing at half its daily volatility or more, so a leg can show a small value without firing. Types: A, covering and selling together; B, selling only; C, covering only. Ranked against every session since January 2020. It reads factor returns only, never positions.
Stock-specific (idiosyncratic) return. The part of a stock's move not explained by the market, style or thematic (industry and theme) factors in the FactorPulse risk model.
Data compiled by FactorPulse AI; edited and verified by Jeff Klein. For informational purposes only. Does not constitute financial advice, an investment recommendation, or an offer to buy or sell any securities. Always consult a qualified financial professional before making investment decisions.
For more on factor construction methodology, see www.factorpulse.com/glossary.
← FactorPulse · All Digests · Follow us on X
FactorPulse is free during launch · Sign up free (no credit card)