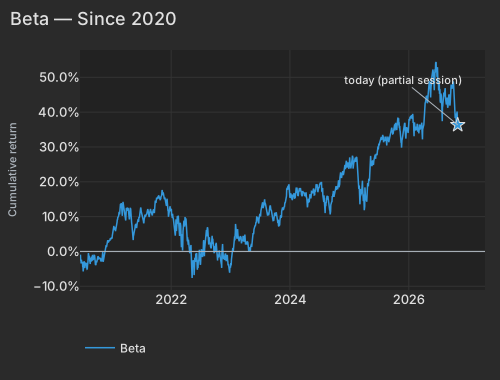
Renewed hopes of a US-Iran deal knocked crude oil down 4% to just under $100 a barrel before Monday's open, and the stocks most sensitive to market moves led an early rebound. They won back about a quarter of Friday's loss, when they trailed the market's steadiest names by about 3.5%. Over the past month they fell about 13% behind, one of their worst stretches since 2020. The 50 stocks that pair the most market sensitivity with the biggest gains over the past year were up nearly 3% in pre-market trading, against about 0.2% for everything else. October's biggest losers led the bounce: the South Korea fund EWY rose almost 4%, and the memory-chip fund DRAM and the crypto-miner fund WGMI each gained about 3%. Energy moved the other way. The oil fund USO fell 3%, and the typical energy stock slipped about 1%. Cheaper crude also gave Indian government bonds their biggest gain in six months. Consumer staples and healthcare, last month's safe havens, were flat.
Memory-chip maker SK Hynix rose 4% in Seoul, adding about $43 billion in market value, after OpenAI chief executive Sam Altman made a surprise visit to the city. He met with leaders of SK Hynix and Samsung about supplies of the high-bandwidth memory chips that power AI systems. Only about half of the gain was specific to SK Hynix. The rest tracked the broader rally, and the same was true of the wider chip sector. The semiconductor fund SMH rose about 1.4% before the open, after a 17% drop over the past month. That slide came as the 10-year Treasury yield fell about a third of a percentage point, a pairing that suggests investors are bracing for slower growth.
The bounce follows a month of heavy hedge-fund retreat. Morgan Stanley's derivatives desk said late last week that global hedge funds had cut more than 8% of their market bets since June, the biggest such pullback since at least 2017. FactorPulse's own gauge of hedge-fund selling, measured over the month through Friday, ranked in the top 3% of readings since 2020. Monday morning showed no sign of a scramble to cover bearish bets: the most heavily shorted stocks were lagging. The VIX, Wall Street's fear gauge, stood near 19, close to the top of its range for the past month. In earnings, hotel chain Marriott rose 3% after beating forecasts and raising its full-year outlook on strong US demand. Reactions to results have been smaller than usual this season in both directions: about 23% of large companies have posted solid gains on their results so far, against about 33% at this stage in recent seasons. Apple reports after Monday's close, the day before the US midterm elections.
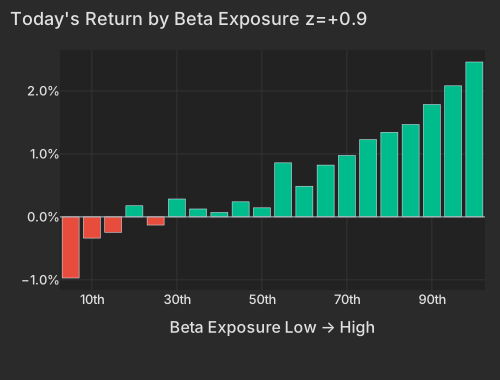
Beta is up 0.92% at z=+0.9 in pre-market trading, with more market-sensitive names outperforming less sensitive ones. Over 20 sessions including today, the factor is down 12.13% at z=-2.8. So today's move pushes against one of the steepest 20-day declines since 2020 rather than adding to it.
| Date | Cumret Pct |
|---|---|
| 2020-06-19 | -1.08 |
| 2020-07-14 | -4.44 |
| 2020-08-05 | -4.03 |
| 2020-08-27 | -2.23 |
| 2020-09-21 | -2.98 |
| 2020-10-13 | -2.13 |
| 2020-11-04 | -1.47 |
| 2020-11-27 | 1.80 |
| 2020-12-21 | 3.16 |
| 2021-01-14 | 7.34 |
| 2021-02-08 | 9.73 |
| 2021-03-03 | 13.31 |
| 2021-03-25 | 9.93 |
| 2021-04-19 | 9.83 |
| 2021-05-11 | 5.51 |
| 2021-06-03 | 6.70 |
| 2021-06-25 | 11.06 |
| 2021-07-20 | 9.12 |
| 2021-08-11 | 12.17 |
| 2021-09-02 | 11.10 |
| 2021-09-27 | 14.59 |
| 2021-10-19 | 15.78 |
| 2021-11-10 | 16.20 |
| 2021-12-03 | 13.06 |
| 2021-12-28 | 12.13 |
| 2022-01-20 | 7.72 |
| 2022-02-11 | 7.99 |
| 2022-03-08 | 2.51 |
| 2022-03-30 | 8.42 |
| 2022-04-22 | 0.05 |
| 2022-05-16 | -4.48 |
| 2022-06-08 | -0.44 |
| 2022-07-01 | -3.67 |
| 2022-07-26 | -1.37 |
| 2022-08-17 | 4.97 |
| 2022-09-09 | 3.95 |
| 2022-10-03 | 0.24 |
| 2022-10-25 | 0.29 |
| 2022-11-16 | 0.38 |
| 2022-12-09 | -2.08 |
| 2023-01-04 | -3.33 |
| 2023-01-27 | 4.33 |
| 2023-02-21 | 3.14 |
| 2023-03-15 | 3.19 |
| 2023-04-06 | 2.16 |
| 2023-05-01 | 0.76 |
| 2023-05-23 | 5.16 |
| 2023-06-15 | 9.80 |
| 2023-07-11 | 12.36 |
| 2023-08-02 | 13.69 |
| 2023-08-24 | 10.43 |
| 2023-09-18 | 10.54 |
| 2023-10-10 | 11.11 |
| 2023-11-01 | 7.62 |
| 2023-11-24 | 12.04 |
| 2023-12-18 | 17.78 |
| 2024-01-11 | 16.17 |
| 2024-02-05 | 15.32 |
| 2024-02-28 | 17.07 |
| 2024-03-21 | 17.35 |
| 2024-04-15 | 15.39 |
| 2024-05-07 | 15.81 |
| 2024-05-30 | 17.32 |
| 2024-06-24 | 17.01 |
| 2024-07-17 | 17.43 |
| 2024-08-08 | 13.01 |
| 2024-08-30 | 14.42 |
| 2024-09-24 | 16.41 |
| 2024-10-16 | 18.00 |
| 2024-11-07 | 21.86 |
| 2024-12-02 | 23.07 |
| 2024-12-24 | 25.28 |
| 2025-01-21 | 26.62 |
| 2025-02-12 | 25.99 |
| 2025-03-07 | 16.41 |
| 2025-03-31 | 14.46 |
| 2025-04-23 | 16.79 |
| 2025-05-15 | 26.07 |
| 2025-06-09 | 27.51 |
| 2025-07-02 | 30.57 |
| 2025-07-25 | 32.67 |
| 2025-08-18 | 32.71 |
| 2025-09-10 | 32.82 |
| 2025-10-02 | 35.27 |
| 2025-10-24 | 37.08 |
| 2025-11-17 | 31.52 |
| 2025-12-10 | 36.90 |
| 2026-01-05 | 37.02 |
| 2026-01-28 | 39.50 |
| 2026-02-20 | 35.63 |
| 2026-03-16 | 35.74 |
| 2026-04-08 | 38.73 |
| 2026-04-30 | 43.50 |
| 2026-05-22 | 47.75 |
| 2026-06-16 | 51.35 |
| 2026-07-10 | 47.81 |
| 2026-08-03 | 43.30 |
| 2026-08-25 | 43.32 |
| 2026-09-17 | 44.20 |
| 2026-10-09 | 46.21 |
| 2026-11-02 | 36.34 |
The stocks bouncing hardest are the ones that fell most. 20-day momentum (Medium-Term Momentum in the table) is at -0.11% (z=-0.4), and One-Day Momentum is at -0.13% (z=-0.5). Last month's losers and Friday's losers are both leading. Across the universe, the exposures to both factors run opposite to Beta, so all three moves are one trade. The top 50 high-beta momentum names are up 2.7%, against 0.2% for the rest of the market.
| Factor | Return | Z-Score | 5d Z | 20d Z | 63d Z | Category | Direction |
|---|---|---|---|---|---|---|---|
| Beta | +0.92% | +0.9 | -0.2 | -2.8 | -1.2 | Style-Risk | High-beta names leading |
| Oil | -0.25% | -0.5 | -0.6 | -0.5 | +1.2 | Thematic | Oil-exposed names lagging |
| One-Day Momentum | -0.13% | -0.5 | +0.9 | +0.2 | -1.5 | Style-Momentum | Friday's losers bouncing |
| Medium-Term Momentum | -0.11% | -0.4 | -0.9 | -1.0 | -0.5 | Style-Momentum | Past month's losers bouncing |
| Short Interest | -0.08% | -0.5 | -0.1 | +0.7 | -0.7 | Style-Positioning | Most-shorted names lagging |
| Hedge-Fund Ownership | -0.04% | -0.4 | -0.5 | -0.6 | -0.7 | Style-Positioning | Hedge-fund-owned names slightly lagging |
| Semiconductors | +0.13% | +0.2 | +0.3 | -1.5 | -0.6 | Thematic | Flat |
| Bucket | Avg Ret Pct |
|---|---|
| 1 | -0.97 |
| 2 | -0.34 |
| 3 | -0.24 |
| 4 | 0.18 |
| 5 | -0.13 |
| 6 | 0.28 |
| 7 | 0.13 |
| 8 | 0.07 |
| 9 | 0.24 |
| 10 | 0.14 |
| 11 | 0.86 |
| 12 | 0.49 |
| 13 | 0.82 |
| 14 | 0.97 |
| 15 | 1.23 |
| 16 | 1.34 |
| 17 | 1.47 |
| 18 | 1.79 |
| 19 | 2.08 |
| 20 | 2.46 |
The rebound is young. Including today, Beta is down only 0.44% over five sessions. That is because a rebound early last week was wiped out by Friday's selloff.
| ETF | Theme | Today | 1d Ago | 5d Ago | 20d Ago | 63d Ago |
|---|---|---|---|---|---|---|
| EWY | South Korea | +3.6% | -5.5% | +1.1% | -20.3% | -4.6% |
| DRAM | Memory chips | +3.2% | -7.2% | +2.0% | -22.3% | -6.1% |
| WGMI | Crypto miners | +3.2% | -8.6% | -2.2% | -37.3% | -48.1% |
| URA | Uranium | +1.8% | -5.6% | -1.1% | -15.2% | -17.4% |
| SMH | Semiconductors | +1.4% | -7.0% | -0.9% | -17.1% | -4.2% |
| XLV | Healthcare | +0.04% | +0.5% | +3.1% | +11.3% | +14.4% |
| XLP | Consumer staples | -0.01% | +1.4% | +1.3% | +11.0% | +6.1% |
| XLE | Energy | -1.1% | +1.9% | +1.0% | +11.5% | +19.8% |
| XOP | Oil & gas producers | -1.5% | +2.1% | +1.0% | +10.2% | +17.4% |
| USO | Oil | -3.3% | +0.4% | -0.4% | +14.6% | +38.3% |
Korea, memory chips and crypto miners, three of October's heaviest losers, top the ETF table. Staples and healthcare are flat, so last month's havens are not being sold to pay for the bounce. XLP's 20-day gain through Friday ranks in the 99.4th percentile since late 2018.
How earnings reactions split, day 23 of the seasonThe 500 largest US companies with a confirmed earnings reaction so far (257), vs the same day in the past eight seasons and in four-season stretches back to mid-2020

| Season | ≤ −5σ | −5 to −2σ | −2 to 0σ | 0 to 2σ | 2 to 5σ | ≥ 5σ |
|---|---|---|---|---|---|---|
| This season | 9% | 16% | 27% | 25% | 19% | 4% |
| Past 8 seasons | 16% | 19% | 16% | 16% | 18% | 15% |
| Q2 2026 | 16% | 20% | 16% | 13% | 20% | 15% |
| Q1 2026 | 12% | 20% | 13% | 19% | 19% | 17% |
| Q4 2025 | 17% | 17% | 19% | 14% | 18% | 15% |
| Q3 2025 | 11% | 19% | 19% | 18% | 16% | 17% |
| Q2 2025 | 15% | 21% | 16% | 16% | 15% | 17% |
| Q1 2025 | 20% | 14% | 16% | 20% | 19% | 9% |
| Q4 2024 | 19% | 16% | 17% | 19% | 16% | 13% |
| Q3 2024 | 18% | 19% | 16% | 12% | 18% | 17% |
| Q3 '23–Q2 '24 | 16% | 18% | 16% | 15% | 19% | 17% |
| Q3 '22–Q2 '23 | 12% | 19% | 19% | 18% | 21% | 11% |
| Q3 '21–Q2 '22 | 13% | 19% | 14% | 18% | 23% | 12% |
| Q3 '20–Q2 '21 | 7% | 20% | 29% | 22% | 17% | 4% |
σ: a stock's earnings-day stock-specific move divided by its typical daily stock-specific move over the past year. Each bar is cut at the same business day of the season; companies weighted by the square root of market cap.
Of the 500 largest companies, 279 have reported (59% of market cap), on day 23 of the season.
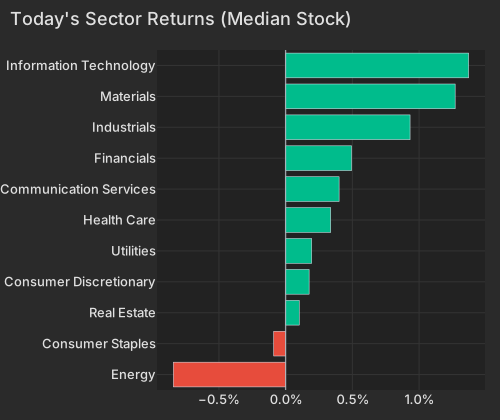
WTI crude is at $99.91 as of 7:18 AM ET, down 4.0% on the day CNBC. The Economic Times linked the drop to renewed hopes of a US-Iran deal. Cheaper crude also lifted Indian government bonds to their biggest gain in six months Bloomberg. In US stocks, the Oil factor is at -0.25% (z=-0.5) and the median energy stock is down 0.8%.
| Sector | Median Ret Pct |
|---|---|
| Energy | -0.84 |
| Consumer Staples | -0.09 |
| Real Estate | 0.10 |
| Consumer Discretionary | 0.18 |
| Utilities | 0.19 |
| Health Care | 0.34 |
| Communication Services | 0.40 |
| Financials | 0.49 |
| Industrials | 0.93 |
| Materials | 1.27 |
| Information Technology | 1.37 |
Treasuries are mixed. The 10-year yield is at 4.92%, down 1.4 basis points, while the 2-year is up 1.3 basis points at 4.59% CNBC. Over the 20 sessions through Friday, SMH fell 17.1% while the 10-year yield fell about 35 basis points. Chip stocks are falling alongside yields, which reads as the market pricing slower growth. That link is tighter than in 97% of 20-session windows since 2019.
Morgan Stanley's derivatives desk said late last week that active de-grossing by global hedge funds had passed 8% of gross exposure since June. The desk called it the biggest such cut since at least 2017. Our HF de-risking score points the same way. Through Friday's close, its 20-day reading ranked in the 97th percentile since 2020. Three legs fired: 12-month momentum winners fell, names crowded in hedge-fund 13F filings fell, and last week's moves continued instead of reverting. The fourth leg, the most-shorted names rising, stayed quiet.
Background: our research note Factor Fingerprints of Hedge Fund Deleveraging Events compares October with 31 hedge-fund deleveraging events since 2020.
The hedge-fund pain index is 9.4 daily standard deviations below its October 6 peak as of Friday's close. That makes this the 7th-deepest of 32 such events since 2020. So far in pre-market trading, no leg of the score is firing. Today's spreads show no short covering either. Short Interest is at -0.08% (z=-0.5), meaning the most-shorted names are trailing. Hedge-Fund Ownership is at -0.04% (z=-0.4) and flat on a raw basis. The VIX is at 19.2, near the top of its 20-session range. Implied single-stock volatility (Cboe VIXEQ) closed Friday at 42.3, also at the top of its range.
SK Hynix is up 4.4%, adding $43.0B of market value. OpenAI CEO Sam Altman made a surprise visit to Seoul and held talks with Samsung and SK Hynix leaders about supplies of high-bandwidth memory chips CNBC. About 2.0% of the gain is specific to the stock. The rest comes from the market and the stock's beta exposure. EWY's 20-day loss through Friday ranks in the 0.9th percentile since late 2018.
For the rest of the chip sector, the move is beta. The Semiconductors factor is at +0.13% (z=+0.2) and still down 4.06% over 20 days. AMD is up 1.9%, more than all of it explained by its factor exposures. So far, nothing in the factor data shows buyers picking out chip stocks on their own.
IDEXX is up 5.2%. It reported third-quarter EPS of $4.01 and raised its 2026 EPS outlook to $14.96–$15.16 Morningstar. Marriott is up 3.3% after a third-quarter beat and a higher full-year outlook, helped by US demand Bloomberg. Check Point is down 5.5% after its report. Apple and Palantir are due to report after today's close.
Variance decomposition: live intraday — 20261102 session, bracketed against its trailing-year range. Factor returns are trailing through last close. Total cross-sectional dispersion: 2.0%ile of the past year.
Variance mix — % of total, today vs 1d ago vs 1-yr avg
market 83%ile style 90.4%ile thematic 6.0%ile idiosyncratic 7.6%ile
Variance explained — today vs. factor's trailing-year range
Marker = the factor's share of today's total variance, placed in its own trailing-year range (box 25–75%ile, ticks 90%ile and max). Amber marker = unusually load-bearing today (≥90%ile of its own year). Factor name green = up today / red = down.
Correlation & dispersion — realized vs implied
Pairwise realized correlation (20d): 9.10% 7.2%ile since 2020 · 73%ile 3m
Top-500 pairwise: 10.69% 10%ile since 2020 · 52%ile 3m · implied (Cboe COR1M): 13.51 9.6%ile since 2006 (gap -2.8pp)
Realized 20d vol (ann. pts): all stocks 44 vs VIXEQ 42 · index 12 vs VIX 19 · style factors 26 88%ile
20-day window (19 completed days + today); percentiles vs model history since 2020; '3m' tokens rank vs the trailing 63 trading days; definitions in Terms below. Implied prints (Cboe) are delayed ~15 min. as of 07:21 ET
Top 50 high-beta momentum names (eq-wt, since-2020 rank): +2.7% 84%ile · rest of market +0.2%
HF de-risking score (since-2020 rank so far today): 27%ile today · 50%ile 5-day · HF pain index 9.4σ below peak (7th-deepest of 32 since 2020)
| Factor | Today | 1d | 5d | 20d | 60d |
|---|---|---|---|---|---|
| Style-Risk | |||||
| Beta | +0.92% z+0.9 | -3.49% | -0.44% | -12.13% | -9.28% |
| International | +0.02% z+0.1 | -0.01% | -0.37% | -1.30% | -0.43% |
| Residual Volatility | +0.02% z+0.0 | -0.07% | -0.29% | -0.96% | +2.11% |
| Style | |||||
| Liquidity | -0.08% z-0.3 | -0.11% | +0.04% | -0.33% | +1.94% |
| Profitability | +0.05% z+0.3 | -0.05% | +0.12% | +0.94% | +0.60% |
| Value | -0.05% z-0.2 | +0.21% | +0.10% | -0.05% | +0.13% |
| Dividend Yield | -0.02% z-0.1 | -0.10% | +0.14% | +0.31% | +0.33% |
| Size | +0.02% z+0.0 | -0.04% | -1.14% | -0.97% | +2.32% |
| Leverage | +0.01% z+0.0 | +0.20% | +1.24% | +0.47% | -1.79% |
| Growth | +0.01% z+0.0 | -0.01% | -0.25% | -0.50% | -0.12% |
| Style-Momentum | |||||
| One-Day Momentum | -0.13% z-0.5 | +0.52% | +0.55% | +0.31% | -2.76% |
| Medium-Term Momentum | -0.10% z-0.4 | +0.49% | -0.55% | -1.28% | -1.18% |
| Short-Term Momentum | +0.07% z+0.2 | -0.29% | -0.19% | +2.19% | -0.01% |
| Long-Term Momentum | -0.02% z-0.0 | -0.55% | -0.64% | -3.45% | +0.94% |
| Style-Positioning | |||||
| Short Interest | -0.08% z-0.5 | +0.25% | -0.04% | +0.49% | -0.59% |
| Hedge-Fund Ownership | -0.04% z-0.4 | -0.09% | -0.13% | -0.30% | -0.61% |
| Style-Flow | |||||
| Morning Activity | +0.04% z+0.3 | +0.19% | +0.06% | -0.17% | +0.28% |
| Short-Sale Activity | -0.03% z-0.3 | +0.04% | +0.05% | +0.22% | +0.93% |
| Thematic | |||||
| Oil | -0.25% z-0.5 | +0.28% | -0.68% | -0.97% | +4.52% |
| Semiconductors | +0.13% z+0.2 | -0.74% | +0.36% | -4.06% | -2.19% |
| China | +0.04% z+0.1 | -0.13% | -0.21% | -1.09% | -1.07% |
| Gold | +0.03% z+0.1 | -0.16% | +0.10% | -1.37% | +0.39% |
| Treasury (Duration) | -0.03% z-0.1 | +0.28% | +0.93% | +2.30% | -1.09% |
| Bitcoin / Crypto | +0.00% z+0.0 | -0.38% | -1.95% | -1.58% | +1.02% |
5/20/60d windows include today's session; 1d is the previous session.
Factor z-score. Today's factor return divided by its daily-return standard deviation over ~1,600 trading days.
High-beta momentum cohort. US names above $2B market cap in the top quintile of both raw beta and 12-month momentum; membership frozen at each month's first business day. “Top 50” = the 50 strongest by combined rank.
HF de-risking score. A FactorPulse measure of de-risking in factor returns: the average of four legs, each in its own daily-volatility units and counted only when it moves in the de-risking direction. They are the most-shorted names rising, 12-month momentum winners falling, names crowded in hedge-fund 13F filings falling net of their beta and momentum, and last week's relative moves continuing instead of reverting (counted only alongside another leg). A leg counts as firing at half its daily volatility or more, so a leg can show a small value without firing. Types: A, covering and selling together; B, selling only; C, covering only. Ranked against every session since January 2020. It reads factor returns only, never positions.
Stock-specific (idiosyncratic) return. The part of a stock's move not explained by the market, style or thematic (industry and theme) factors in the FactorPulse risk model.
VIXEQ / DSPX / COR1M. Cboe implied indices: single-stock volatility, dispersion, and 1-month implied correlation (top-50 S&P names). Quotes delayed ~15 minutes.
Data compiled by FactorPulse AI; edited and verified by Jeff Klein. For informational purposes only. Does not constitute financial advice, an investment recommendation, or an offer to buy or sell any securities. Always consult a qualified financial professional before making investment decisions.
For more on factor construction methodology, see www.factorpulse.com/glossary.
← FactorPulse · All Digests · Follow us on X
FactorPulse is free during launch · Sign up free (no credit card)