Intel Sinks 30% as High-Beta Momentum Stocks Head for 5th-Worst Day Since 2020
Macro:Intel's cash-flow warning hit high-beta stocks that have slid since early October. Labor-cost data matched forecasts. The 10-year yield fell 4.8 basis points. WTI rose 2.8% to $104.81 at 12:57 PM ET on Hormuz supply fears.
Market Moves: The S&P 500fell 1.8%. The Russell 2000fell 2.0%. The crypto-miner fund WGMIfell 10.2% after the Binance theft. The chip fund SMHfell 7.7%, giving back last week's gains. The staples fund XLProse 1.8%.
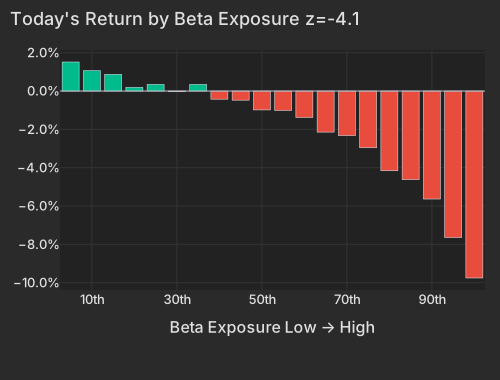
Factors:Beta fell 3.94% (z=-4.1), taking its 20-day loss to 13.7%. Semiconductors fell just 0.79% (z=-1.3), so chips sold for beta, not industry. Style factors explained 50% of stock-level variance, against a 23% one-year average.
Micro:Intelfell 29.8% after guiding fourth-quarter revenue below estimates and warning 2027 free cash flow is unlikely to be positive. Regeneronrose 11.1% on an EPS beat. AstraZenecarose 7.4% on an oncology-led beat and a new restructuring plan.
Watch: Does Apple's report on Monday, November 2, after the close, break the pattern of this week's megacap results, after Alphabet and Amazon both fell on theirs?
October 30, 2026 · 13:20 ET · Updated 13:55 ET · intraday
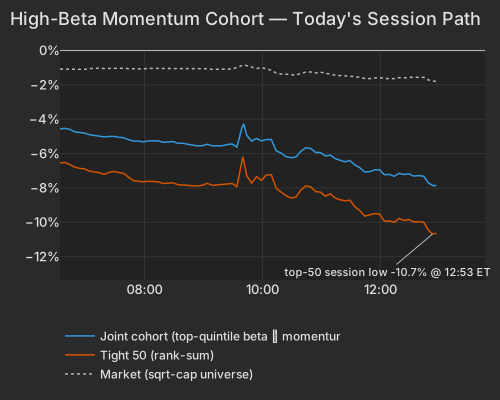
Intelis down 30% this afternoon, erasing about $140 billion of market value, after the chipmaker forecast fourth-quarter revenue of $15 billion to $16 billion, short of the roughly $17 billion analysts expected. Its finance chief, David Zinsner, also said free cash flow is unlikely to turn positive in 2027, with spending set to rise next year. The warning hit the stocks most sensitive to market moves, which have been sliding since early October. A basket of 50 high-beta stocks that had been among the market's biggest winners is down about 11%, on pace for its fifth-worst day since 2020, while the rest of the market is off half a percent. The S&P 500is down about 2% and the Nasdaq-100 nearly 4%.
The semiconductor fund SMHis down nearly 8%, with Nvidiaoff nearly 5% and AMDabout 12%, but the selling is tracking how hard a stock swings with the market rather than whether it makes chips. Memory-chip maker Sandiskis down 13% after beating forecasts, raising its outlook and announcing an 8-for-1 stock split. Amazon is down 2% after its results missed forecasts despite 39% growth at its AWS cloud unit. Goldman Sachs's prime brokerage said hedge funds cut single-stock positions in the week to October 23 at the fastest pace since late July.
Money is moving into steadier corners. The consumer-staples fund XLPis up about 2% today and 11% this month, on pace for its best month since 2019, and the health-care fund XLVis up about 1%, on pace for its second-best month since 2019. Drugmaker Regeneronis up 11% after beating earnings forecasts on 36% revenue growth, and drugmaker AstraZenecais up 7% after a beat led by its cancer drugs. Energy stocks are rising with oil near $105 a barrel, and oil company ExxonMobilis up 2% after beating forecasts on refining profits. The 10-year Treasury yield slipped to about 4.9% and gold is down 3%. Bitcoin is down nearly 5%, to about $77,000, after the exchange Binance reported a $6.3 billion theft.
Beta is down 3.94% at z=-4.1. The factor's 20-day loss is now 13.71% (z=-3.2), and its five-day loss of 1.09% wipes out last week's bounce. Style factors explain 50% of stock-level variance today, against a 23% one-year average.
Intel Is Down 30% on a Cash Warning While Amazon's Losses Shrink
Intel is down 29.8%, erasing $140 billion of market value. Its fourth-quarter revenue guidance of $15 billion to $16 billion missed estimates of about $17 billion Economic Times. CFO David Zinsner said capital spending will rise next year from this year's $20 billion. He also guided fourth-quarter gross margin to 38%, six points below the third quarter FinanceFeeds.
Amazon is down only 2.2%. Its results missed consensus even though AWS revenue grew 39% WSJ, and its free cash flow over the past 12 months was negative as spending guidance rose Economic Times. Its market and style exposures account for more than the whole decline; the stock-specific part is up 1.3%.
Earnings reactions so far todayReporters worth over $100 billion, or moving more than 10% with a value above $5 billion
Stock-specific: the part of a stock's move not explained by the market, style or thematic (industry and theme) factors in the FactorPulse risk model.
Revenue and margin from the company's earnings release, year over year; margin change in percentage points; — where the release is not parsed or the figures failed checks.
† The company's year-ago figure differs from the one originally filed, usually a restatement; growth is on its current basis.
Light volume: the company's earnings filing confirms the report, but trading volume has not caught up yet, so the move is an early read.
Of the 500 largest companies, 271 have reported (58% of market cap), on day 22 of the season.
How earnings reactions split, day 22 of the seasonThe 500 largest US companies with a confirmed earnings reaction so far (254), vs the same day in the past eight seasons and in four-season stretches back to mid-2020
Weighted by size, 24% of this season's reporters rose 2σ or more on a stock-specific basis, against 34% at this point in the past eight seasons; 26% fell 2σ or more (past: 34%).
Earnings reactions this season vs the past eight seasons, day 22
Season
≤ −5σ
−5 to −2σ
−2 to 0σ
0 to 2σ
2 to 5σ
≥ 5σ
This season
9%
17%
26%
24%
20%
4%
Past 8 seasons
15%
18%
16%
17%
18%
16%
Q2 2026
16%
21%
16%
13%
19%
15%
Q1 2026
12%
20%
12%
19%
19%
17%
Q4 2025
17%
17%
20%
14%
18%
14%
Q3 2025
12%
20%
18%
18%
16%
16%
Q2 2025
17%
20%
14%
15%
15%
19%
Q1 2025
18%
12%
15%
22%
22%
11%
Q4 2024
18%
14%
18%
19%
17%
13%
Q3 2024
15%
20%
15%
13%
20%
18%
Q3 '23–Q2 '24
17%
17%
16%
15%
19%
17%
Q3 '22–Q2 '23
12%
19%
19%
18%
20%
11%
Q3 '21–Q2 '22
13%
19%
14%
19%
23%
12%
Q3 '20–Q2 '21
7%
21%
29%
22%
17%
4%
σ: a stock's earnings-day stock-specific move divided by its typical daily stock-specific move over the past year. Each bar is cut at the same business day of the season; companies weighted by the square root of market cap.
The Selling Followed Beta, Not Chip Exposure
The top 50 high-beta momentum names are down 10.6%, on pace for their 5th-worst day out of 1,716 since 2020. The rest of the market is off 0.5%, and the broader high-beta momentum group is down 7.9%. Losses deepened through the session, from 6.2% at 9:40 to 10.7% at the 12:53 low.
The top 50 high-beta momentum names are down 10.6%, the 5th-worst of 1,716 days since 2020 so far, with the session low at 12:53.
High-Beta Momentum Cohort — Today's Session Path
Series
Ret Pct
joint
-7.88
tight50
-10.63
market
-1.79
rest
-0.46
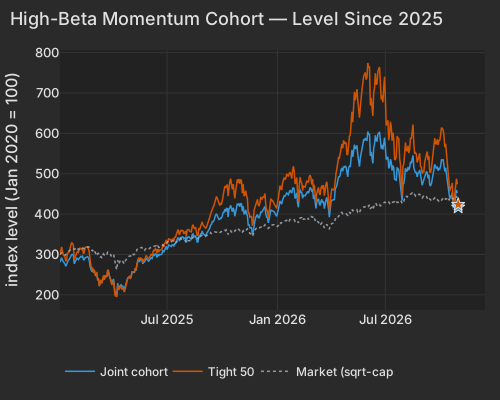
Before today, the broader group already sat 25.1% below its peak.
The broader high-beta momentum group entered the day 25.1% below its peak.
High-Beta Momentum Cohort — Level Since 2025
Series
Prev Close Level
joint
452.54
tight50
473.93
market
444.18
Splitting the screen in two shows what is being sold. Stocks that rank high on beta alone are down 5.5%, while stocks that rank high on 12-month momentum alone are down 1.4%. The Semiconductors factor is off just 0.79% even as SMH falls 7.7%. Nvidia's 4.6% drop and AMD's 11.7% slide come mostly from their factor exposures, and beta is the largest piece. The selling is tracking market sensitivity, and chipmakers carry the most of it.
The highest-beta bucket is down 9.8%, and the loss is concentrated at that end of the exposure range (z=-4.1).
Today's Return by Beta Exposure z=-4.1
Bucket
Avg Ret Pct
1
1.52
2
1.06
3
0.87
4
0.19
5
0.35
6
-0.03
7
0.34
8
-0.42
9
-0.48
10
-0.99
11
-1.01
12
-1.38
13
-2.14
14
-2.32
15
-2.96
16
-4.16
17
-4.62
18
-5.63
19
-7.64
20
-9.76
The faster factors are moving with the same trade. 20-day momentum (Medium-Term Momentum in the table) is up 0.38% at z=+1.3, because October's biggest losers are mostly these high-beta names and they are falling further. Yesterday's winners and losers (the one-day factor) gained 0.62% at z=+2.2, meaning Thursday's losers kept losing. Last week's winners also lagged, with Short-Term Momentum down 0.39%. Whatever bounced last week is being sold.
The Hedge-Fund Pain Index Is Back at Its October 22 Low
Goldman Sachs Prime Brokerage reported on October 26 that the week to October 23 brought the heaviest single-stock de-grossing since late July, with about $20 billion of net tech selling over two weeks. Our HF de-risking score sits at the 97th percentile since 2020 over 20 days and the 91st over 10 days. That factor pattern is consistent with a de-gross. Over the 20 days, 12-month winners fell, the most-shorted names rose and last week's moves kept extending.
So far today, the one-day score is at the 82nd percentile against full-day history, with 12-month winners and names crowded in hedge-fund 13F filings both lower. Hedge-fund-owned stocks lagged by 0.23% (z=-1.6), and by 0.12% (z=-1.1) after other style tilts are stripped out.
The hedge-fund pain index is 9.4 daily standard deviations below its October 6 peak, the 7th-deepest of 32 such events since 2020. That is level with the October 22 low so far; at Thursday's close it had won back 20% of the drop. Three of eight legs had confirmed a turn: beta, volatility and short-sale P&L. Beta and volatility made new lows today.
The pain index day by day against its October 6 peak: back at the October 22 low so far today, after winning back 20% of the drop by Thursday's close. It is the 7th-deepest of 32 such events since 2020.
HF pain index by day, in daily σ against the October 6 peak
Date
Sigma vs peak
Sep 24
-1.05
Sep 25
-0.40
Sep 28
-0.97
Sep 29
-0.52
Sep 30
-0.98
Oct 1
-0.37
Oct 2
-0.03
Oct 5
-0.47
Oct 6
0.00
Oct 7
-0.18
Oct 8
-0.86
Oct 9
-0.62
Oct 12
-1.47
Oct 13
-1.46
Oct 14
-2.82
Oct 15
-4.07
Oct 16
-4.86
Oct 19
-4.55
Oct 20
-5.45
Oct 21
-4.86
Oct 22
-9.42
Oct 23
-9.29
Oct 26
-8.57
Oct 27
-7.57
Oct 28
-6.98
Oct 29
-7.52
Oct 30 (so far today)
-9.41
Staples, Health Care and Energy Rose as the S&P 500 Fell 2%
The S&P 500 is down 1.8% and the Nasdaq-100 3.6%. The VIX is at 19.92, at the top of its 20-session range and just below the 19.99 close of October 16. The funds below show what is being sold and what is being bought.
ETF
Theme
Today
1d Ago
5d Ago
20d Ago
63d Ago
WGMI
crypto miners
-10.2%
-5.2%
+4.3%
-30.0%
-39.6%
DRAM
memory chips & storage
-8.0%
-4.4%
+13.3%
-16.6%
+2.7%
SMH
semiconductors
-7.7%
-1.1%
+7.3%
-9.1%
+3.9%
ARKK
innovation growth
-6.6%
-0.2%
+5.0%
-3.0%
+20.7%
MTUM
momentum
-5.2%
-1.7%
+3.4%
-7.0%
-0.2%
SPY
large cap
-1.8%
-0.4%
+0.7%
+0.7%
+3.2%
XLV
healthcare
+0.9%
+2.4%
+1.5%
+10.7%
+13.7%
XLU
utilities
+1.0%
+1.5%
+0.6%
+8.7%
-2.0%
XLE
energy
+1.6%
+0.4%
+1.7%
+9.6%
+16.1%
XLP
consumer staples
+1.8%
+1.5%
-2.0%
+9.8%
+4.4%
DRAM and SMH have given back last week's gains in a single session. XLP is up 11.3% month to date. Within health care, drugmakers such as AstraZeneca are ahead on company-specific moves. Life-sciences tool makers lag, with Repligen's stock-specific move down 5.1% and Revvity's down 3.9%.
Energy is rising with crude: WTI is at $104.81 at 12:57 PM ET, up 2.8% on the day CNBC. Gold spot is at $3,893.99 at 1:06 PM ET, down 3.1%CNBC. SLV is on pace for its third-worst month since 2019. Bitcoin is at $77,169 at 1:07 PM ET, down 4.5%CNBC, after Binance reported a $6.3 billion theft Morningstar.
Treasury Yields Fell 5 Basis Points as Credit Spreads Widened
The 10-year Treasury yield is at 4.94%, down 4.8 basis points, and the 2-year is at 4.60%, down 6 basis points CNBC. The morning's labor-cost data matched forecasts BLS. Over the past 20 sessions, SMH fell 9.1% while the 10-year yield fell about 25 basis points. Chip stocks have rarely tracked yields this closely since 2019.
Corporate credit spreads are widening. LQD and HYG both fell short of what the drop in yields alone explains, each by more than 0.4%. The strongest borrowers can still raise money cheaply: Microsoft priced its $25 billion bond sale on October 29 at about 64 basis points over Treasuries, size-weighted, according to FourWeekMBA. Indebted companies have outperformed this week, with Leverage up 1.14% over five sessions at z=+3.0. High-yield bonds are lagging, so the lift for indebted stocks is coming from lower Treasury yields, not from credit.
Economic Context
The Employment Cost Index, released at 8:30 AM ET, rose 0.8% in the third quarter. That matched consensus, and 12-month wage growth was 3.1% BLS. The New York Fed's Staff Nowcast, updated at 12:45 PM ET, held its fourth-quarter growth estimate at 2.8%.
Factor Regime Reference
Variance decomposition: live intraday — 20261030 session, bracketed against its trailing-year range. Factor returns are trailing through last close. Total cross-sectional dispersion: 99.6%ile of the past year.
Variance mix — % of total, today vs 1d ago vs 1-yr avg
Variance explained — today vs. factor's trailing-year range
Marker = the factor's share of today's total variance, placed in its own trailing-year range (box 25–75%ile, ticks 90%ile and max). Amber marker = unusually load-bearing today (≥90%ile of its own year). Factor name green = up today / red = down.
Realized 20d vol (ann. pts): all stocks 45 vs VIXEQ 41 · index 12 vs VIX 20 · style factors 2689%ile
20-day window (19 completed days + today); percentiles vs model history since 2020; '3m' tokens rank vs the trailing 63 trading days; definitions in Terms below. Implied prints (Cboe) are delayed ~15 min. as of 12:58 ET
Top 50 high-beta momentum names (eq-wt, since-2020 rank): -10.6%0.2%ileworst since 2026-06-05 · rest of market -0.5%
HF de-risking score (since-2020 rank so far today): 82%ile today · 42%ile 5-day · HF pain index 9.4σ below peak (7th-deepest of 32 since 2020), 0% won back · selling only: no short-covering leg
Trailing factor returns
Factor
Today
1d
5d
20d
60d
Style-Risk
Beta
-3.94%z-4.1
-1.26%
-1.09%
-13.71%
-9.62%
Residual Volatility
-0.22%z-0.4
-0.55%
-0.94%
-0.60%
+2.58%
International
+0.05%z+0.2
-0.26%
-1.05%
-0.85%
-0.44%
Style
Leverage
+0.17%z+1.0
+0.50%
+1.14%
+0.30%
-2.11%
Value
+0.22%z+0.9
-0.17%
-0.14%
-0.30%
-0.05%
Liquidity
-0.21%z-0.8
-0.15%
-0.18%
-0.47%
+2.09%
Size
+0.23%z+0.7
-0.82%
-0.70%
-0.58%
+2.06%
Profitability
+0.10%z+0.5
+0.42%
+0.24%
+1.06%
+0.23%
Dividend Yield
-0.03%z-0.2
+0.17%
+0.43%
-0.04%
+0.52%
Growth
-0.01%z-0.0
-0.17%
-0.21%
-0.37%
-0.14%
Style-Momentum
One-Day Momentum
+0.62%z+2.2
+0.13%
+0.83%
+0.60%
-2.58%
Medium-Term Momentum
+0.38%z+1.3
+0.04%
-1.30%
-1.29%
-1.17%
Short-Term Momentum
-0.39%z-1.3
+0.24%
-0.54%
+2.22%
+0.16%
Long-Term Momentum
-0.71%z-1.1
-0.53%
-0.34%
-3.75%
+0.06%
Style-Positioning
Short Interest
+0.18%z+1.1
-0.04%
-0.05%
+0.59%
-0.44%
Hedge-Fund Ownership
-0.12%z-1.1
+0.12%
-0.13%
-0.21%
-0.66%
Style-Flow
Morning Activity
+0.19%z+1.5
-0.21%
-0.11%
-0.15%
+0.44%
Short-Sale Activity
+0.01%z+0.1
+0.25%
-0.05%
+0.23%
+0.85%
Thematic
Bitcoin / Crypto
-0.46%z-1.5
-1.03%
-2.47%
-1.24%
+0.85%
Semiconductors
-0.79%z-1.3
-0.06%
+1.06%
-4.65%
-2.98%
China
-0.22%z-0.6
-0.36%
-1.09%
-0.89%
-0.85%
Gold
-0.11%z-0.4
-0.29%
-0.13%
-1.26%
+1.10%
Treasury (Duration)
+0.06%z+0.2
+0.48%
+0.65%
+2.01%
-1.27%
Oil
+0.08%z+0.2
-0.67%
-0.44%
-0.53%
+4.40%
5/20/60d windows include today's session; 1d is the previous session.
Terms
Factor z-score.Today's factor return divided by its daily-return standard deviation over ~1,600 trading days.
High-beta momentum cohort.US names above $2B market cap in the top quintile of both raw beta and 12-month momentum; membership frozen at each month's first business day. “Top 50” = the 50 strongest by combined rank.
HF de-risking score.A FactorPulse measure of de-risking in factor returns: the average of four legs, each in its own daily-volatility units and counted only when it moves in the de-risking direction. They are the most-shorted names rising, 12-month momentum winners falling, names crowded in hedge-fund 13F filings falling net of their beta and momentum, and last week's relative moves continuing instead of reverting (counted only alongside another leg). A leg counts as firing at half its daily volatility or more, so a leg can show a small value without firing. Types: A, covering and selling together; B, selling only; C, covering only. Ranked against every session since January 2020. It reads factor returns only, never positions.
Stock-specific (idiosyncratic) return.The part of a stock's move not explained by the market, style or thematic (industry and theme) factors in the FactorPulse risk model.
Data compiled by FactorPulse AI; edited and verified by Jeff Klein. For informational purposes only. Does not constitute financial advice, an investment recommendation, or an offer to buy or sell any securities. Always consult a qualified financial professional before making investment decisions.