Fortinet, ServiceNow and Caterpillar Beat and Still Sink; Alphabet Falls 11%
Macro: Beats are not protecting stocks: Fortinet, ServiceNow and Caterpillar topped revenue estimates but are being sold on their outlooks. Alongside the tech selling, the 10-year yield fell 4.4 basis points to 5.00% as of 9:21 AM ET. Jobless claims fell to 194,000, below consensus.
Market Moves: The S&P 500fell 0.4%, while the Russell 2000edged higher. Software led losses after the Fortinet and ServiceNow outlooks, with IGVdown 4.2%. Healthcare led the defensive bid on Eli Lilly's third guidance raise, with XLVup 2.1%.
Factors: Bitcoin / Crypto fell at z=-2.8, tracking AI-infrastructure and software selling more than bitcoin itself. Leverage rose at z=+2.3, with the most indebted names leading as Treasury yields fell. Style factors explained 14% of stock-level variance, against a 24% one-year average.
Micro:Alphabetfell 11.5% on a mixed quarter: search revenue missed and free cash flow fell short, while Cloud revenue doubled. Microsoftrose 2.8% as Azure grew 48% and capital spending came in below projections. Fortinetfell 26.4% on slowing product revenue growth despite a raised full-year outlook.
Watch: Will Amazon and Intel, reporting after today's close, break a season in which big earnings drops have outnumbered big gains?
October 29, 2026 · 09:27 ET · Updated 09:57 ET · pre-market
Soft outlooks sank three companies that had just beaten revenue estimates before Thursday's open. Cybersecurity company Fortinetfell 26% in pre-market trading and software maker ServiceNowfell 20% as investors focused on slowing growth ahead. Machinery maker Caterpillardropped 12%, on pace for its worst day since 2019, after reporting a record backlog but keeping its 2026 sales forecast below what analysts expected. Google parent Alphabetslid more than 11%, erasing about $460 billion of market value, on a mixed quarter: search revenue missed and free cash flow came in worse than expected, even as Google Cloud revenue doubled. Software giant Microsoftrose about 3%, adding roughly $110 billion, as its Azure cloud business grew 48% and capital spending came in below projections.
Losses grew the closer a business sits to AI computing. The software fund IGVfell 4%, the crypto-miner fund WGMI, whose miners now host AI work, dropped 4%, and the semiconductor fund SMHslipped about 2%, while bitcoin fell about 1% to around $80,000. Borrowing costs for the AI build-out are climbing even for top-rated borrowers. Morgan Stanley says top-rated data-center bonds now yield close to 7%, up from under 5% at the start of the year, and the cost of insuring Broadcom and Oracle debt against default has jumped to levels typical of junk-rated borrowers. That favors companies that can pay for their spending from their own cash, and debt-heavy companies outperformed as the 10-year Treasury yield slipped to 5%. The Nasdaq-100fell about 1% and the S&P 500fell 0.4%.
Investors kept buying defensive stocks. The consumer staples fund XLProse about 1% and is up about 9% this month, on pace for its second-best month since 2019. Drugmaker Eli Lillygained 4%, adding about $48 billion in value, after raising its 2026 revenue forecast for the third time this year. Factor moves over the past month still look like hedge funds cutting risk at one of the sharpest paces since 2020, and options traders are bracing for big swings in individual stocks even as Wall Street's fear gauge, the VIX, sits at 17. Weekly jobless claims fell to 194,000, below forecasts.
Fortinet (FTNT) is down 26.4% and ServiceNow (NOW) 19.9% in pre-market trading. Both beat revenue estimates, but slowing forward indicators outweighed the quarter 24/7 Wall St.. Fortinet raised its full-year revenue outlook, but product revenue growth slowed to 37% from 52% in the second quarter. Seeking Alpha ServiceNow forecast just over 18% growth in its bookings gauge, current remaining performance obligations, for the December quarter. Analysts had expected 19%, according to Bloomberg. That outweighed a higher 2026 AI contract-value target of $1.7 billion, according to ServiceNow. The software fund IGV is down 4.2%, more than wiping out last week's gain, after rising 19.9% over three months.
Caterpillar (CAT) is down 12.0%, on pace for its worst day since 2019 Bloomberg. It beat profit estimates and reported a record $78.1 billion backlog. But it kept its 2026 revenue growth forecast at the mid-to-high teens, while analysts expected about 18%, according to Reuters. The AI power names followed only partly. GE Vernova (GEV) is down 3.1% and Vertiv (VRT) 3.3%, mostly because they are high-beta stocks on a day high-beta names are falling.
Alphabet (GOOGL) is down 11.5% after its report, erasing about $464 billion of market value. Search revenue missed estimates and free cash flow, negative $9.07 billion, came in worse than analysts expected, while Google Cloud revenue rose 103%. CNBC Bernstein cut its price target to $325 and kept Market Perform, saying search growth slowed against the prior quarter, the prior year and a two-year comparison. Most other brokers trimmed targets but kept Buy-equivalent ratings, JPMorgan among them at $375 with Overweight. Bulls point to Cloud and to Gemini 4 Carbon, released Wednesday, which ranks first on Artificial Analysis's intelligence index but is not yet publicly available. Dealroom Microsoft (MSFT) is up 2.8%, adding $108 billion of market value, as Azure grew 48% and its $45.2 billion of capital spending, including finance leases, came in below projections CNBC.
This season's reactions still lean to the downside: more big drops than big gains, and fewer of both than at this point in any of the past eight seasons. Another 61 reactions are still trading intraday, so the shares are not final.
Earnings reactions in early tradingReporters worth over $100 billion, or moving more than 10% with a value above $5 billion
Stock-specific: the part of a stock's move not explained by the market, style or thematic (industry and theme) factors in the FactorPulse risk model.
Revenue and margin from the company's earnings release, year over year; margin change in percentage points; — where the release is not parsed or the figures failed checks.
Light volume: the company's earnings filing confirms the report, but trading volume has not caught up yet, so the move is an early read.
Of the 500 largest companies, 229 have reported (49% of market cap), on day 21 of the season.
How earnings reactions split, day 21 of the seasonThe 500 largest US companies with a confirmed earnings reaction so far (209), vs the same day in the past eight seasons and in four-season stretches back to mid-2020
Weighted by size, 26% of this season's reporters rose 2σ or more on a stock-specific basis, against 33% at this point in the past eight seasons; 28% fell 2σ or more (past: 34%).
Earnings reactions this season vs the past eight seasons, day 21
Season
≤ −5σ
−5 to −2σ
−2 to 0σ
0 to 2σ
2 to 5σ
≥ 5σ
This season
9%
19%
27%
20%
22%
3%
Past 8 seasons
15%
19%
17%
17%
18%
15%
Q2 2026
12%
22%
18%
13%
20%
15%
Q1 2026
13%
21%
13%
19%
17%
18%
Q4 2025
17%
16%
22%
13%
17%
14%
Q3 2025
9%
20%
21%
18%
13%
19%
Q2 2025
19%
23%
15%
15%
15%
14%
Q1 2025
17%
15%
16%
21%
24%
7%
Q4 2024
16%
14%
18%
22%
17%
13%
Q3 2024
18%
18%
16%
13%
17%
19%
Q3 '23–Q2 '24
16%
17%
16%
15%
18%
17%
Q3 '22–Q2 '23
12%
20%
18%
18%
21%
12%
Q3 '21–Q2 '22
14%
19%
14%
19%
23%
12%
Q3 '20–Q2 '21
7%
21%
27%
23%
18%
3%
σ: a stock's earnings-day stock-specific move divided by its typical daily stock-specific move over the past year. Each bar is cut at the same business day of the season; companies weighted by the square root of market cap.
Credit Strain Reaches Top-Rated AI Borrowers, Favoring Companies That Fund Themselves
Borrowing for the AI build-out is getting harder even at the top of the credit ladder. Morgan Stanley says the highest-rated data-center bonds now yield close to 7%, up from below 5% at the start of 2026. Credit default swaps on Broadcom and Oracle have spiked to levels typical of junk-rated borrowers. Bloomberg Citadel Securities warned that even the biggest tech companies could be drawn in as they put their balance sheets behind AI projects, Bloomberg reported Thursday.
In that market, the dividing line is whether a company needs new money. Microsoft generated about $18.6 billion of free cash flow last quarter, while Alphabet's was negative $9.07 billion. Indebted companies that generate cash can carry their existing debt without returning to a tighter market, one read of why the most indebted stocks are leading today (Leverage at z=+2.3). Credit itself is not easing: LQD and HYG are each about 0.2% weaker than the drop in Treasury yields alone would imply.
Crypto Factor Falls at z=-2.8 on AI-Infrastructure Names
Factor
Return
Z-Score
5d Z
20d Z
63d Z
Category
Direction
Bitcoin / Crypto
-0.85%
-2.8
-2.2
-0.8
+0.5
Thematic
High crypto-beta names lagged
Leverage
+0.38%
+2.3
+2.2
+0.2
-2.3
Style
Most indebted led net-cash names
Hedge-Fund Ownership
+0.20%
+1.9
-0.4
-0.3
-0.4
Positioning
Heavily fund-owned names led
Beta
-1.16%
-1.2
+1.5
-2.1
-0.4
Risk
High-beta names lagged
Short-Sale Activity
+0.13%
+1.2
-0.7
+0.4
+1.1
Flow
Yesterday's most short-sold names led
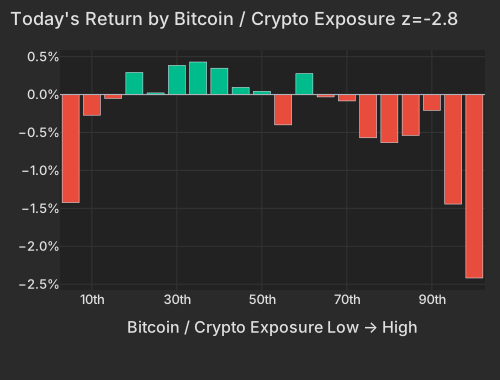
Bitcoin / Crypto is the largest factor move, at -0.85% with z=-2.8, and has fallen on three of the past five days (5-day z=-2.2). Bitcoin itself is down just 1.4%, at $80,102 as of 9:21 AM ET CNBC. The losses get bigger the closer a business sits to AI computing. Crypto exchanges and brokers have a median drop of 2.1% and miners that now host AI workloads 4.1%, and AI cloud operators fall furthest, CoreWeave (CRWV) down 5.8%. ServiceNow, Fortinet and Salesforce also carry high crypto exposure in our model, so part of the software selling lands in this factor. In other words, the factor is mostly tracking AI infrastructure and software today, despite its crypto name.
The names with the highest crypto exposure are down 2.4% so far; the factor is at z=-2.8.
Today's Return by Bitcoin / Crypto Exposure z=-2.8
Bucket
Avg Ret Pct
1
-1.42
2
-0.27
3
-0.05
4
0.29
5
0.02
6
0.38
7
0.43
8
0.35
9
0.09
10
0.04
11
-0.40
12
0.28
13
-0.03
14
-0.08
15
-0.57
16
-0.63
17
-0.54
18
-0.21
19
-1.44
20
-2.42
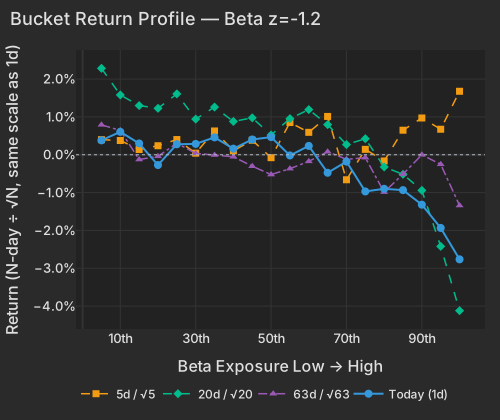
Beta is down 1.16% at z=-1.2, giving back part of a 3.17% five-day rebound. Over 20 sessions the factor has lost 8.84% (20-day z=-2.1), so last week recovered only a fraction of the slide. The most market-sensitive names are down 2.8%, led by AI hardware stocks. In pre-market trading the high-beta momentum cohort is down 2.1% while the rest of the market is up 0.2%, which tests its rebound from the October 22 low.
High-beta names lag today (1-day rank correlation -0.82) and over 20 days (-0.94); only the 5-day profile points the other way (+0.36).
Bucket Return Profile — Beta z=-1.2
Bucket
Ret 1D Pct
Ret 5D Norm Pct
Ret 20D Norm Pct
Ret 63D Norm Pct
1
0.38
0.40
2.28
0.79
2
0.61
0.38
1.58
0.64
3
0.30
0.14
1.30
-0.13
4
-0.27
0.24
1.23
-0.04
5
0.28
0.40
1.61
0.30
6
0.29
0.04
0.94
0.04
7
0.46
0.63
1.26
-0.01
8
0.16
0.10
0.88
-0.05
9
0.40
0.38
0.98
-0.30
10
0.47
-0.08
0.52
-0.52
11
-0.02
0.85
0.95
-0.37
12
0.23
0.59
1.19
-0.18
13
-0.48
1.01
0.80
0.08
14
-0.18
-0.66
0.27
-0.12
15
-0.97
0.14
0.42
-0.08
16
-0.90
-0.16
-0.32
-0.99
17
-0.94
0.65
-0.52
-0.51
18
-1.32
0.97
-0.94
-0.00
19
-1.93
0.67
-2.42
-0.25
20
-2.76
1.68
-4.12
-1.34
Indebted Stocks Lead as the 10-Year Yield Slips to 5.00%
Leverage is up 0.38% at z=+2.3, with the most indebted companies beating those with net cash. That runs against the past three months (63-day z=-2.3). Over five sessions the factor has gained 0.83% (5-day z=+2.2), winning back about a third of the 2.49% it lost over 60 sessions. The 10-year yield is down 4.4 basis points at 5.00%, and the two-year is down 4.6 at 4.69% CNBC.
Staples Head for Their Second-Best Month Since 2019
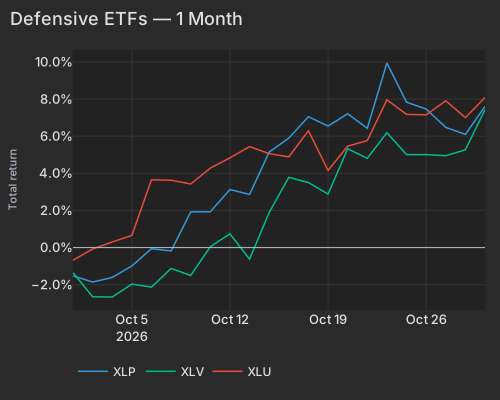
XLP is up 9.3% month to date, on pace for its second-best month since 2019. The health care fund XLV ranks fifth on the same measure and the utilities fund XLU sixth. Eli Lilly (LLY) is up 4.2%, adding $48 billion of market value, after raising its 2026 revenue guidance for the third time this year Financial Times. The table shows the split: the S&P 500 is down 0.4% and the Nasdaq-100 1.2%.
ETF
Theme
Today
1d Ago
5d Ago
20d Ago
63d Ago
IGV
software
-4.2%
+0.1%
+2.8%
+5.1%
+19.9%
WGMI
crypto miners
-4.1%
+4.9%
+1.1%
-27.0%
-38.0%
DRAM
memory chips & storage
-3.1%
+7.1%
+10.1%
-10.3%
+3.4%
XLC
communication services
-1.9%
-0.4%
-5.4%
-7.1%
-2.9%
SMH
semiconductors
-1.6%
+1.7%
+2.0%
-6.8%
+5.3%
QQQ
large cap growth
-1.2%
+0.6%
+0.1%
-1.9%
+6.3%
SPY
large cap
-0.4%
+0.3%
-0.1%
+1.3%
+4.4%
XLU
utilities
+0.9%
-0.8%
+1.2%
+7.7%
-4.2%
XLP
consumer staples
+1.4%
-0.4%
-0.3%
+7.7%
+2.3%
XLV
healthcare
+2.1%
+0.3%
+0.4%
+6.7%
+10.3%
Including today, XLU is up 8.1%, XLP 7.6% and XLV 7.4% over the past month.
The move into defensive sectors comes during a de-risking episode that has not ended. Through Wednesday's close, our HF de-risking score over 20 days stood at the 95th percentile since 2020. It was driven by 12-month winners falling and by last week's moves continuing rather than reversing, a factor pattern consistent with a de-gross. Through Wednesday, the hedge-fund pain index had won back about 26% of its fall from the October 6 peak to the October 22 low, the 7th-deepest of 32 such events since 2020. So far in pre-market trading, the stocks most heavily owned by hedge funds are outperforming (Hedge-Fund Ownership at z=+1.9).
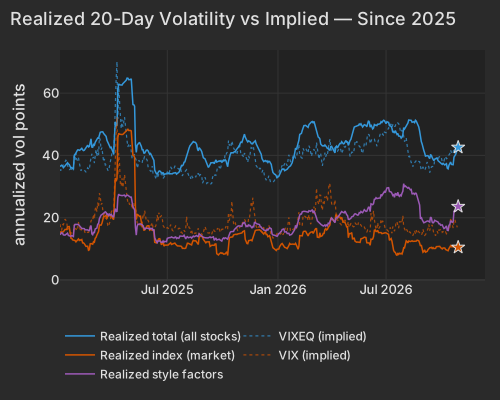
The options market is pricing risk in individual stocks, not the index. Implied single-stock volatility (Cboe VIXEQ) is 41.8, in its 90th percentile since 2014 and at the top of its 20-session range, while the VIX is 17.1. Implied dispersion (Cboe DSPX) sits in its 97th percentile since 2014. Implied correlation among the 50 largest S&P 500 stocks (Cboe COR1M) is in the lowest 3% of readings since 2006. Realized correlation across our universe is still near its lows, at 8.1% over 20 days, in the lowest 5% of readings since 2020. Those prices point to an earnings season where each stock moves on its own report.
Realized index volatility over 20 days is 10.5 vol points (10th percentile since 2020), against 23.6 for style factors (86th); VIXEQ is 41.8 and the VIX 17.1.
Realized 20-Day Volatility vs Implied — Since 2025
Series
Today Vol Pts
Prev Close Vol Pts
total
42.60
41.85
market
10.50
10.50
style
23.60
23.33
Amazon (AMZN) and Intel (INTC) report after today's close. Amazon is down 2.1% ahead of its results, nearly all of it explained by its factor exposures.
Economic Context
Initial jobless claims, released at 8:30 AM ET, fell to 194,000 for the week ending Oct 24, below the 199,000 consensus Labor Department. Continuing claims dropped 21,000 to 1.701 million. The dollar index is up 0.2% at 102.40 as of 9:21 AM ET CNBC.
Factor Regime Reference
Variance decomposition: live intraday — 20261029 session, bracketed against its trailing-year range. Factor returns are trailing through last close. Total cross-sectional dispersion: 79%ile of the past year.
Variance mix — % of total, today vs 1d ago vs 1-yr avg
Variance explained — today vs. factor's trailing-year range
Marker = the factor's share of today's total variance, placed in its own trailing-year range (box 25–75%ile, ticks 90%ile and max). Amber marker = unusually load-bearing today (≥90%ile of its own year). Factor name green = up today / red = down.
Realized 20d vol (ann. pts): all stocks 43 vs VIXEQ 42 · index 10 vs VIX 17 · style factors 2486%ile
20-day window (19 completed days + today); percentiles vs model history since 2020; '3m' tokens rank vs the trailing 63 trading days; definitions in Terms below. Implied prints (Cboe) are delayed ~15 min. as of 08:58 ET
HF de-risking score (since-2020 rank so far today): 41%ile today · 36%ile 5-day · HF pain index 7.0σ below peak (7th-deepest of 32 since 2020)
Trailing factor returns
Factor
Today
1d
5d
20d
60d
Style-Risk
Beta
-1.16%z-1.2
+1.09%
+3.17%
-8.84%
-6.13%
Residual Volatility
-0.34%z-0.7
+0.35%
-0.18%
-0.51%
+3.00%
International
-0.09%z-0.3
+0.06%
-0.69%
-0.71%
-0.09%
Style
Leverage
+0.38%z+2.3
+0.26%
+0.83%
+0.13%
-2.49%
Profitability
+0.14%z+0.7
-0.08%
-0.53%
+0.56%
-0.36%
Dividend Yield
+0.12%z+0.7
-0.06%
+0.63%
-0.14%
+0.50%
Growth
-0.16%z-0.7
+0.10%
-0.29%
-0.57%
-0.24%
Size
-0.22%z-0.6
+0.03%
-0.29%
-0.09%
+2.60%
Value
-0.07%z-0.3
+0.22%
-0.38%
-0.44%
-0.36%
Liquidity
+0.05%z+0.2
+0.17%
-0.12%
-0.47%
+2.37%
Style-Momentum
One-Day Momentum
+0.23%z+0.8
+0.07%
+0.04%
-0.09%
-3.38%
Short-Term Momentum
-0.14%z-0.5
+0.06%
-0.32%
+2.50%
+0.46%
Long-Term Momentum
-0.09%z-0.1
+0.28%
+1.47%
-2.38%
+1.20%
Medium-Term Momentum
-0.02%z-0.1
-0.32%
-1.79%
-1.53%
-1.86%
Style-Positioning
Hedge-Fund Ownership
+0.20%z+1.9
-0.06%
-0.11%
-0.15%
-0.49%
Short Interest
-0.05%z-0.3
-0.10%
-0.32%
+0.28%
-0.95%
Style-Flow
Short-Sale Activity
+0.13%z+1.2
-0.10%
-0.17%
+0.18%
+0.71%
Morning Activity
-0.06%z-0.4
-0.05%
+0.01%
-0.38%
+0.31%
Thematic
Bitcoin / Crypto
-0.85%z-2.8
-0.11%
-1.50%
-1.08%
+1.58%
Oil
-0.33%z-0.7
+0.12%
+0.89%
-0.17%
+5.15%
China
-0.22%z-0.5
+0.18%
-0.58%
-0.97%
-0.23%
Semiconductors
+0.21%z+0.3
+0.59%
+2.59%
-3.12%
-1.36%
Treasury (Duration)
+0.06%z+0.2
+0.17%
-0.13%
+1.16%
-1.95%
Gold
-0.00%z-0.0
+0.23%
+0.09%
-0.76%
+1.68%
5/20/60d windows include today's session; 1d is the previous session.
Terms
Pairwise realized correlation.Index variance net of the weighted idiosyncratic diagonal, over the cross terms — the estimator used for implied-correlation indices. 20-day window unless noted; history since 2020.
Market variance share.The fraction of cross-sectional variance explained by the market factor — the attribution companion to pairwise correlation, not a substitute for it.
Factor z-score.Today's factor return divided by its daily-return standard deviation over ~1,600 trading days.
Conditional importance.A factor's relative share of what a tree-based fit of today's stock returns explains; sums to 100% across factors.
High-beta momentum cohort.US names above $2B market cap in the top quintile of both raw beta and 12-month momentum; membership frozen at each month's first business day. “Top 50” = the 50 strongest by combined rank.
HF de-risking score.A FactorPulse measure of de-risking in factor returns: the average of four legs, each in its own daily-volatility units and counted only when it moves in the de-risking direction. They are the most-shorted names rising, 12-month momentum winners falling, names crowded in hedge-fund 13F filings falling net of their beta and momentum, and last week's relative moves continuing instead of reverting (counted only alongside another leg). A leg counts as firing at half its daily volatility or more, so a leg can show a small value without firing. Types: A, covering and selling together; B, selling only; C, covering only. Ranked against every session since January 2020. It reads factor returns only, never positions.
Dispersion (realized).Total cross-sectional volatility net of the market component; high dispersion is the flip side of low correlation.
Stock-specific (idiosyncratic) return.The part of a stock's move not explained by the market, style or thematic (industry and theme) factors in the FactorPulse risk model.
Data compiled by FactorPulse AI; edited and verified by Jeff Klein. For informational purposes only. Does not constitute financial advice, an investment recommendation, or an offer to buy or sell any securities. Always consult a qualified financial professional before making investment decisions.