Disappointing results from three of the biggest technology companies kept this earnings season's losses coming. Google parent Alphabet fell 13%, wiping out more than $500 billion of market value, on a mixed quarter in which free cash flow came in about $9 billion negative, far worse than analysts expected. After the bell, Amazon fell 6% in late trading, on top of a 4% drop in the regular session, after missing profit and advertising forecasts even as its AWS cloud business grew 39%. Its free cash flow over the past year was negative $42 billion, and it kept its 2026 spending plan at $220 billion. Chipmaker Intel sank 17.5% in late trading after forecasting fourth-quarter sales below estimates and saying the PC slowdown will last at least through the first half of next year. Earlier in the day, business-software maker ServiceNow plunged 27% and cybersecurity firm Fortinet fell 21%. Big drops have outnumbered big gains all season, and tonight's late trading followed the same pattern.
The selling hit the stocks most tied to AI spending. The 50 high-flying stocks most sensitive to market moves fell about 5%, nearly all of it after midday. The Nasdaq-100 fell 1.5% and the S&P 500 0.4%, while the Russell 2000 rose 0.9%. AI cloud providers CoreWeave and Nebius each fell about 9%, and the crypto-miner fund WGMI dropped 5% because many miners now host AI computing. The software fund IGV lost 3.5%. Microsoft began selling at least $25 billion of bonds, its first big US investment-grade sale since 2017, and its shares slipped 0.1%. The investment-grade bond fund LQD gained just 0.1%, when the drop in yields implied nearly 1%, a sign that credit spreads widened. Morgan Stanley's Carolyn Campbell said the highest-rated data-center bonds now yield close to 7%, up from under 5% at the start of the year. Citadel Securities warned that even the biggest tech companies could get pulled in as they commit their balance sheets to AI.
Investors moved into government bonds and defensive stocks. The two-year Treasury yield fell about 12 basis points to 4.6%, and the 10-year yield fell about 10 basis points to just under 5%. The consumer-staples fund XLP rose 1.5% and is up 10% this month, on pace for its second-best month since 2019. The healthcare fund XLV gained 2.4%, and drugmaker Eli Lilly jumped nearly 7% after raising its full-year sales forecast for the third time this year. The homebuilder fund ITB rose 3.5% as Treasuries rallied. Weekly jobless claims fell to 194,000, below forecasts.
Alphabet (GOOGL) closed the regular session down 12.8% on a mixed quarter. Free cash flow was negative $9.07 billion, against the $2.70 billion analysts expected CNBC. After the bell, Amazon (AMZN) fell 6.3% in late trading, having closed the session down 4.3%. Earnings and advertising revenue missed estimates even as AWS grew 39%, and free cash flow over the past 12 months was negative $42.4 billion CNBC. Intel (INTC) closed down 3.7%, then fell 17.5% in late trading after guiding fourth-quarter revenue to $15.0–16.0 billion, below estimates WSJ. Microsoft (MSFT), which had beaten on free cash flow, came to the bond market the same day seeking at least $25 billion Bloomberg. Its shares closed down 0.1%. The question has moved from which spenders can pay for AI out of cash to what they, and the companies that live off their budgets, will pay to borrow.
The top 50 high-beta momentum names fell 5.3%, against a 1.3% gain for the rest of the market. The broader ~190-name group fell 3.0%. The names that fit the high-beta momentum profile most closely fell nearly twice as far. Almost all of the drop came after midday, when the top 50 were close to flat.
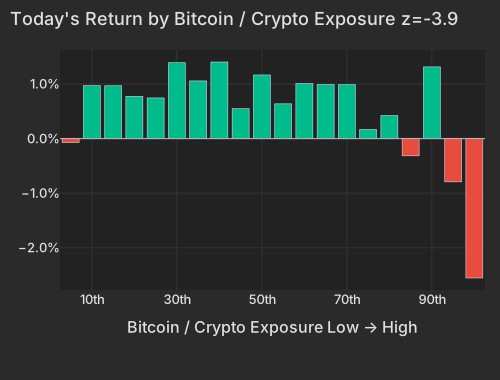
Bitcoin / Crypto fell 1.18% at z=-3.9, the factor's worst day since 2020. Bitcoin itself slipped 1.2% to $80,275 at 4:29 PM ET CNBC. Crypto exchanges and brokers fell a median 2.2%, and miners that now host AI computing fell a median 5.9%. The AI cloud operators CoreWeave (CRWV) and Nebius (NBIS) were both down about 9%. This was selling in AI infrastructure that the model books under a crypto label.
| Bucket | Avg Ret Pct |
|---|---|
| 1 | -0.07 |
| 2 | 0.97 |
| 3 | 0.97 |
| 4 | 0.78 |
| 5 | 0.75 |
| 6 | 1.39 |
| 7 | 1.06 |
| 8 | 1.40 |
| 9 | 0.55 |
| 10 | 1.17 |
| 11 | 0.64 |
| 12 | 1.01 |
| 13 | 0.99 |
| 14 | 0.99 |
| 15 | 0.17 |
| 16 | 0.42 |
| 17 | -0.32 |
| 18 | 1.31 |
| 19 | -0.79 |
| 20 | -2.56 |
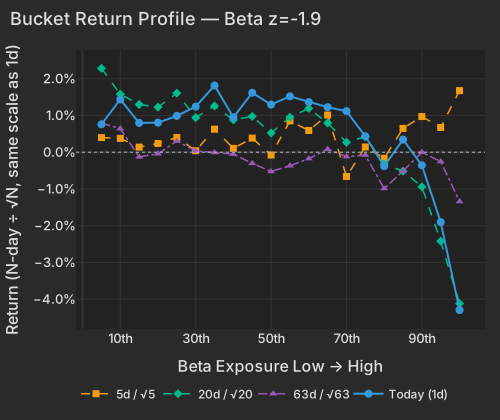
Beta fell 1.82% at z=-1.9, bringing its 20-day loss to 9.50%. Over five sessions it is still up 2.51%, so the rebound from the October 22 low is dented, not erased. The software fund IGV lost 3.5% in the session, more than wiping out its prior five-session gain.
| Factor | Return | Z-Score | 5d Z | 20d Z | 63d Z | Category | Direction |
|---|---|---|---|---|---|---|---|
| Bitcoin / Crypto | -1.18% | -3.9 | -2.7 | -1.0 | +0.3 | Thematic | AI-hosting miners lagged |
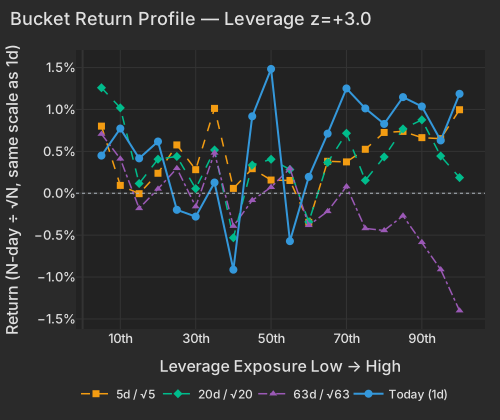
| Leverage | +0.50% | +3.0 | +2.5 | +0.3 | -2.2 | Style | Most indebted names led |
| Profitability | +0.51% | +2.7 | -0.4 | +1.1 | -0.1 | Style | More profitable names led |
| Short-Sale Activity | +0.29% | +2.7 | 0.0 | +0.7 | +1.3 | Style-Flow | Yesterday's heavily short-sold names led |
| Size | -0.90% | -2.6 | -1.3 | -0.5 | +0.6 | Style | Largest companies lagged |
| Beta | -1.82% | -1.9 | +1.2 | -2.2 | -0.4 | Style-Risk | High-beta names lagged |
| Treasury (Duration) | +0.42% | +1.3 | +0.3 | +1.1 | -0.7 | Thematic | Bond-sensitive names led |
| Bucket | Ret 1D Pct | Ret 5D Norm Pct | Ret 20D Norm Pct | Ret 63D Norm Pct |
|---|---|---|---|---|
| 1 | 0.76 | 0.40 | 2.28 | 0.79 |
| 2 | 1.44 | 0.38 | 1.58 | 0.64 |
| 3 | 0.80 | 0.14 | 1.30 | -0.13 |
| 4 | 0.80 | 0.24 | 1.23 | -0.04 |
| 5 | 0.99 | 0.40 | 1.61 | 0.30 |
| 6 | 1.24 | 0.04 | 0.94 | 0.04 |
| 7 | 1.82 | 0.63 | 1.26 | -0.01 |
| 8 | 0.95 | 0.10 | 0.88 | -0.05 |
| 9 | 1.62 | 0.38 | 0.98 | -0.30 |
| 10 | 1.30 | -0.08 | 0.52 | -0.52 |
| 11 | 1.52 | 0.85 | 0.95 | -0.37 |
| 12 | 1.37 | 0.59 | 1.19 | -0.18 |
| 13 | 1.23 | 1.01 | 0.80 | 0.08 |
| 14 | 1.12 | -0.66 | 0.27 | -0.12 |
| 15 | 0.43 | 0.14 | 0.42 | -0.08 |
| 16 | -0.38 | -0.16 | -0.32 | -0.99 |
| 17 | 0.34 | 0.65 | -0.52 | -0.51 |
| 18 | -0.35 | 0.97 | -0.94 | -0.00 |
| 19 | -1.90 | 0.67 | -2.42 | -0.25 |
| 20 | -4.30 | 1.68 | -4.12 | -1.34 |
Earnings reactions in the regular sessionReporters worth over $100 billion, or moving more than 10% with a value above $5 billion
| Company | Move | Stock-specific | Market cap | Revenue YoY | Margin YoY | What drove it |
|---|---|---|---|---|---|---|
| ServiceNow NOW | -26.9% | -25.5% | $155B | +21% | -0.9 pts adj. operating | Profit miss and soft fourth-quarter bookings guidance Economic Times |
| Alnylam Pharmaceuticals ALNY | -25.1% | -26.3% | $31B | — | — | — |
| Sprouts Farmers Market SFM | -22.6% | -24.1% | $6B | — | — | — |
| Fortinet FTNT | -20.8% | -18.6% | $128B | +20% | +1.3 pts adj. operating | Cut to full-year service revenue forecast Economic Times |
| Haleon HLN | -14.5% | -15.5% | $44B | — | — | — |
| Aurora Innovation AUR | -13.2% | -11.4% | $10B | — | — | — |
| Alphabet GOOGL | -12.8% | -9.6% | $4.0T | +25% | +1.3 pts operating | Mixed quarter; negative free cash flow CNBC |
| Caterpillar CAT | -9.3% | -8.5% | $328B | +17% | +3.1 pts adj. operating | Beat, but 2026 sales forecast unchanged Economic Times |
| Anheuser-Busch InBev BUD | -1.8% | -2.3% | $160B | — | — | — |
| Linde LIN | -1.0% light volume | -1.1% | $234B | +9% | -0.3 pts adj. operating | — |
| T-Mobile US TMUS | -0.5% light volume | -0.8% | $157B | +7% | +3.4 pts operating | — |
| Microsoft MSFT | -0.1% | +1.6% | $3.9T | +19% | +0.9 pts operating | Capex below forecast; bond sale of $25B-plus CNBC |
| Bristol-Myers Squibb BMY | +1.2% light volume | +0.8% | $124B | +7% | -7.8 pts adj. operating | — |
| Merck MRK | +3.8% light volume | +4.5% | $348B | +5% | -3.2 pts adj. operating | Sales beat led by Winrevair, Keytruda Qlex |
| Mastercard MA | +4.3% light volume | +3.4% | $535B | +14% | +0.7 pts adj. operating | — |
| Altria MO | +5.1% | +2.1% | $122B | +1% | +1.5 pts adj. pre-tax | — |
| KLA KLAC | +5.2% light volume | +5.9% | $207B | +29% | +3.4 pts operating | — |
| Eli Lilly LLY | +6.6% | +6.0% | $1.1T | +39% | -6.6 pts operating | Third full-year revenue guidance raise FT |
| Churchill Downs CHDN | +11.5% | +8.8% | $6B | — | — | — |
| Leonardo DRS DRS | +11.8% | +9.7% | $10B | — | — | — |
| Textron TXT | +12.2% | +9.5% | $14B | — | — | — |
| Builders FirstSource BLDR | +12.8% | +8.9% | $6B | — | — | — |
| Huntington Ingalls Industries HII | +13.6% | +10.9% | $11B | — | — | — |
| Insmed INSM | +15.2% | +13.1% | $21B | — | — | — |
| Gen Digital GEN | +15.8% | +13.5% | $15B | — | — | — |
| Carvana CVNA | +15.9% | +15.7% | $65B | +42% | -0.9 pts operating | — |
| Crocs CROX | +25.1% | +23.1% | $6B | — | — | Beat and raised full-year profit outlook |
| Glaukos GKOS | +32.8% | +33.9% | $11B | — | — | — |
Reported after the close, as of 16:26 ETLate trading from the 4 PM close; same size rule
| Company | Move | Market-adjusted | Market cap | Revenue YoY | Margin YoY | What drove it |
|---|---|---|---|---|---|---|
| Intel INTC | -17.5% | -15.9% | $505B | +21% | +8.4 pts adj. operating | Fourth-quarter revenue outlook below estimates |
| Twilio TWLO | -13.5% | -12.8% | $39B | +20% | +2.9 pts adj. operating | — |
| Reddit RDDT | -10.8% | -10.2% | $26B | +53% | +5.5 pts operating | — |
| Amazon AMZN | -6.3% | -5.7% | $2.7T | +12% | +4.2 pts operating | Earnings and ad revenue missed; AWS up 39% CNBC |
| Stryker SYK | -6.1% | -6.3% | $117B | +8% | +0.6 pts adj. operating | — |
| Starbucks SBUX | -0.6% | -0.6% | $118B | -4% | +4.6 pts adj. operating | — |
| Sandisk SNDK | +1.7% | +3.6% | $203B | +378% | +69.8 pts adj. operating | — |
| Gilead Sciences GILD | +2.7% | +2.6% | $197B | +7% | -0.3 pts adj. operating | — |
Stock-specific: the part of a stock's move not explained by the market, style or thematic (industry and theme) factors in the FactorPulse risk model.
After the close: moves trade on a fraction of a normal session's volume, so each is an early read. Market-adjusted: the move minus the stock's beta times the S&P 500's late-trading move.
Revenue and margin from the company's earnings release, year over year; margin change in percentage points; — where the release is not parsed or the figures failed checks.
Light volume: the company's earnings filing confirms the report, but trading volume has not caught up yet, so the move is an early read.
Of the 500 largest companies, 252 have reported (55% of market cap), on day 21 of the season.
How earnings reactions split, day 21 of the seasonThe 500 largest US companies with a confirmed earnings reaction so far (218), vs the same day in the past eight seasons and in four-season stretches back to mid-2020

| Season | ≤ −5σ | −5 to −2σ | −2 to 0σ | 0 to 2σ | 2 to 5σ | ≥ 5σ |
|---|---|---|---|---|---|---|
| This season | 8% | 19% | 26% | 22% | 21% | 4% |
| Past 8 seasons | 15% | 19% | 17% | 17% | 18% | 15% |
| Q2 2026 | 12% | 22% | 18% | 13% | 20% | 15% |
| Q1 2026 | 13% | 21% | 13% | 19% | 17% | 18% |
| Q4 2025 | 17% | 16% | 22% | 13% | 17% | 14% |
| Q3 2025 | 9% | 20% | 21% | 18% | 13% | 19% |
| Q2 2025 | 19% | 23% | 15% | 15% | 15% | 14% |
| Q1 2025 | 17% | 15% | 16% | 21% | 24% | 7% |
| Q4 2024 | 16% | 14% | 18% | 22% | 17% | 13% |
| Q3 2024 | 18% | 18% | 16% | 13% | 17% | 19% |
| Q3 '23–Q2 '24 | 16% | 17% | 16% | 15% | 18% | 17% |
| Q3 '22–Q2 '23 | 12% | 20% | 18% | 18% | 21% | 12% |
| Q3 '21–Q2 '22 | 14% | 19% | 14% | 19% | 23% | 12% |
| Q3 '20–Q2 '21 | 7% | 21% | 27% | 23% | 18% | 3% |
σ: a stock's earnings-day stock-specific move divided by its typical daily stock-specific move over the past year. Each bar is cut at the same business day of the season; companies weighted by the square root of market cap.
Corporate credit spreads widened today as Treasuries rallied. The two-year yield fell 12.4 basis points to 4.61%, and the 10-year fell 9.8 basis points to 4.95% CNBC. The investment-grade bond fund LQD gained just 0.1%, when the drop in yields alone implied about 0.9%. Judging by fund prices, that puts investment-grade spreads roughly 10 basis points wider on the day, and high-yield spreads about the same. LQD traded at 1.9 times its usual volume as Microsoft's bond sale came to market. Over the past month, fund prices had shown little change in spreads. AI borrowers have been paying more all year: Morgan Stanley's Carolyn Campbell said the highest-rated data-center bonds now yield closer to 7%, up from below 5% at the start of 2026 Bloomberg. Citadel Securities warned that even the biggest tech companies could be drawn in as they commit their balance sheets to AI Bloomberg.
Indebted stocks did the opposite. Leverage rose 0.50% at z=+3.0, its best day since November 2021. That makes a second strong session against a 63-day stretch in which the most indebted names lagged (z=-2.2). The gains were concentrated in mortgage REITs and lenders whose funding costs track Treasury yields. Stocks priced cheaper Treasury funding while corporate bonds priced wider spreads.
| Bucket | Ret 1D Pct | Ret 5D Norm Pct | Ret 20D Norm Pct | Ret 63D Norm Pct |
|---|---|---|---|---|
| 1 | 0.45 | 0.80 | 1.26 | 0.71 |
| 2 | 0.77 | 0.09 | 1.02 | 0.41 |
| 3 | 0.42 | -0.01 | 0.12 | -0.18 |
| 4 | 0.62 | 0.24 | 0.41 | 0.05 |
| 5 | -0.20 | 0.58 | 0.44 | 0.30 |
| 6 | -0.28 | 0.28 | 0.06 | -0.16 |
| 7 | 0.13 | 1.01 | 0.52 | 0.48 |
| 8 | -0.91 | 0.06 | -0.53 | -0.39 |
| 9 | 0.92 | 0.29 | 0.34 | -0.08 |
| 10 | 1.48 | 0.16 | 0.41 | 0.07 |
| 11 | -0.57 | 0.15 | 0.28 | 0.30 |
| 12 | 0.20 | -0.35 | -0.34 | -0.38 |
| 13 | 0.71 | 0.38 | 0.37 | -0.22 |
| 14 | 1.25 | 0.37 | 0.72 | 0.08 |
| 15 | 1.01 | 0.52 | 0.15 | -0.42 |
| 16 | 0.83 | 0.73 | 0.43 | -0.44 |
| 17 | 1.15 | 0.74 | 0.77 | -0.27 |
| 18 | 1.04 | 0.66 | 0.88 | -0.59 |
| 19 | 0.63 | 0.65 | 0.44 | -0.91 |
| 20 | 1.19 | 1.00 | 0.19 | -1.40 |
The S&P 500 fell 0.4% and the Nasdaq-100 1.5%, while the gains in the rest of the market came from defensive and rate-sensitive stocks. XLP is up 10.3% month to date, on pace for its second-best month since 2019. XLV is up 9.4%, which would be its third-best. Eli Lilly (LLY) rose 6.6% after raising its full-year revenue guidance for the third time this year FT. Profitability rose 0.51% at z=+2.7, its strongest day since April 8. Size fell 0.90% at z=-2.6 as Alphabet and the other megacap reporters pulled the largest stocks down.
| ETF | Theme | Today (session) | 1d Ago | 5d Ago | 20d Ago | 63d Ago |
|---|---|---|---|---|---|---|
| WGMI | crypto miners | -5.3% | +4.9% | +1.1% | -27.0% | -38.0% |
| IGV | software | -3.5% | +0.1% | +2.8% | +5.1% | +19.9% |
| MTUM | momentum | -1.7% | +1.3% | +1.3% | -4.4% | +1.8% |
| QQQ | large cap growth | -1.5% | +0.6% | +0.1% | -1.9% | +6.3% |
| SPY | large cap | -0.4% | +0.3% | -0.1% | +1.3% | +4.4% |
| IWM | small cap | +0.9% | +0.4% | +1.7% | +1.2% | -3.6% |
| XLP | consumer staples | +1.5% | -0.4% | -0.3% | +7.7% | +2.3% |
| XLV | healthcare | +2.4% | +0.3% | +0.4% | +6.7% | +10.3% |
| ITB | homebuilders | +3.5% | -1.5% | +2.8% | +2.3% | -6.0% |

| Sym | Fund | Group | Today Pct | Past Year Pct | Tlt Sensitivity |
|---|---|---|---|---|---|
| ITB | Home construction | moved most with Treasuries | 3.66 | -13.40 | 1.48 |
| XHB | Homebuilders | moved most with Treasuries | 3.28 | -9.10 | 1.26 |
| XLU | Utilities | moved most with Treasuries | 1.92 | -4.60 | 0.61 |
| XBI | Biotech | moved most with Treasuries | 0.16 | 41.70 | 0.56 |
| IYR | US real estate | moved most with Treasuries | 2.69 | 1.20 | 0.53 |
| VNQ | REITs | moved most with Treasuries | 2.80 | 2.80 | 0.53 |
| XLRE | Real estate sector | moved most with Treasuries | 2.49 | 2.00 | 0.52 |
| LQD | Corporate bonds | moved most with Treasuries | 0.34 | -3.40 | 0.49 |
| XLP | Staples | moved most with Treasuries | 2.34 | 12.60 | 0.49 |
| XLV | Health care | moved most with Treasuries | 2.55 | 24.80 | 0.47 |
| QQQ | Nasdaq-100 | moved most against Treasuries | -2.53 | 16.10 | -0.17 |
| MTUM | Momentum stocks | moved most against Treasuries | -3.09 | 18.50 | -0.25 |
| XLK | Technology | moved most against Treasuries | -2.52 | 28.40 | -0.32 |
| AIPO | AI & power | moved most against Treasuries | -1.73 | 5.10 | -0.33 |
| SMH | Chips | moved most against Treasuries | -3.38 | 58.20 | -0.42 |
| BITO | Bitcoin futures | moved most against Treasuries | -1.47 | -31.20 | -0.47 |
| XLE | Energy | moved most against Treasuries | 0.93 | 59.50 | -0.60 |
| WGMI | Bitcoin miners | moved most against Treasuries | -6.64 | -46.10 | -0.60 |
| XOP | Oil producers | moved most against Treasuries | -0.07 | 59.30 | -0.90 |
| USO | Crude oil | moved most against Treasuries | 1.12 | 127.80 | -1.59 |
Our HF de-risking score puts the past 20 sessions at the 98th percentile since 2020. Over that window, 12-month winners fell and last week's moves kept going instead of reversing, a pattern consistent with a de-gross. Today on its own ranked only at the 84th percentile. The hedge-fund pain index's fall from its October 6 peak to the October 22 low is the 7th-deepest of 32 such events since 2020. It has won back about 20% of that loss, and 3 of 8 legs have confirmed a turn (beta, volatility and short-sale P&L). Yesterday's most heavily short-sold names also beat the barely shorted ones: Short-Sale Activity rose 0.29% at z=+2.7.
Background: our research note Factor Fingerprints of Hedge Fund Deleveraging Events compares October with 31 hedge-fund deleveraging events since 2020.
Today's losses were stock-specific, not marketwide. Moves in the index explained 0.2% of the day's stock-level variance. Realized correlation over 20 days is 7.3%, at the 2.0th percentile since 2020 and its lowest since September 8. Options price single-stock volatility at 40.2 (Cboe VIXEQ) against 17.2 for the index (VIX), so they expect stocks to keep moving on their own news. Amazon's and Intel's late-trading losses get their first full session on Friday.
Initial jobless claims, released at 8:30 AM ET, fell to 194,000 in the week ending Oct dol.gov 24, below the 199,000 consensus. Continuing claims dropped 21,000 to 1.701 million.
Variance decomposition: live intraday — 20261029 session, bracketed against its trailing-year range. Factor returns are trailing through last close. Total cross-sectional dispersion: 97.6%ile of the past year.
Variance mix — % of total, today vs 1d ago vs 1-yr avg
market 11%ile style 67%ile thematic 59%ile idiosyncratic 53%ile
Variance explained — today vs. factor's trailing-year range
Marker = the factor's share of today's total variance, placed in its own trailing-year range (box 25–75%ile, ticks 90%ile and max). Amber marker = unusually load-bearing today (≥90%ile of its own year). Factor name green = up today / red = down.
Correlation & dispersion — realized vs implied
Pairwise realized correlation (20d): 7.27% 2.0%ile since 2020 · 9.5%ile 3m most extreme since 2026-09-08
Top-500 pairwise: 10.21% 8.8%ile since 2020 · 36%ile 3m · implied (Cboe COR1M): 10.24 4.7%ile since 2006 (gap -0.0pp)
Realized 20d vol (ann. pts): all stocks 44 vs VIXEQ 40 · index 10 vs VIX 17 · style factors 24 86%ile
20-day window (19 completed days + today); percentiles vs model history since 2020; '3m' tokens rank vs the trailing 63 trading days; definitions in Terms below. Implied prints (Cboe) are delayed ~15 min. as of 16:21 ET
Top 50 high-beta momentum names (eq-wt, since-2020 rank): -5.3% 4.0%ile · rest of market +1.3%
HF de-risking score (since-2020 rank): 84%ile today · 55%ile 5-day · HF pain index 7.5σ below peak (7th-deepest of 32 since 2020), 20% won back · covering plus selling
| Factor | Today | 1d | 5d | 20d | 60d |
|---|---|---|---|---|---|
| Style-Risk | |||||
| Beta | -1.82% z-1.9 | +1.09% | +2.51% | -9.50% | -6.79% |
| Residual Volatility | -0.68% z-1.4 | +0.35% | -0.52% | -0.85% | +2.65% |
| International | -0.32% z-1.1 | +0.06% | -0.92% | -0.94% | -0.32% |
| Style | |||||
| Leverage | +0.50% z+3.0 | +0.26% | +0.95% | +0.25% | -2.38% |
| Profitability | +0.51% z+2.7 | -0.08% | -0.15% | +0.93% | +0.02% |
| Size | -0.90% z-2.6 | +0.03% | -0.97% | -0.77% | +1.92% |
| Dividend Yield | +0.20% z+1.1 | -0.06% | +0.71% | -0.06% | +0.58% |
| Liquidity | -0.21% z-0.8 | +0.17% | -0.38% | -0.73% | +2.10% |
| Value | -0.15% z-0.7 | +0.22% | -0.46% | -0.52% | -0.43% |
| Growth | -0.11% z-0.4 | +0.10% | -0.23% | -0.51% | -0.18% |
| Style-Momentum | |||||
| Long-Term Momentum | -0.64% z-1.0 | +0.28% | +0.92% | -2.93% | +0.65% |
| One-Day Momentum | +0.19% z+0.7 | +0.07% | +0.00% | -0.13% | -3.42% |
| Short-Term Momentum | +0.16% z+0.5 | +0.06% | -0.02% | +2.81% | +0.76% |
| Medium-Term Momentum | +0.10% z+0.3 | -0.32% | -1.67% | -1.41% | -1.74% |
| Style-Positioning | |||||
| Short Interest | -0.12% z-0.7 | -0.10% | -0.40% | +0.20% | -1.03% |
| Hedge-Fund Ownership | +0.08% z+0.7 | -0.06% | -0.24% | -0.28% | -0.61% |
| Style-Flow | |||||
| Short-Sale Activity | +0.29% z+2.7 | -0.10% | -0.01% | +0.34% | +0.88% |
| Morning Activity | -0.09% z-0.7 | -0.05% | -0.03% | -0.41% | +0.27% |
| Thematic | |||||
| Bitcoin / Crypto | -1.18% z-3.9 | -0.11% | -1.83% | -1.40% | +1.26% |
| Oil | -0.71% z-1.5 | +0.12% | +0.51% | -0.55% | +4.77% |
| Treasury (Duration) | +0.42% z+1.3 | +0.17% | +0.23% | +1.52% | -1.59% |
| China | -0.43% z-1.1 | +0.18% | -0.79% | -1.18% | -0.44% |
| Semiconductors | -0.22% z-0.4 | +0.59% | +2.16% | -3.55% | -1.79% |
| Gold | -0.01% z-0.0 | +0.23% | +0.08% | -0.77% | +1.68% |
5/20/60d windows include today's session; 1d is the previous session.
Factor z-score. Today's factor return divided by its daily-return standard deviation over ~1,600 trading days.
High-beta momentum cohort. US names above $2B market cap in the top quintile of both raw beta and 12-month momentum; membership frozen at each month's first business day. “Top 50” = the 50 strongest by combined rank.
HF de-risking score. A FactorPulse measure of de-risking in factor returns: the average of four legs, each in its own daily-volatility units and counted only when it moves in the de-risking direction. They are the most-shorted names rising, 12-month momentum winners falling, names crowded in hedge-fund 13F filings falling net of their beta and momentum, and last week's relative moves continuing instead of reverting (counted only alongside another leg). A leg counts as firing at half its daily volatility or more, so a leg can show a small value without firing. Types: A, covering and selling together; B, selling only; C, covering only. Ranked against every session since January 2020. It reads factor returns only, never positions.
Stock-specific (idiosyncratic) return. The part of a stock's move not explained by the market, style or thematic (industry and theme) factors in the FactorPulse risk model.
VIXEQ / DSPX / COR1M. Cboe implied indices: single-stock volatility, dispersion, and 1-month implied correlation (top-50 S&P names). Quotes delayed ~15 minutes.
Data compiled by FactorPulse AI; edited and verified by Jeff Klein. For informational purposes only. Does not constitute financial advice, an investment recommendation, or an offer to buy or sell any securities. Always consult a qualified financial professional before making investment decisions.
For more on factor construction methodology, see www.factorpulse.com/glossary.