Negative Skew in Earnings Continues; Alphabet and ServiceNow Down After Hours
Macro: The Fed held rates in a 10-2 vote, with two officials dissenting for a hike. The two-year yield fell 5 basis points and the 10-year rose to 5.01%, steepening the curve.
Market Moves: The S&P 500 and the Russell 2000 each closed up 0.3%. Memory-chip and South Korea funds rebounded with SK hynix's record quarter, DRAM up 7.0%. Utilities and homebuilders lagged as long yields rose, with ITBdown 1.6%.
Factors: Factors explained less of the day than usual: style took 4% of stock-level variance, against a 23% one-year average. Stock-specific moves took 91%. Leverage hit z=+2.6, mostly because net-cash names fell, against a three-month slide in indebted stocks.
Micro:Alphabetfell 9.2% in late trading on a mixed quarter: Google Cloud revenue doubled, while revenue and profit fell short of estimates. ServiceNowfell 14.7% late on its sales outlook. Microsoftrose 2.2% late as Azure grew 48% and free cash flow beat estimates. Oracle closed up 10.7% after capping outside funding.
Watch: Will Eli Lilly, Mastercard and Merck, reporting before Thursday's open, break a season in which big earnings drops have outnumbered big gains?
October 28, 2026 · 4:58 PM ET · Updated 17:30 ET
Earnings reactions have leaned negative all season, and Wednesday's late reports added to the tilt. Weighted by size, more companies have fallen sharply on their results than have risen sharply, though both shares are below any of the past eight seasons. After the close, cybersecurity firm Fortinetfell 23% even though its results beat estimates, and rivals Palo Alto Networks and CrowdStrike each fell 6%. Workplace-software maker ServiceNowfell 15% on a sales outlook that revived fears about AI. Alphabet, Google's parent, fell 9% on a mixed quarter: Google Cloud revenue doubled, but revenue, profit and advertising sales all fell short of estimates. Earlier in the day Google released Gemini 4 Carbon, its newest AI model, with access limited for now. Microsoft was the exception, rising 2% as its Azure cloud business grew 48% and free cash flow of about $19 billion came in at more than twice what analysts expected.
The regular session had favored AI infrastructure. Database company Oracle closed up 11% after capping new stock and debt sales at $20 billion through fiscal 2030 at its investor day, easing worries about its borrowing as financing for AI data centers grows more expensive; it gave back 3% in late trading. South Korean memory-chip maker SK hynixrose 13% on a record quarter driven by AI demand, lifting the memory-chip fund DRAM 7% and the South Korea fund EWY 5%, though both are still down 16% to 18% over the past month. Vertiv, another AI supplier, rose 17% after its orders doubled and it raised its full-year outlook.
The Federal Reserve held rates at 3.75% to 4% in a 10-2 vote, with Governor Lisa Cook and Cleveland Fed President Beth Hammack dissenting in favor of a hike. Chair Kevin Warsh said financial conditions have tightened but that he is "unwilling and unable to call them tight." The two-year Treasury yield fell 5 basis points to about 4.69%, while the 10-year rose to 5.01%. The S&P 500 closed up 0.3%, but stocks sensitive to long-term rates lagged: the utilities fund XLUfell 0.9%, the homebuilder fund ITBfell 1.6% and the long-term Treasury fund TLTfell 0.8%.
Alphabet, ServiceNow and Fortinet Fell After Hours; Microsoft Rose 2%
Alphabet closed the regular session up 1.3%, then fell 9.2% in late trading after a mixed third-quarter report. Google Cloud revenue rose 103% to $30.71 billion. SEC filing Revenue and profit fell short of estimates, Bloomberg reported. Bloomberg Capital spending was $51.36 billion and quarterly free cash flow was negative $9.07 billion. SEC filing
Advertising revenue also missed estimates, the Wall Street Journal reported. The Wall Street Journal Search and other revenue rose 12%. Diluted EPS of $2.12 included an $8.66 billion loss on equity securities, which cut $0.55 from the figure. SEC filing Earlier on Wednesday, Google released Gemini 4 Carbon, its newest AI model, which VentureBeat reported took the top spot on updated industry benchmarks; access is limited for now to vetted cybersecurity users. VentureBeat
Microsoft closed down 0.2% and rose 2.2% in late trading. Azure revenue grew 48% to $33.17 billion. The Wall Street Journal Free cash flow was about $18.6 billion, against the $8.54 billion analysts expected. Capital spending including finance leases was $45.2 billion, below the roughly $50 billion Microsoft had projected, according to Reuters.
Software reports fared worse. ServiceNow (NOW) closed down 3.4%, then fell another 14.7% in late trading after its quarterly sales outlook revived fears about AI. Bloomberg The drop came even though it raised its full-year AI contract-value target to $1.7 billion, according to its release on Business Wire. Fortinet (FTNT) closed down 6.0%, then fell another 23.2% late after third-quarter results that beat estimates, according to Benzinga. In late trading, Palo Alto Networks (PANW) fell 5.9% and CrowdStrike (CRWD) fell 6.2%. Earnings reactions have tilted to the downside all season, within a smaller range than usual: more big drops than big gains, and fewer of both than at this point in any of the past eight seasons. Many of this season's reactions are still provisional.
Earnings reactions in the regular sessionReporters worth over $100 billion, or moving more than 10% with a value above $5 billion
Reported after the close, as of 16:49 ETLate trading from the 4 PM close; same size rule
Company
Move
Market-adjusted
Market cap
Revenue YoY
Margin YoY
What drove it
Fortinet FTNT
-23.2%
-22.9%
$136B
+20%
+1.3 pts adj. operating
—
ServiceNow NOW
-14.7%
-14.7%
$160B
+21%
-0.9 pts adj. operating
Sales outlook revived AI fears
Alphabet GOOGL
-9.2%
-8.8%
$3.9T
+25%
+1.3 pts operating
Cloud doubled; revenue and profit missed estimates
T-Mobile US TMUS
+0.9%
+0.8%
$158B
+7%
+3.4 pts operating
—
Microsoft MSFT
+2.2%
+2.5%
$3.9T
+19%
+0.9 pts operating
Azure up 48%; free cash flow beat
KLA KLAC
+2.7%
+3.4%
$200B
+29%
+3.4 pts operating
—
Carvana CVNA
+10.8%
+11.2%
$65B
+42%
-0.9 pts operating
—
Stock-specific: the part of a stock's move not explained by the market, style or thematic (industry and theme) factors in the FactorPulse risk model.
After the close: moves trade on a fraction of a normal session's volume, so each is an early read. Market-adjusted: the move minus the stock's beta times the S&P 500's late-trading move.
Revenue and margin from the company's earnings release, year over year; margin change in percentage points; — where the release is not parsed or the figures failed checks.
Light volume: the company's earnings filing confirms the report, but trading volume has not caught up yet, so the move is an early read.
Of the 500 largest companies, 191 have reported (43% of market cap), on day 20 of the season.
How earnings reactions split, day 20 of the seasonThe 500 largest US companies with a confirmed earnings reaction so far (166), vs the same day in the past eight seasons and in four-season stretches back to mid-2020
Weighted by size, 22% of this season's reporters rose 2σ or more on a stock-specific basis, against 33% at this point in the past eight seasons; 26% fell 2σ or more (past: 34%).
Earnings reactions this season vs the past eight seasons, day 20
Season
≤ −5σ
−5 to −2σ
−2 to 0σ
0 to 2σ
2 to 5σ
≥ 5σ
This season
5%
22%
31%
21%
18%
4%
Past 8 seasons
15%
19%
17%
16%
18%
14%
Q2 2026
11%
24%
17%
15%
19%
14%
Q1 2026
12%
19%
14%
19%
20%
16%
Q4 2025
17%
15%
23%
13%
17%
15%
Q3 2025
8%
22%
20%
18%
13%
19%
Q2 2025
17%
25%
14%
14%
17%
13%
Q1 2025
19%
15%
17%
19%
25%
7%
Q4 2024
16%
14%
19%
22%
17%
13%
Q3 2024
19%
16%
15%
12%
19%
19%
Q3 '23–Q2 '24
15%
18%
15%
15%
18%
18%
Q3 '22–Q2 '23
12%
20%
18%
17%
21%
12%
Q3 '21–Q2 '22
14%
18%
14%
19%
23%
11%
Q3 '20–Q2 '21
6%
23%
27%
21%
19%
4%
σ: a stock's earnings-day stock-specific move divided by its typical daily stock-specific move over the past year. Each bar is cut at the same business day of the season; companies weighted by the square root of market cap.
Oracle Closed Up 11% After Capping Its Outside Funding
Oracle closed the session up 10.7% after its Investor Day capped new capital-markets raises through fiscal 2030 at $20 billion, split evenly between equity and debt. The cap comes as AI borrowing gets harder: Bloomberg reported that 18 data-center financings now yield more than 10% in the junk-bond and leveraged-loan markets. Bloomberg Oracle shares gave back 3.2% in late trading.
Indebted Stocks Outperformed, Against a Three-Month Slide
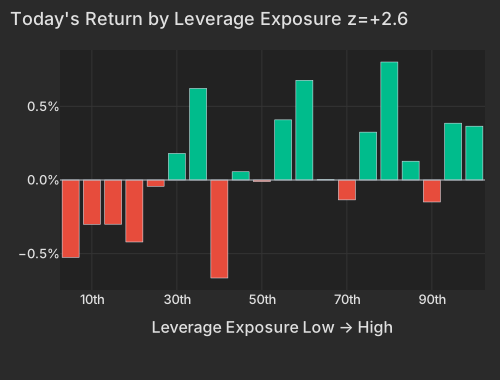
Style factors explained 4% of stock-level variance today, against a 23% one-year average. Stock-specific moves explained 91%, the 99th percentile of the past year. The one style move that stood out was Leverage: the most indebted companies beat net-cash balance sheets, with the factor at +0.44% and z=+2.6. That return is near the 99th percentile since 2020. It runs against the three-month trend, in which indebted names lost 2.93% over 60 sessions (63-day z=-2.7). Over the past five sessions they have gained 0.78%.
Most of the spread came from cash-rich names falling, not from indebted names rising. F5 (FFIV), whose balance sheet is net cash, closed down 20.6% on its outlook. Cheaper money did not drive the move. The 10-year yield rose, and LQD fell 0.3% in the session, slightly more than the yield move explains. Corporate credit showed no matching move.
The lowest-leverage bucket, the strongest net-cash balance sheets, fell 0.5%. That end produced most of the z=+2.6 spread.
Today's Return by Leverage Exposure z=+2.6
Bucket
Avg Ret Pct
1
-0.53
2
-0.30
3
-0.30
4
-0.42
5
-0.04
6
0.18
7
0.62
8
-0.67
9
0.06
10
-0.01
11
0.41
12
0.68
13
0.00
14
-0.14
15
0.33
16
0.80
17
0.13
18
-0.15
19
0.39
20
0.37
Factor
Return
Z-Score
5d Z
20d Z
63d Z
Category
Direction
Leverage
+0.44%
+2.6
+2.1
-0.4
-2.7
Style
Indebted names beat net-cash names, against the three-month trend
Bitcoin / Crypto
-0.68%
-2.2
-1.2
-0.5
+0.5
Thematic
Crypto brokers and exchanges lagged while bitcoin rose
Gold
+0.59%
+1.9
-0.8
-0.7
+0.8
Thematic
Gold-exposed names outperformed
Medium-Term Momentum
-0.44%
-1.6
-2.9
-1.3
-0.9
Style-Momentum
Last month's winners lagged again
Short-Sale Activity
-0.16%
-1.5
-1.1
+0.0
+0.9
Style-Flow
Yesterday's heavily short-sold names lagged
Semiconductors
+0.77%
+1.3
+0.6
-1.0
-0.6
Thematic
Chip-exposed names outperformed
Short Interest
-0.18%
-1.1
+0.6
+0.1
-0.7
Style-Positioning
Most-shorted names lagged
Residual Volatility
+0.03%
+0.1
-0.3
-0.1
+1.0
Style-Risk
Flat
Among thematic factors, Bitcoin / Crypto fell 0.68% at z=-2.2, even as bitcoin rose 0.5% to $81,045 at 4:51 PM ET. CNBC The weak spot was crypto brokers, led by Robinhood (HOOD), which closed down 3.5% after its results. The bitcoin-miner fund WGMI rose 4.8%.
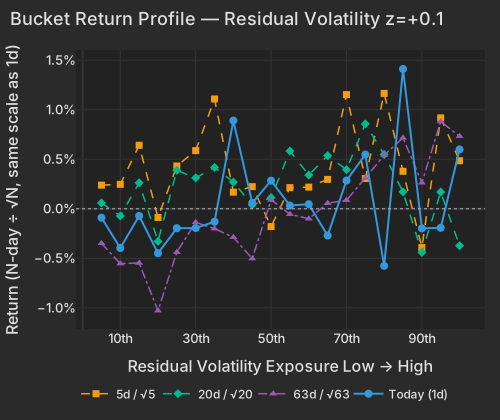
Options prices assume stocks will keep moving on their own news. Implied single-stock volatility (Cboe VIXEQ) is 41.8, at the top of its 20-session range. The VIX is 16.91, down 15% from its October 16 high of 19.99. Implied correlation among the 50 largest S&P 500 stocks (Cboe COR1M) is 8.73, in the lowest 3% of readings since 2006. Over the past 60 sessions the most volatile names have led, with Residual Volatility up 2.45%. Today that factor was flat.
Over 63 days, higher residual volatility lined up closely with higher returns (rank correlation 0.92). Today the link was loose (0.29).
The Hedge-Fund Pain Index Has Won Back a Quarter of Its Loss
The hedge-fund pain index has won back about 26% of its loss since the October 22 low. Three of its seven legs have confirmed a turn: beta, volatility and, as of today, short-sale P&L. Goldman Sachs Prime Brokerage data reported October 26 showed about $20 billion of net technology selling in the two weeks through October 23. Our HF de-risking score's 20-day window is at the 97th percentile since 2020, consistent with a de-gross. Today's one-day reading was unremarkable, with none of the score's legs active.
The 12-month momentum leg has not turned, and 20-day momentum (Medium-Term Momentum in the table) fell 0.44% at z=-1.6 today and lost 1.89% over the five sessions. Last month's winners are not being bought back. In seven earlier deep drawdowns, rallies that won back 46% to 71% of the loss still gave way to a fresh low.
The pain index has won back 26% of its fall from the October 6 peak to the October 22 low so far, the 7th-deepest of 32 drawdowns since 2020.
HF pain index: how much of the loss is back
date
sigma_vs_peak
20260924
-1.05
20260925
-0.397
20260928
-0.967
20260929
-0.517
20260930
-0.983
20261001
-0.37
20261002
-0.03
20261005
-0.465
20261006
0.0
20261007
-0.183
20261008
-0.856
20261009
-0.616
20261012
-1.467
20261013
-1.458
20261014
-2.818
20261015
-4.072
20261016
-4.858
20261019
-4.554
20261020
-5.447
20261021
-4.862
20261022
-9.418
20261023
-9.291
20261026
-8.571
20261027
-7.572
20261028
-6.97
Two-Year Yield Fell 5 Basis Points on the Fed's Split Hold
The FOMC held its target range at 3.75%–4% in a 10-2 vote. Governor Lisa Cook and Cleveland Fed President Beth Hammack dissented in favor of a hike. NBC News Chair Kevin Warsh said financial conditions have tightened but that he is "unwilling and unable to call them tight." Yahoo Finance The two-year Treasury yield fell 5.0 basis points to 4.687%. CNBC The 10-year rose 1.8 basis points to 5.011%, and the 30-year rose 3.1 basis points to 5.336%. CNBC The S&P 500 closed up 0.3% and was little changed after the close.
ETF
Theme
Today
1d Ago
5d Ago
20d Ago
63d Ago
DRAM
memory chips
+7.0%
+4.5%
+5.9%
-17.6%
+12.6%
EWY
South Korea
+5.4%
+3.1%
+2.3%
-15.8%
+9.2%
WGMI
crypto miners
+4.8%
+7.9%
-1.0%
-32.3%
-27.8%
AIPO
AI power infrastructure
+2.5%
+3.6%
-0.4%
-11.2%
-3.6%
SMH
semiconductors
+1.7%
+3.0%
+2.1%
-8.1%
+10.7%
SPY
large cap
+0.3%
+0.6%
+0.1%
+0.7%
+5.8%
TLT
long-term bonds
-0.8%
-0.1%
+1.9%
+4.8%
-0.3%
XLU
utilities
-0.9%
+0.7%
+2.3%
+7.9%
-3.9%
ITB
homebuilders
-1.6%
+0.5%
+3.5%
+2.2%
-5.7%
Utilities, long Treasuries and homebuilders lagged as long-term yields rose.
Economic Context
The FOMC decision, released at 2:00 PM ET, left the federal funds target at 3.75%–4.00%. Treasury yields moved in opposite directions afterward: short-term rates eased while long-dated bonds sold off. The Wall Street Journal
Factor Regime Reference
Variance decomposition: live intraday — 20261028 session, bracketed against its trailing-year range. Factor returns are trailing through last close. Total cross-sectional dispersion: 81%ile of the past year.
Variance mix — % of total, today vs 1d ago vs 1-yr avg
Variance explained — today vs. factor's trailing-year range
Marker = the factor's share of today's total variance, placed in its own trailing-year range (box 25–75%ile, ticks 90%ile and max). Amber marker = unusually load-bearing today (≥90%ile of its own year). Factor name green = up today / red = down.
Correlation & dispersion — realized vs implied
Pairwise realized correlation (20d): 7.74%3.0%ilesince 2020 ·19%ile3mmost extreme since 2026-09-08
Realized 20d vol (ann. pts): all stocks 42 vs VIXEQ 42 · index 10 vs VIX 17 · style factors 2385%ile
20-day window (19 completed days + today); percentiles vs model history since 2020; '3m' tokens rank vs the trailing 63 trading days; definitions in Terms below. Implied prints (Cboe) are delayed ~15 min. as of 16:41 ET
Top 50 high-beta momentum names (eq-wt, since-2020 rank): +1.9%74%ile · rest of market -0.4%
HF de-risking score (since-2020 rank): 26%ile today · 91.9%ile 5-day · HF pain index 7.0σ below peak (7th-deepest of 32 since 2020), 26% won back
Trailing factor returns
Factor
Today
1d
5d
20d
60d
Style-Risk
Beta
+0.29%z+0.3
+2.29%
-0.25%
-8.18%
-6.12%
International
+0.06%z+0.2
-0.18%
-0.94%
-1.08%
+0.14%
Residual Volatility
+0.02%z+0.0
-0.02%
-0.31%
-0.22%
+2.45%
Style
Leverage
+0.44%z+2.7
+0.27%
+0.78%
-0.28%
-2.93%
Value
+0.24%z+1.0
-0.11%
-0.27%
+0.14%
-0.54%
Size
-0.30%z-0.9
-0.33%
-1.00%
-0.39%
+2.63%
Profitability
+0.11%z+0.6
-0.22%
-0.20%
+0.94%
-0.34%
Dividend Yield
+0.07%z+0.4
+0.15%
+0.80%
-0.03%
+0.42%
Growth
-0.08%z-0.3
-0.18%
-0.46%
-0.37%
+0.07%
Liquidity
+0.01%z+0.0
+0.21%
-0.03%
-0.62%
+1.73%
Style-Momentum
Medium-Term Momentum
-0.44%z-1.6
-0.66%
-1.89%
-1.66%
-1.62%
Short-Term Momentum
-0.19%z-0.6
-0.27%
+0.70%
+2.20%
-0.43%
One-Day Momentum
+0.17%z+0.6
-0.04%
-0.41%
+0.05%
-3.82%
Long-Term Momentum
+0.15%z+0.2
+0.17%
-0.38%
-2.13%
+0.64%
Style-Positioning
Short Interest
-0.18%z-1.1
-0.07%
+0.23%
+0.05%
-1.09%
Hedge-Fund Ownership
+0.03%z+0.3
-0.05%
-0.27%
-0.45%
-0.48%
Style-Flow
Short-Sale Activity
-0.15%z-1.4
-0.12%
-0.27%
+0.01%
+0.48%
Morning Activity
-0.08%z-0.6
+0.09%
-0.02%
-0.62%
+0.56%
Thematic
Bitcoin / Crypto
-0.68%z-2.2
-0.43%
-0.81%
-0.74%
+1.76%
Gold
+0.59%z+1.9
+0.30%
-0.56%
-0.97%
+2.72%
Semiconductors
+0.78%z+1.3
+0.43%
+0.85%
-2.78%
-2.21%
Treasury (Duration)
+0.24%z+0.7
+0.02%
+1.06%
+0.86%
-1.62%
Oil
-0.18%z-0.4
-0.17%
+0.04%
+0.12%
+4.74%
China
-0.00%z-0.0
+0.07%
-0.65%
-1.04%
-0.47%
5/20/60d windows include today's session; 1d is the previous session.
Terms
Pairwise realized correlation.Index variance net of the weighted idiosyncratic diagonal, over the cross terms — the estimator used for implied-correlation indices. 20-day window unless noted; history since 2020.
Market variance share.The fraction of cross-sectional variance explained by the market factor — the attribution companion to pairwise correlation, not a substitute for it.
Factor z-score.Today's factor return divided by its daily-return standard deviation over ~1,600 trading days.
Conditional importance.A factor's relative share of what a tree-based fit of today's stock returns explains; sums to 100% across factors.
High-beta momentum cohort.US names above $2B market cap in the top quintile of both raw beta and 12-month momentum; membership frozen at each month's first business day. “Top 50” = the 50 strongest by combined rank.
HF de-risking score.A FactorPulse measure of de-risking in factor returns: the average of four legs, each in its own daily-volatility units and counted only when it moves in the de-risking direction. They are the most-shorted names rising, 12-month momentum winners falling, names crowded in hedge-fund 13F filings falling net of their beta and momentum, and last week's relative moves continuing instead of reverting (counted only alongside another leg). A leg counts as firing at half its daily volatility or more, so a leg can show a small value without firing. Types: A, covering and selling together; B, selling only; C, covering only. Ranked against every session since January 2020. It reads factor returns only, never positions.
Dispersion (realized).Total cross-sectional volatility net of the market component; high dispersion is the flip side of low correlation.
Stock-specific (idiosyncratic) return.The part of a stock's move not explained by the market, style or thematic (industry and theme) factors in the FactorPulse risk model.
Data compiled by FactorPulse AI; edited and verified by Jeff Klein. For informational purposes only. Does not constitute financial advice, an investment recommendation, or an offer to buy or sell any securities. Always consult a qualified financial professional before making investment decisions.