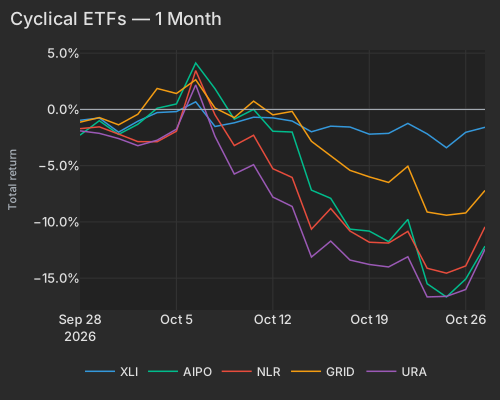
Anthropic's filing to go public on the Nasdaq and Meta's upsized $37.5 billion stock sale sent chip and AI-hardware stocks sharply higher Tuesday, as investors bet the money will flow straight into data-center budgets. Meta, one of the biggest AI spenders, priced its new shares at $625 apiece. Chipmaker Nvidia committed $3 billion to the deal and joined AMD and Broadcom in signaling interest in up to $5 billion of the stock. AI company Anthropic's filing showed first-half revenue up 1,300% to more than $16 billion, along with hundreds of billions of dollars in long-term computing commitments. AMD rose about 5%, Broadcom 4% and Taiwan Semiconductor 3%. The semiconductor fund SMH gained about 3%, and crypto miners that also host AI computing rose about 7%. By mid-afternoon the Nasdaq-100 was up 1.3% and the S&P 500 0.6%.
Investors paid for the rally by selling the past month's safe havens. Walmart and Costco fell about 1%, and energy giant Exxon Mobil dropped more than 2% as U.S. crude slipped to just under $100 a barrel. A basket of 50 high-flying, high-beta stocks jumped about 6%, one of its 30 best days since 2020. That still won back only part of a steep October slide, during which Goldman Sachs reported the heaviest pullback from individual stocks since late July, including about $20 billion of tech selling. For more in-depth coverage, see our research note Factor Fingerprints of Hedge Fund Deleveraging Events. Planemaker Boeing sank 10%, wiping out about $15 billion of market value. It posted a wider-than-expected quarterly loss, dropped its 2026 delivery goal for the 737 Max and pushed a production ramp-up to late 2027. It also moved its $10 billion-a-year cash-flow target out to 2029. United Parcel Service rose about 5% after raising its full-year revenue outlook. Uniform suppliers Cintas and UniFirst fell 5% and 12% on reports that the Federal Trade Commission plans to sue to block their $5.5 billion merger.
The Federal Reserve opened a two-day meeting, and futures put the odds of rates staying at 3.75% to 4% when it announces its decision Wednesday afternoon at about 90%. Consumers sounded more upbeat: the consumer confidence index jumped to about 92 in October from 84 in September, well above the 81 economists expected, on easing gasoline prices and brighter views of the job market. Earnings season has been stingy so far, with a smaller share of companies getting outsize lifts from their results than at this point in any of the past eight seasons. Next up is cloud giant Microsoft, down 0.2% ahead of its Wednesday report. Investors will be watching whether the biggest AI spenders can cover their building plans out of cash flow without selling more stock.
| Factor | Return | Z-Score | 5d Z | 20d Z | 63d Z | Category | Direction |
|---|---|---|---|---|---|---|---|
| Beta | +2.33% | z=+2.4 | +0.3 | -1.9 | +0.2 | Style-Risk | Reversal up vs 20d |
| Medium-Term Momentum | -0.65% | z=-2.3 | -1.8 | -1.1 | -0.8 | Style-Momentum | 1-month winners lagging |
| Profitability | -0.31% | z=-1.6 | -1.1 | +0.7 | -0.6 | Style | Unprofitable names leading |
| Leverage | +0.24% | z=+1.4 | +0.8 | -1.4 | -3.2 | Style | Reversal up vs 63d |
| Short-Sale Activity | -0.12% | z=-1.1 | -0.1 | +0.2 | +0.9 | Style-Flow | Barely-shorted leading |
| Bitcoin / Crypto | -0.33% | z=-1.1 | +0.4 | +0.2 | +1.0 | Thematic | Low-crypto-beta leading |
The largest AI spenders are turning to equity issuance rather than debt to finance data-center construction, locking in multi-year hardware budgets while shifting the cost of capital onto shareholders through dilution MarketWatch. Meta Platforms priced an upsized $25.0 billion Class A common stock forward offering at $625.00 per share alongside $12.5 billion of 6.50% mandatory convertible preferred shares (ticker METAM), with an at-the-market program of up to $60 billion in non-voting Class C shares planned for early 2027 to support its $135 billion to $145 billion 2026 capital expenditure plan MarketWatch. Chipmakers are directly funding their customer: Nvidia (NVDA) committed $3.0 billion to Meta's equity raise alongside an expanded Vera Rubin integration for Meta's Muse models, and joined Advanced Micro Devices (AMD) and Broadcom (AVGO) in indicating interest for up to $5.0 billion of the stock MarketWatch. Nvidia's five-year credit default swap spread stood at 127 basis points on Tuesday, up from 39 basis points at the end of 2025 AOL.
Anthropic PBC reinforced the hardware demand trajectory by filing its Form S-1 for a Nasdaq listing under ticker ANT and preparing a retail offer in Australia NYT Bloomberg. Anthropic reported that first-half 2026 revenue surged 1,300% year-over-year to $16.29 billion and second-quarter operating profit reached $974 million, though a $72.4 billion mark-to-market charge on convertible notes drove an $80.7 billion net loss NYT. Crucially for chip and power suppliers, the filing detailed hundreds of billions of dollars in long-term compute commitments, including dedicated Nvidia Vera Rubin NVL72 clusters NYT, while SK Hynix subsidiary Solidigm proposed a $45 billion US flash-memory plant contingent on federal clearance to upgrade its Dalian, China facility Bloomberg.
Equity buyers rewarded the hardware and power complex while leaving software spenders behind. Broadcom rose 4.1% (adding $66.6B of market value, split between +2.0% stock-specific and +1.6% from style exposures), Taiwan Semiconductor (TSM) gained 3.1% (adding $68.6B), and AMD climbed 5.4% (adding $48.5B, with +4.3% carried by style tilts). High-beta AI cloud operators Nebius Group (NBIS +11.4%) and CoreWeave (CRWV +8.4%) and fuel-cell supplier Bloom Energy (BE +7.8%) advanced primarily on their Beta exposures, while miners hosting AI computing—led by Galaxy Digital (GLXY +8.8%), Cipher Mining (CIFR +8.2%), and Hut 8 (HUT +7.4%)—drove a +6.8% median gain across the AI-hosting miner group even as the orthogonal Bitcoin / Crypto factor slipped 0.33% (z=-1.1) on strength in low-crypto-beta semiconductors. By contrast, Microsoft (MSFT) edged down 0.2% ahead of Wednesday's earnings report, where investors will test whether hyperscaler free cash flow can cover capital spending without equity dilution.
| ETF | Theme | Today | 1d Ago | 5d Ago | 20d Ago | 63d Ago |
|---|---|---|---|---|---|---|
| WGMI | crypto miners | +7.7% | -0.3% | -8.2% | -37.4% | -41.2% |
| DRAM | memory chips & storage | +4.7% | +2.7% | +0.0% | -19.1% | +1.2% |
| URA | uranium | +4.2% | +0.7% | -2.6% | -14.4% | -11.8% |
| AIPO | AI power infrastructure | +3.6% | +1.9% | -4.8% | -13.1% | -12.1% |
| SMH | semiconductors | +2.9% | +2.7% | -1.3% | -9.7% | +2.3% |
| IGV | software | +0.5% | +0.7% | +5.1% | +5.7% | +21.4% |
| XLP | consumer staples | -0.9% | -0.3% | +0.9% | +6.9% | +1.7% |
| XLRE | real estate | -1.2% | +0.5% | +2.7% | +3.5% | -6.2% |
| XLE | energy | -2.0% | +0.5% | +2.7% | +12.1% | +21.7% |
| XOP | oil exploration & production | -2.5% | +1.6% | +2.7% | +13.7% | +23.6% |
The rebound extended across nuclear and power-grid funds that had suffered steep 20-day drawdowns through Monday's close, with the uranium ETF (URA +4.2%) and nuclear power ETF (NLR +4.0%) rallying.
| T | XLI | AIPO | NLR | GRID | URA |
|---|---|---|---|---|---|
| 2026-09-28 | -0.97 | -2.29 | -1.71 | -1.14 | -1.91 |
| 2026-09-29 | -0.76 | -1.01 | -1.55 | -0.72 | -2.13 |
| 2026-09-30 | -2.02 | -2.22 | -2.19 | -1.37 | -2.59 |
| 2026-10-01 | -1.05 | -1.32 | -2.86 | -0.43 | -3.23 |
| 2026-10-02 | -0.28 | 0.10 | -2.87 | 1.86 | -2.74 |
| 2026-10-05 | -0.19 | 0.49 | -1.94 | 1.41 | -1.76 |
| 2026-10-06 | 0.67 | 4.13 | 3.45 | 2.64 | 2.18 |
| 2026-10-07 | -1.52 | 1.84 | -0.48 | 0.12 | -2.40 |
| 2026-10-08 | -1.19 | -0.87 | -3.21 | -0.73 | -5.74 |
| 2026-10-09 | -0.69 | -0.00 | -2.30 | 0.74 | -4.91 |
| 2026-10-12 | -0.75 | -1.94 | -5.28 | -0.48 | -7.80 |
| 2026-10-13 | -1.03 | -2.01 | -6.05 | -0.18 | -8.63 |
| 2026-10-14 | -1.99 | -7.18 | -10.64 | -2.83 | -13.13 |
| 2026-10-15 | -1.49 | -7.91 | -8.81 | -4.15 | -11.71 |
| 2026-10-16 | -1.57 | -10.64 | -10.81 | -5.42 | -13.40 |
| 2026-10-19 | -2.20 | -10.82 | -11.81 | -6.00 | -13.79 |
| 2026-10-20 | -2.13 | -11.75 | -11.88 | -6.49 | -14.01 |
| 2026-10-21 | -1.24 | -9.78 | -10.84 | -5.05 | -13.10 |
| 2026-10-22 | -2.17 | -15.50 | -14.12 | -9.12 | -16.67 |
| 2026-10-23 | -3.41 | -16.68 | -14.56 | -9.41 | -16.62 |
| 2026-10-26 | -2.04 | -15.08 | -13.92 | -9.21 | -16.01 |
| 2026-10-27 | -1.59 | -12.16 | -10.44 | -7.20 | -12.43 |
Earnings reactions so far todayReporters worth over $100 billion, or moving more than 10% with a value above $5 billion
| Company | Move | Stock-specific | Market cap | Revenue YoY | Margin YoY | What drove it |
|---|---|---|---|---|---|---|
| Xylem XYL | -13.5% | -12.9% | $25B | -3% | +0.5 pts adj. operating | Q3 revenue miss and cut FY26 EPS guidance |
| Boeing BA | -10.2% | -11.6% | $149B | +4% | +22.5 pts adj. operating | Cut 2026 737 delivery target; delayed FCF goal Financial Times |
| Welltower WELL | -6.0% | -5.3% | $173B | +38% | -1.8 pts operating | Q3 GAAP EPS miss despite FFO beat |
| HSBC HSBC | -5.3% | -6.5% | $312B | — | — | Q3 revenue and EPS missed consensus estimates Bloomberg |
| HCA Healthcare HCA | -4.9% | -3.9% | $101B | +4% | -0.7 pts pre-tax | — |
| Coca-Cola KO | -1.3% light volume | -0.3% | $399B | +7% | +1.1 pts adj. operating | Flat North American volume and 2027 refranchising headwinds |
| Corning GLW | -0.7% | -6.2% | $110B | +18% | +2.8 pts adj. pre-tax | — |
| S&P Global SPGI | +0.03% light volume | +1.3% | $133B | +7%† | +0.6 pts† adj. operating | Q3 beat, raised guidance, Capital IQ spinoff review Morningstar |
| Novartis NVS | +1.7% | +2.5% | $292B | — | — | — |
| Pentair PNR | +11.3% | +11.5% | $9B | — | — | — |
| Celestica CLS | +12.6% | +8.2% | $31B | +83% | +0.9 pts adj. operating | Q3 beat and $40B 2027 AI revenue target |
| SoFi Technologies SOFI | +14.2% | +10.8% | $19B | — | — | Record Q3 revenue beat and raised 2026 guidance |
| Kiniksa Pharmaceuticals International KNSA | +22.8% | +22.3% | $6B | — | — | 58% ARCALYST revenue jump and raised FY26 guidance |
Stock-specific: the part of a stock's move not explained by the market, style or thematic (industry and theme) factors in the FactorPulse risk model.
Revenue and margin from the company's earnings release, year over year; margin change in percentage points; — where the release is not parsed or the figures failed checks.
† The company's year-ago figure differs from the one originally filed, usually a restatement; growth is on its current basis.
Light volume: the company's earnings filing confirms the report, but trading volume has not caught up yet, so the move is an early read.
Of the 500 largest companies, 134 have reported (27% of market cap), on day 19 of the season.
How earnings reactions split, day 19 of the seasonThe 500 largest US companies with a confirmed earnings reaction so far (130), vs the same day in the past eight seasons and in four-season stretches back to mid-2020

| Season | ≤ −5σ | −5 to −2σ | −2 to 0σ | 0 to 2σ | 2 to 5σ | ≥ 5σ |
|---|---|---|---|---|---|---|
| This season | 5% | 24% | 28% | 21% | 17% | 4% |
| Past 8 seasons | 16% | 19% | 16% | 16% | 18% | 15% |
| Q2 2026 | 13% | 23% | 16% | 14% | 19% | 15% |
| Q1 2026 | 14% | 21% | 15% | 20% | 16% | 14% |
| Q4 2025 | 19% | 16% | 19% | 14% | 18% | 15% |
| Q3 2025 | 7% | 22% | 20% | 18% | 13% | 19% |
| Q2 2025 | 16% | 24% | 13% | 15% | 17% | 14% |
| Q1 2025 | 20% | 16% | 16% | 18% | 24% | 6% |
| Q4 2024 | 18% | 14% | 13% | 21% | 19% | 15% |
| Q3 2024 | 19% | 16% | 15% | 11% | 19% | 19% |
| Q3 '23–Q2 '24 | 16% | 19% | 15% | 14% | 19% | 17% |
| Q3 '22–Q2 '23 | 12% | 20% | 19% | 16% | 20% | 12% |
| Q3 '21–Q2 '22 | 14% | 18% | 13% | 18% | 26% | 11% |
| Q3 '20–Q2 '21 | 5% | 23% | 27% | 22% | 19% | 3% |
σ: a stock's earnings-day stock-specific move divided by its typical daily stock-specific move over the past year. Each bar is cut at the same business day of the season; companies weighted by the square root of market cap.
Style factors explained 47% of cross-sectional variance today against a 23% trailing-year average (96th percentile of the past year), while the S&P 500 rose 0.6% and the Nasdaq-100 gained 1.3%. Beta accounted for 42% of total variance on its own, rising 2.33% (z=+2.4) as its highest-exposure decile surged 7.0%. The top 50 high-beta momentum names gained 5.9% so far today (98.4th percentile since 2020, on pace for their 29th-best day since 2020) and the broader ~190-name high-beta momentum cohort rose 4.8% (97.6th percentile since 2020), while stocks outside both screens slipped 0.3%. Leverage also rebounded 0.24% (z=+1.4), lifting indebted balance sheets after a 63-day slide of z=-3.2.
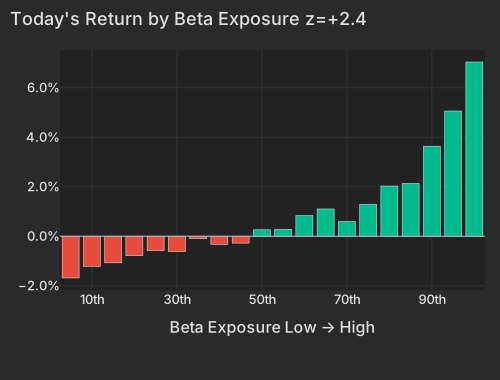
| Bucket | Avg Ret Pct |
|---|---|
| 1 | -1.69 |
| 2 | -1.21 |
| 3 | -1.07 |
| 4 | -0.78 |
| 5 | -0.58 |
| 6 | -0.62 |
| 7 | -0.10 |
| 8 | -0.33 |
| 9 | -0.28 |
| 10 | 0.26 |
| 11 | 0.28 |
| 12 | 0.84 |
| 13 | 1.10 |
| 14 | 0.60 |
| 15 | 1.29 |
| 16 | 2.03 |
| 17 | 2.14 |
| 18 | 3.64 |
| 19 | 5.06 |
| 20 | 7.04 |
The internal factor structure shows that investors funded high-beta purchases by selling the past month's defensive shelters rather than covering shorts. 20-day momentum—Medium-Term Momentum in the table—fell 0.65% (z=-2.3) as its recent-losers bucket gained 2.6%, and stock-level exposures between Beta and 20-day momentum carry a -0.57 correlation across the universe today. Profitability dropped 0.31% (z=-1.6) as unseasoned biotech names rallied 2.7% in its lowest bucket, while defensive staples (Walmart WMT -1.0%, Costco COST -1.4%) and energy shares (Exxon Mobil XOM -2.4%, carried -2.6% by style tilts as WTI crude fell 1.8% to $99.96 per barrel at 2:57 PM ET CNBC) were sold. Short Interest fell 0.09% (z=-0.6) and Short-Sale Activity dropped 0.12% (z=-1.1), meaning both the most heavily shorted stocks and yesterday's most heavily short-sold names underperformed.
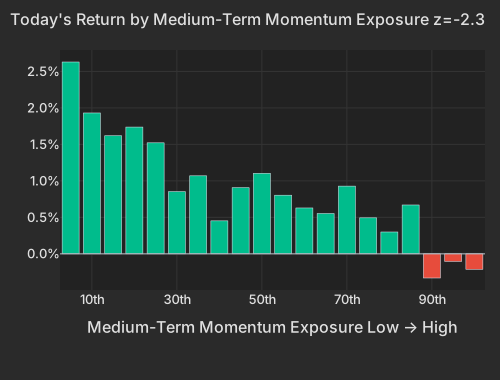
| Bucket | Avg Ret Pct |
|---|---|
| 1 | 2.63 |
| 2 | 1.93 |
| 3 | 1.62 |
| 4 | 1.74 |
| 5 | 1.52 |
| 6 | 0.85 |
| 7 | 1.07 |
| 8 | 0.45 |
| 9 | 0.91 |
| 10 | 1.10 |
| 11 | 0.80 |
| 12 | 0.63 |
| 13 | 0.55 |
| 14 | 0.93 |
| 15 | 0.49 |
| 16 | 0.30 |
| 17 | 0.67 |
| 18 | -0.33 |
| 19 | -0.10 |
| 20 | -0.21 |
Goldman Sachs Prime Brokerage (via Reuters) reported on October 26 that the week through October 23 saw the largest single-stock de-grossing since late July and a third straight week of net US equity selling, with roughly $20 billion of technology selling over two weeks. In our model, the high-beta momentum trade that acted as a proxy for the October 22 selloff is bouncing today; yesterday, the top 50 high-beta momentum names traded at 0.58× the market's volume. Over the 20-day window, our HF de-risking score sits at the 96.8th percentile since 2020 (rank 53 of 1,655 sessions), and the hedge-fund pain index remains 7.6 daily standard deviations below its October 6 peak—the 7th-deepest of 32 such events since 2020—having won back about 19% of its loss since the October 22 low, with 3 of 7 legs confirming a turn so far today.
Background: our research note Factor Fingerprints of Hedge Fund Deleveraging Events compares October with 31 hedge-fund deleveraging events since 2020.
On day 19 of third-quarter reporting, weighted by the square root of market cap, 21% of reporters have risen 2σ or more on a stock-specific basis, against 33% at this point in the past eight seasons and below every one of them. Boeing (BA) tumbled 10.2% (erasing $15.1B of market value) after reporting a wider-than-expected third-quarter core loss of $0.34 per share, abandoning its 2026 737 Max delivery target, delaying a production ramp-up until late 2027, and pushing its $10 billion annual free cash flow target out to 2029 Financial Times CNBC. Water-technology provider Xylem (XYL) sank 13.5% after missing third-quarter revenue estimates ($2.20 billion vs. $2.28 billion consensus) and trimming full-year adjusted EPS guidance on slower utility spending, according to Business Wire, while HSBC (HSBC) fell 5.3% on a revenue and EPS miss Bloomberg and Welltower (WELL) dropped 6.0% after a GAAP EPS miss overshadowed raised FFO guidance.
Conversely, suppliers demonstrating immediate AI and infrastructure cash conversion rallied sharply. Equipment lessor Herc Holdings (HRI) jumped 23.4% after beating third-quarter adjusted EPS estimates by 32% ($3.91 vs. $2.96 consensus), expanding dollar utilization by 360 basis points to 43.5% on data-center mega-project demand, and raising full-year 2026 guidance. Hardware manufacturer Celestica (CLS) surged 12.6% after third-quarter revenue rose 83% year-over-year to $5.83 billion and management introduced a $40.0 billion 2027 revenue target on 102% growth in its Connectivity & Cloud segment, while chip-design software maker Cadence Design Systems (CDNS +6.9%) and United Parcel Service (UPS +5.4%) gained on raised full-year revenue outlooks. Outside earnings, uniform supplier UniFirst (UNF -11.6%) and Cintas (CTAS -5.1%) fell on a -10.8% and -3.1% stock-specific drop, respectively, amid reports that the Federal Trade Commission plans to sue to block their $5.5 billion merger, while Visa (V -1.2%) and Seagate Technology (STX +4.8%, lifted +4.1% by style exposures) are due to report after tonight's close.
The 2-year Treasury yield edged up 2.2 basis points to 4.733% at 3:07 PM ET CNBC as the Federal Open Market Committee began its two-day policy meeting ahead of Wednesday's 2:00 PM ET rate decision, with fed funds futures pricing a 90.6% probability of a hold at 3.75%–4.00%, according to Morningstar. Over the past 20 sessions through Monday's close, chip stocks (SMH) fell 9.7% even as the 10-year yield declined 25.6 basis points—pushing their co-movement to the 97th percentile since 2019—while oil (USO) rose 10.8% over the same window (2nd percentile since 2019).
The Consumer Confidence report, released at 10:00 AM ET, showed the headline index climbing to 91.7 in October from a revised 84.2 in September, beating the 81.2 consensus forecast as the Present Situation Index rose to 120.4 on easing gasoline prices and brighter labor-market views. The Richmond Fed Survey of Manufacturing Activity, also released at 10:00 AM ET, held at -2 in October against a -1 consensus estimate as new orders slipped to -8, while the Dallas Fed Texas Retail Outlook Survey, released at 10:30 AM ET, saw its general business activity index rebound to 4.0 from -1.8 in September.
Variance decomposition: live intraday — 20261027 session, bracketed against its trailing-year range. Factor returns are trailing through last close. Total cross-sectional dispersion: 64%ile of the past year.
Variance mix — % of total, today vs 1d ago vs 1-yr avg
market 47%ile style 95.6%ile thematic 7.2%ile idiosyncratic 12%ile
Variance explained — today vs. factor's trailing-year range
Marker = the factor's share of today's total variance, placed in its own trailing-year range (box 25–75%ile, ticks 90%ile and max). Amber marker = unusually load-bearing today (≥90%ile of its own year). Factor name green = up today / red = down.
Correlation & dispersion — realized vs implied
Pairwise realized correlation (20d): 8.26% 4.5%ile since 2020 · 36%ile 3m most extreme since 2026-09-09
Top-500 pairwise: 10.84% 11%ile since 2020 · 65%ile 3m · implied (Cboe COR1M): 9.94 4.3%ile since 2006 (gap +0.9pp)
Realized 20d vol (ann. pts): all stocks 41 vs VIXEQ 42 · index 10 vs VIX 18 · style factors 23 85%ile
20-day window (19 completed days + today); percentiles vs model history since 2020; '3m' tokens rank vs the trailing 63 trading days; definitions in Terms below. Implied prints (Cboe) are delayed ~15 min. as of 14:58 ET
Top 50 high-beta momentum names (eq-wt, since-2020 rank): +5.9% 98.4%ile · rest of market -0.3%
HF de-risking score (since-2020 rank so far today): 37%ile today · 94.2%ile 5-day · HF pain index 7.6σ below peak (7th-deepest of 32 since 2020), 19% won back · selling only: no short-covering leg
| Factor | Today | 1d | 5d | 20d | 60d |
|---|---|---|---|---|---|
| Style-Risk | |||||
| Beta | +2.33% z+2.4 | +0.73% | +0.62% | -8.26% | -4.18% |
| International | -0.13% z-0.5 | -0.72% | -1.05% | -1.09% | -0.37% |
| Residual Volatility | +0.06% z+0.1 | -0.50% | -0.15% | +0.25% | +3.28% |
| Style | |||||
| Profitability | -0.31% z-1.6 | +0.02% | -0.44% | +0.63% | -0.41% |
| Leverage | +0.24% z+1.4 | -0.06% | +0.31% | -1.06% | -3.62% |
| Dividend Yield | +0.15% z+0.8 | +0.19% | +0.78% | -0.27% | +0.48% |
| Size | -0.24% z-0.7 | +0.19% | -0.45% | +0.05% | +2.79% |
| Liquidity | +0.16% z+0.6 | -0.21% | -0.14% | -0.70% | +2.01% |
| Growth | -0.13% z-0.5 | +0.05% | -0.39% | -0.17% | +0.26% |
| Value | -0.09% z-0.4 | -0.30% | -0.75% | -0.06% | -0.87% |
| Style-Momentum | |||||
| Medium-Term Momentum | -0.65% z-2.3 | -0.75% | -1.17% | -1.43% | -1.29% |
| Short-Term Momentum | -0.23% z-0.7 | -0.18% | +0.64% | +2.36% | -0.65% |
| One-Day Momentum | -0.08% z-0.3 | +0.04% | -0.43% | -0.26% | -4.28% |
| Long-Term Momentum | +0.17% z+0.3 | +0.45% | -0.06% | -2.13% | +0.52% |
| Style-Positioning | |||||
| Hedge-Fund Ownership | -0.06% z-0.6 | -0.02% | -0.61% | -0.46% | -0.64% |
| Short Interest | -0.09% z-0.6 | -0.03% | +0.31% | +0.47% | -0.58% |
| Style-Flow | |||||
| Short-Sale Activity | -0.12% z-1.1 | -0.09% | -0.02% | +0.08% | +0.90% |
| Morning Activity | +0.11% z+0.9 | -0.13% | +0.04% | -0.46% | +0.66% |
| Thematic | |||||
| Bitcoin / Crypto | -0.33% z-1.1 | -0.44% | +0.24% | +0.33% | +2.48% |
| Gold | +0.24% z+0.8 | -0.24% | -1.20% | -1.83% | +2.31% |
| Semiconductors | +0.36% z+0.6 | +0.88% | +0.48% | -3.82% | -2.54% |
| Oil | -0.14% z-0.3 | +0.19% | +0.57% | +0.68% | +4.68% |
| Treasury (Duration) | -0.06% z-0.2 | -0.09% | +0.62% | +0.47% | -2.17% |
| China | +0.07% z+0.2 | -0.76% | -1.00% | -0.83% | -0.36% |
5/20/60d windows include today's session; 1d is the previous session.
Pairwise realized correlation. Index variance net of the weighted idiosyncratic diagonal, over the cross terms — the estimator used for implied-correlation indices. 20-day window unless noted; history since 2020.
Market variance share. The fraction of cross-sectional variance explained by the market factor — the attribution companion to pairwise correlation, not a substitute for it.
Factor z-score. Today's factor return divided by its daily-return standard deviation over ~1,600 trading days.
Conditional importance. A factor's relative share of what a tree-based fit of today's stock returns explains; sums to 100% across factors.
High-beta momentum cohort. US names above $2B market cap in the top quintile of both raw beta and 12-month momentum; membership frozen at each month's first business day. “Top 50” = the 50 strongest by combined rank.
HF de-risking score. A FactorPulse measure of de-risking in factor returns: the average of four legs, each in its own daily-volatility units and counted only when it moves in the de-risking direction. They are the most-shorted names rising, 12-month momentum winners falling, names crowded in hedge-fund 13F filings falling net of their beta and momentum, and last week's relative moves continuing instead of reverting (counted only alongside another leg). A leg counts as firing at half its daily volatility or more, so a leg can show a small value without firing. Types: A, covering and selling together; B, selling only; C, covering only. Ranked against every session since January 2020. It reads factor returns only, never positions.
Dispersion (realized). Total cross-sectional volatility net of the market component; high dispersion is the flip side of low correlation.
Stock-specific (idiosyncratic) return. The part of a stock's move not explained by the market, style or thematic (industry and theme) factors in the FactorPulse risk model.
VIXEQ / DSPX / COR1M. Cboe implied indices: single-stock volatility, dispersion, and 1-month implied correlation (top-50 S&P names). Quotes delayed ~15 minutes.
Data compiled by FactorPulse AI; edited and verified by Jeff Klein. For informational purposes only. Does not constitute financial advice, an investment recommendation, or an offer to buy or sell any securities. Always consult a qualified financial professional before making investment decisions.
For more on factor construction methodology, see www.factorpulse.com/glossary.