President Luiz Inácio Lula da Silva's runoff victory over Flávio Bolsonaro, roughly 52% to 48%, sent US-listed Brazilian stocks plunging in pre-market trading Monday. Investors priced in budget deficits approaching 10% of GDP, government debt above 82% of GDP and more state intervention, and the dollar jumped 10% against Brazil's real in futures trading. State-controlled oil producer Petrobras fell 21%, erasing about $36 billion in market value on worries about governance and fuel-price controls. Brokerage XP dropped 48%, digital bank Nu Holdings lost 25%, and lenders Itaú Unibanco and Bradesco fell 26% and 30%. Brazilian shares had rallied into the vote, so the reversal dragged down a broad basket of last month's best performers, and US-listed foreign stocks trailed American companies.
Oil eased as senior officials from Saudi Arabia, Turkey and Pakistan met their Iranian counterparts in Tehran, alongside Qatari mediators, to negotiate shipping security and head off a wider conflict, even after Saudi air defenses intercepted Houthi drones and missiles over the weekend. US crude fell 2% to about $101 a barrel, the oil fund USO slid 2.5% and the energy fund XLE lost 1.3%. The oil fund had gained 14% over the prior 10 sessions. The 10-year Treasury yield edged up to about 5% ahead of Wednesday's Federal Reserve decision.
Chip stocks led a broader rise, with the S&P 500 up 0.4% and the Nasdaq-100 up 0.7% before the bell. Memory-chip maker SK Hynix climbed 3%, adding about $32 billion in market value, on reports it is reviewing a roughly $12 billion special dividend ahead of results due Wednesday in Seoul. The memory-chip fund DRAM rose 2.2% and the semiconductor fund SMH 1.6%, though DRAM is still down 24% over the past month. Hedge funds remain under pressure: Goldman Sachs says they sold technology stocks at the fastest pace in more than a decade in the two weeks to October 16, and that systematic long/short funds just had their worst week since 2024. Microsoft and Alphabet report Wednesday, with guidance on capital spending and free cash flow.
Brazilian stocks had rallied into Sunday's runoff, and Lula's win reversed them before the bell Bloomberg. Investors priced in fiscal deficits approaching 10% of GDP, public debt above 82% of GDP and more state intervention CNBC, and USD/BRL futures rose 10%. Within our US-listed universe, the damage combined local equity losses with currency depreciation: brokerage XP Inc. (XP) plunged 47.6% (with -36.6% stock-specific and -11.0% from factor exposures), StoneCo (STNE) fell 38.6%, Banco Bradesco (BBD) lost 29.5%, Itaú Unibanco (ITUB) dropped 26.3%, and Nu Holdings (NU) shed 24.9%. State-controlled Petrobras (PBR) fell 21.0%, erasing $36.1B of market value on governance and fuel-price control fears.
| Factor | Return | Z-Score | 5d Z | 20d Z | 63d Z | Category | Direction |
|---|---|---|---|---|---|---|---|
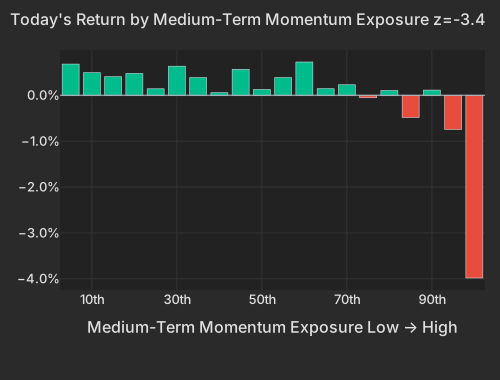
| Medium-Term Momentum | -0.97% | z=-3.4 | z=-1.3 | z=-0.8 | z=-0.4 | Style-Momentum | 1-month winners lagged |
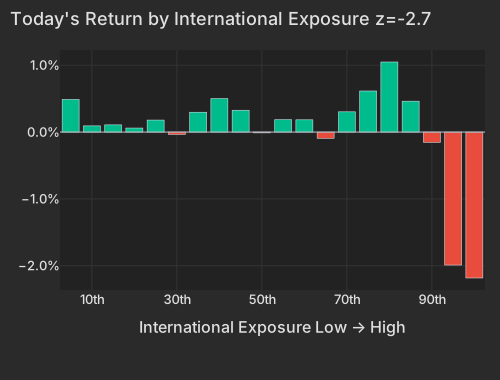
| International | -0.79% | z=-2.7 | z=-1.6 | z=-0.8 | z=-0.2 | Style-Risk | US outperformed ADRs |
| China | -0.74% | z=-1.8 | z=-0.9 | z=-0.5 | z=-0.1 | Thematic | High China exposure lagged |
| One-Day Momentum | -0.36% | z=-1.3 | z=-0.6 | z=-0.6 | z=-4.1 | Style-Momentum | Yesterday's winners reversed |
| Residual Volatility | -0.61% | z=-1.2 | z=-0.1 | z=+0.0 | z=+1.2 | Style-Risk | Volatile names lagged |
| Short-Sale Activity | -0.12% | z=-1.1 | z=+0.2 | z=+0.2 | z=+1.0 | Style-Flow | Heavily shorted T-1 lagged |
| Dividend Yield | +0.20% | z=+1.1 | z=+0.7 | z=-0.4 | z=+0.3 | Style | High-yield names led |
| Short Interest | +0.18% | z=+1.1 | z=+2.5 | z=+1.0 | z=-0.7 | Style-Positioning | Most-shorted outperformed |
The factor structure shows how a sovereign shock bleeds into US style sleeves. International dropped 0.79% (z=-2.7), marking the spread by which US-headquartered companies outperformed US-listed foreign shares and ADRs. At the same time, 20-day momentum fell 0.97% (z=-3.4), extending its 5-day return to -0.84% (z=-1.3) and 20-day return to -1.00%. In pre-market trading, much of that drop traces to Brazil: Brazilian stocks, which had rallied into the runoff, sit in the highest-exposure bucket of 20-day momentum (XP carries a +4.7 exposure, PBR +2.9 and ITUB +2.3), pulling the top bucket down 4.0%.
| Bucket | Avg Ret Pct |
|---|---|
| 1 | 0.68 |
| 2 | 0.49 |
| 3 | 0.40 |
| 4 | 0.48 |
| 5 | 0.14 |
| 6 | 0.63 |
| 7 | 0.38 |
| 8 | 0.06 |
| 9 | 0.57 |
| 10 | 0.13 |
| 11 | 0.39 |
| 12 | 0.73 |
| 13 | 0.14 |
| 14 | 0.23 |
| 15 | -0.06 |
| 16 | 0.10 |
| 17 | -0.48 |
| 18 | 0.11 |
| 19 | -0.74 |
| 20 | -3.98 |
Last week's hedge-fund strain carries into Monday. Goldman Sachs Prime Brokerage reported the largest two-week net selling of global technology stocks since it began tracking the data more than a decade ago, in the period to October 16, with short selling outpacing long buying about five to one across global equities this month Bloomberg; on Monday it said systematic long/short funds lost 2% last week, their worst week since 2024, with the largest single-stock de-grossing since late July, according to Reuters. Short Interest rose 0.18% (z=+1.1) and is up 0.92% over five sessions (z=+2.5), so the most heavily shorted stocks are still outperforming. Hedge-Fund Ownership rose 0.07% (z=+0.7) as Beta bounced 0.58% (z=+0.6) against its 10.05% 20-day slide.
Background: our research note Factor Fingerprints of Hedge Fund Deleveraging Events compares October with 31 hedge-fund deleveraging events since 2020.
| Bucket | Avg Ret Pct |
|---|---|
| 1 | 0.49 |
| 2 | 0.09 |
| 3 | 0.11 |
| 4 | 0.06 |
| 5 | 0.18 |
| 6 | -0.03 |
| 7 | 0.30 |
| 8 | 0.50 |
| 9 | 0.33 |
| 10 | -0.01 |
| 11 | 0.19 |
| 12 | 0.18 |
| 13 | -0.09 |
| 14 | 0.30 |
| 15 | 0.61 |
| 16 | 1.05 |
| 17 | 0.46 |
| 18 | -0.15 |
| 19 | -1.99 |
| 20 | -2.18 |
Earnings reactions in early tradingReporters worth over $100 billion, or moving more than 10% with a value above $5 billion
| Company | Move | Stock-specific | Market cap | Revenue YoY | Margin YoY | What drove it |
|---|---|---|---|---|---|---|
| Verizon Communications VZ | -0.7% light volume | -1.4% | $186B | +1% | +1.2 pts operating | Revenue miss vs record phone adds and a raised forecast |
Stock-specific: the part of a stock's move not explained by the market, style or thematic (industry and theme) factors in the FactorPulse risk model.
Revenue and margin from the company's earnings release, year over year; margin change in percentage points; — where the release is not parsed or the figures failed checks.
Light volume: the company's earnings filing confirms the report, but trading volume has not caught up yet, so the move is an early read.
Of the 500 largest companies, 102 have reported (24% of market cap), on day 18 of the season.
How earnings reactions split, day 18 of the seasonThe 500 largest US companies with a confirmed earnings reaction so far (100), vs the same day in the past eight seasons and in four-season stretches back to mid-2020

| Season | ≤ −5σ | −5 to −2σ | −2 to 0σ | 0 to 2σ | 2 to 5σ | ≥ 5σ |
|---|---|---|---|---|---|---|
| This season | 4% | 23% | 32% | 21% | 16% | 4% |
| Past 8 seasons | 15% | 20% | 16% | 16% | 18% | 15% |
| Q2 2026 | 13% | 24% | 17% | 12% | 16% | 17% |
| Q1 2026 | 15% | 19% | 14% | 21% | 16% | 15% |
| Q4 2025 | 16% | 19% | 20% | 14% | 17% | 13% |
| Q3 2025 | 7% | 23% | 20% | 18% | 14% | 19% |
| Q2 2025 | 16% | 24% | 13% | 16% | 17% | 14% |
| Q1 2025 | 20% | 16% | 16% | 18% | 24% | 6% |
| Q4 2024 | 11% | 18% | 14% | 19% | 24% | 15% |
| Q3 2024 | 19% | 18% | 14% | 12% | 18% | 18% |
| Q3 '23–Q2 '24 | 14% | 20% | 15% | 14% | 19% | 17% |
| Q3 '22–Q2 '23 | 13% | 20% | 20% | 14% | 20% | 12% |
| Q3 '21–Q2 '22 | 14% | 20% | 12% | 19% | 25% | 10% |
| Q3 '20–Q2 '21 | 6% | 25% | 24% | 23% | 19% | 4% |
σ: a stock's earnings-day stock-specific move divided by its typical daily stock-specific move over the past year. Each bar is cut at the same business day of the season; companies weighted by the square root of market cap.
In commodities, diplomatic movement in the Middle East took the edge off energy prices. Senior officials from Saudi Arabia, Turkey, and Pakistan met Iranian counterparts in Tehran on Monday alongside Qatari mediators to negotiate maritime security and prevent broader conflict, even after Saudi air defenses intercepted weekend Houthi drone and missile salvos The Wall Street Journal. Front-month WTI crude fell 2.1% to $101.07 per barrel at 8:06 AM ET, pulling the United States Oil Fund (USO) down 2.5% and the Energy Select Sector SPDR Fund (XLE) down 1.3% CNBC. Over the past 10 completed sessions through Friday, USO gained 14.4% while the 10-year Treasury yield fell 24.5 basis points: the 20-day correlation of oil with yields turned to -0.31 from +0.53 the month before (3rd percentile since 2019), while chip stocks' correlation with yields rose to +0.61 (96th percentile), so yields have been tracking chips rather than oil. This morning, the 10-year Treasury yield edged up 1.9 basis points to 5.007% and the 2-year yield added 3.2 basis points to 4.714% at 8:16 AM ET ahead of Wednesday's Federal Reserve decision, while the US Dollar Index (DXY) traded at 101.90, up 0.1% CNBC CNBC.
| ETF | Theme | Today | 1d Ago | 5d Ago | 20d Ago | 63d Ago |
|---|---|---|---|---|---|---|
| DRAM | memory chips & storage | +2.2% | +3.0% | +1.3% | -24.0% | -10.2% |
| SMH | semiconductors | +1.6% | +0.7% | -2.3% | -13.1% | -3.9% |
| GDX | gold | +1.4% | -1.8% | -8.6% | -13.6% | +5.9% |
| NLR | nuclear power | +1.2% | -0.5% | -4.2% | -14.6% | -17.7% |
| AIPO | AI power infrastructure | +1.1% | -1.4% | -6.8% | -16.7% | -17.2% |
| QQQ | large cap growth | +0.7% | -0.01% | -0.8% | -5.4% | +3.4% |
| SPY | large cap | +0.4% | -0.5% | -0.4% | -1.5% | +3.1% |
| WGMI | crypto miners | -1.0% | -2.6% | -7.2% | -39.8% | -43.6% |
| XLE | energy | -1.3% | +2.6% | +1.6% | +11.8% | +19.5% |
| USO | oil | -2.5% | +4.3% | +4.8% | +14.3% | +35.9% |
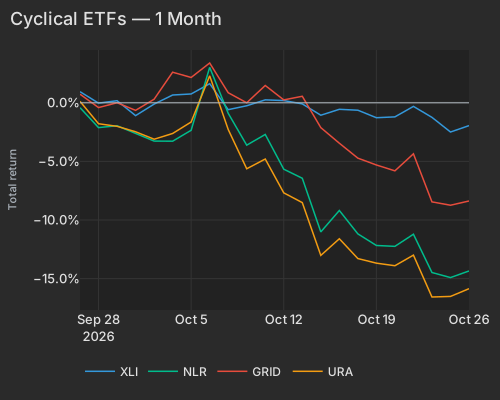
The pullback in crude helped stabilize the S&P 500 (+0.4%) and the Nasdaq-100 (+0.7%) as technology hardware found a bid. SK Hynix (SKHY) climbed 3.1%, adding $31.8B in market value on reports that the memory maker is reviewing a 16 trillion won ($12 billion) special dividend funded by its Kioxia stake sale ahead of third-quarter results due Wednesday in Seoul (Tuesday evening in New York) Economic Times. Even with today's bounce in DRAM (+2.2%), SMH (+1.6%), and nuclear and grid funds NLR (+1.2%) and GRID (+0.4%), the cyclical and AI-power complex remains deeply underwater over the past month including today, with NLR down 14.4%, URA 15.9% and GRID 8.4%; through Friday's close, all three sat in the weakest 4% of 20-day windows since late 2018. Microsoft and Alphabet give capital-spending and free-cash-flow guidance on Wednesday.
| T | XLI | NLR | GRID | URA |
|---|---|---|---|---|
| 2026-09-25 | 0.95 | -0.41 | 0.73 | 0.12 |
| 2026-09-28 | -0.03 | -2.12 | -0.41 | -1.79 |
| 2026-09-29 | 0.18 | -1.96 | 0.01 | -2.01 |
| 2026-09-30 | -1.10 | -2.60 | -0.65 | -2.47 |
| 2026-10-01 | -0.11 | -3.27 | 0.30 | -3.11 |
| 2026-10-02 | 0.66 | -3.28 | 2.61 | -2.62 |
| 2026-10-05 | 0.75 | -2.34 | 2.16 | -1.64 |
| 2026-10-06 | 1.63 | 3.02 | 3.39 | 2.30 |
| 2026-10-07 | -0.59 | -0.89 | 0.86 | -2.28 |
| 2026-10-08 | -0.25 | -3.62 | -0.00 | -5.63 |
| 2026-10-09 | 0.25 | -2.70 | 1.48 | -4.80 |
| 2026-10-12 | 0.19 | -5.67 | 0.25 | -7.68 |
| 2026-10-13 | -0.09 | -6.44 | 0.56 | -8.52 |
| 2026-10-14 | -1.06 | -11.01 | -2.12 | -13.02 |
| 2026-10-15 | -0.56 | -9.19 | -3.45 | -11.60 |
| 2026-10-16 | -0.63 | -11.18 | -4.72 | -13.29 |
| 2026-10-19 | -1.27 | -12.17 | -5.31 | -13.68 |
| 2026-10-20 | -1.20 | -12.25 | -5.81 | -13.90 |
| 2026-10-21 | -0.31 | -11.21 | -4.35 | -13.00 |
| 2026-10-22 | -1.24 | -14.48 | -8.45 | -16.57 |
| 2026-10-23 | -2.49 | -14.91 | -8.74 | -16.52 |
| 2026-10-26 | -1.95 | -14.35 | -8.38 | -15.86 |
The Dallas Fed Manufacturing Survey is due at 10:30 AM ET, with consensus estimates for the General Business Activity Index ranging from 7.0 to 8.8, down from September's 9.8 reading. Investors will watch whether raw materials prices remain elevated after jumping to 52.2 last month ahead of Wednesday's Federal Open Market Committee rate decision.
Variance decomposition: live intraday — 20261026 session, bracketed against its trailing-year range. Factor returns are trailing through last close. Total cross-sectional dispersion: 76%ile of the past year.
Variance mix — % of total, today vs 1d ago vs 1-yr avg
market 4.0%ile style 67%ile thematic 51%ile idiosyncratic 55%ile
Variance explained — today vs. factor's trailing-year range
Marker = the factor's share of today's total variance, placed in its own trailing-year range (box 25–75%ile, ticks 90%ile and max). Amber marker = unusually load-bearing today (≥90%ile of its own year). Factor name green = up today / red = down.
Correlation & dispersion — realized vs implied
Pairwise realized correlation (20d): 8.46% 4.9%ile since 2020 · 43%ile 3m most extreme since 2026-09-09
Top-500 pairwise: 11.30% 12%ile since 2020 · 73%ile 3m · implied (Cboe COR1M): 11.60 6.6%ile since 2006 (gap -0.3pp)
Realized 20d vol (ann. pts): all stocks 41 vs VIXEQ 42 · index 10 vs VIX 19 · style factors 22 83%ile
20-day window (19 completed days + today); percentiles vs model history since 2020; '3m' tokens rank vs the trailing 63 trading days; definitions in Terms below. Implied prints (Cboe) are delayed ~15 min. as of 07:58 ET
Top 50 high-beta momentum names (eq-wt, since-2020 rank): +1.2% 66%ile · rest of market -0.3%
| Factor | Today | 1d | 5d | 20d | 60d |
|---|---|---|---|---|---|
| Style-Risk | |||||
| International | -0.79% z-2.7 | +0.24% | -1.09% | -1.08% | -0.90% |
| Residual Volatility | -0.61% z-1.2 | +0.34% | -0.06% | +0.08% | +3.66% |
| Beta | +0.58% z+0.6 | +0.22% | -2.44% | -10.05% | -5.07% |
| Style | |||||
| Dividend Yield | +0.20% z+1.1 | +0.22% | +0.70% | -0.36% | +0.31% |
| Value | -0.23% z-1.0 | -0.12% | -0.80% | +0.15% | -0.47% |
| Leverage | -0.10% z-0.6 | -0.01% | +0.07% | -1.26% | -4.02% |
| Size | +0.16% z+0.5 | +0.04% | -0.86% | +0.35% | +2.79% |
| Growth | +0.06% z+0.2 | -0.09% | -0.44% | -0.06% | +0.55% |
| Profitability | +0.04% z+0.2 | -0.38% | -0.29% | +1.07% | -0.36% |
| Liquidity | -0.01% z-0.1 | -0.35% | -0.03% | -0.70% | +2.29% |
| Style-Momentum | |||||
| Medium-Term Momentum | -0.97% z-3.4 | -0.04% | -0.84% | -1.00% | -1.04% |
| One-Day Momentum | -0.36% z-1.3 | -0.26% | -0.57% | -0.62% | -4.05% |
| Long-Term Momentum | -0.25% z-0.4 | +0.66% | -1.04% | -2.82% | -1.41% |
| Short-Term Momentum | +0.01% z+0.0 | +0.21% | +1.45% | +2.73% | -0.09% |
| Style-Positioning | |||||
| Short Interest | +0.18% z+1.1 | -0.07% | +0.92% | +0.72% | -0.32% |
| Hedge-Fund Ownership | +0.07% z+0.7 | -0.18% | -0.33% | -0.30% | -0.36% |
| Style-Flow | |||||
| Short-Sale Activity | -0.12% z-1.1 | +0.01% | +0.05% | +0.09% | +1.04% |
| Morning Activity | -0.00% z-0.0 | +0.15% | +0.03% | -0.53% | +0.87% |
| Thematic | |||||
| China | -0.74% z-1.8 | +0.15% | -0.77% | -0.97% | -0.60% |
| Bitcoin / Crypto | -0.30% z-1.0 | +0.34% | +1.06% | +0.78% | +2.63% |
| Oil | -0.45% z-0.9 | +1.08% | -0.49% | +0.05% | +3.95% |
| Treasury (Duration) | +0.16% z+0.5 | -0.29% | +1.45% | +0.72% | -2.02% |
| Semiconductors | +0.30% z+0.5 | +0.48% | -0.94% | -4.62% | -4.54% |
| Gold | -0.16% z-0.5 | -0.18% | -1.37% | -2.06% | +1.91% |
5/20/60d windows include today's session; 1d is the previous session.
Pairwise realized correlation. Index variance net of the weighted idiosyncratic diagonal, over the cross terms — the estimator used for implied-correlation indices. 20-day window unless noted; history since 2020.
Market variance share. The fraction of cross-sectional variance explained by the market factor — the attribution companion to pairwise correlation, not a substitute for it.
Factor z-score. Today's factor return divided by its daily-return standard deviation over ~1,600 trading days.
Conditional importance. A factor's relative share of what a tree-based fit of today's stock returns explains; sums to 100% across factors.
High-beta momentum cohort. US names above $2B market cap in the top quintile of both raw beta and 12-month momentum; membership frozen at each month's first business day. “Top 50” = the 50 strongest by combined rank.
HF de-risking score. A FactorPulse measure of de-risking in factor returns: the average of four legs, each in its own daily-volatility units and counted only when it moves in the de-risking direction. They are the most-shorted names rising, 12-month momentum winners falling, names crowded in hedge-fund 13F filings falling net of their beta and momentum, and last week's relative moves continuing instead of reverting (counted only alongside another leg). A leg counts as firing at half its daily volatility or more, so a leg can show a small value without firing. Types: A, covering and selling together; B, selling only; C, covering only. Ranked against every session since January 2020. It reads factor returns only, never positions.
Dispersion (realized). Total cross-sectional volatility net of the market component; high dispersion is the flip side of low correlation.
Stock-specific (idiosyncratic) return. The part of a stock's move not explained by the market, style or thematic (industry and theme) factors in the FactorPulse risk model.
VIXEQ / DSPX / COR1M. Cboe implied indices: single-stock volatility, dispersion, and 1-month implied correlation (top-50 S&P names). Quotes delayed ~15 minutes.
Data compiled by FactorPulse AI; edited and verified by Jeff Klein. For informational purposes only. Does not constitute financial advice, an investment recommendation, or an offer to buy or sell any securities. Always consult a qualified financial professional before making investment decisions.
For more on factor construction methodology, see www.factorpulse.com/glossary.