
U.S. crude rose 4% to just above $103 a barrel Friday as attacks on Saudi Arabia continued, and the 10-year Treasury yield returned to 5%. A University of Michigan survey added to the pressure by showing consumers' inflation expectations at their highest since May. The S&P 500 fell 0.5% and the Nasdaq-100 finished flat. Energy was the only S&P 500 sector to rise, with the energy fund XLE up 2.6% and oil giants ExxonMobil and Chevron each gaining almost 3%. Oilfield-services leader SLB rose 7% after beating quarterly expectations, helped by 76% growth in its data-center business. Consumer staples stocks fell about 2% after a 10% run over the past month, with beverage maker Coca-Cola down 2.7%. The Federal Reserve's next rate decision comes Wednesday.
Phone carriers AT&T and T-Mobile each fell about 8%, while cell-tower owner Crown Castle jumped 9%. The moves followed a Bloomberg report that SpaceX is negotiating to lease 80,000 U.S. cell sites to launch a fourth national wireless carrier, a network that would combine satellites with towers on the ground. The carriers' drop helped pull the communication-services sector down about 2%, and Verizon reports before Monday's open.
The stocks most sensitive to market moves and last year's big winners are now in their deepest combined slump since 2020. Goldman Sachs's prime brokerage said that on Thursday, for the first time since the pandemic, all three broad strategy groups it tracks lost more than 1% on the same day, and more than two-thirds of funds finished down. It also said short selling has outpaced buying 5-to-1 this month. Chip stocks won back part of Thursday's drop, with the memory-chip fund DRAM up 3% and the semiconductor fund SMH up 0.6%. In earnings, fuel-cell maker Bloom Energy, an AI power supplier, fell 11% even though quarterly revenue more than doubled to a record $1.2 billion, because it burned through about $180 million in cash. Elsewhere, staffing firm Robert Half jumped 22% on its first revenue growth since 2022 in its Talent Solutions unit, while auto-parts distributor LKQ fell 22% after flagging a quarterly miss and withdrawing its forecast.
For the week, the S&P 500 slipped 0.4% and the Nasdaq-100 0.6%, while the Russell 2000 gained 2.0%. The semiconductor fund SMH fell 2.3%, gold lost 4.1% (GLD) to end near $3,997 an ounce, silver lost 5.5% (SLV), and the long-bond fund TLT rose 1.6%, while USO gained 4.6% as WTI reached $103.59. Our HF de-risking score traced the week's arc: Monday and Tuesday registered covering only, Wednesday brought the sharpest drop in 13F-crowded names in three weeks, Thursday combined covering, selling of 12-month winners and continuation (the past week's winners kept beating its losers instead of reverting) for the sixth-highest de-risking reading since 2020, and Friday's reading rested mostly on crowded names (76.4th percentile). The slide in Beta and 12-month momentum accelerated on Thursday, when Beta fell 3.78% and 12-month momentum 1.80%; for the week, Beta lost 2.20% and 12-month momentum 0.31%.
The S&P 500 has barely registered the slide. From the June 22 peak through Thursday, the Beta and 12-month momentum factors combined lost 26.5 points while the S&P 500 rose 2.9%; over October's leg, from October 2 to Thursday, they lost 16.9 points while the index dipped 0.7% and was never more than 2.0% below where it started. Beta and 12-month momentum now load on the same AI names: of the 138 stocks in the top tail of both this month, 54% are AI-linked by count and 79% by value, against 8% and 19% of the universe. Their daily returns correlate +0.51 this year, against -0.45 in 2020 and -0.51 in 2022, so the two fall together, and their combined daily volatility has run at 1.9 points in 2026 against 0.7 to 1.2 in every year from 2020 to 2025. Scaled by that volatility, October's leg ranks 11th of 58 HF stress events since 2020 rather than first. Meanwhile 20-day realized pairwise correlation sits at the 6.3rd percentile since 2020 and Cboe's 1-month implied correlation (COR1M) at the 7.2nd percentile since 2006, so selling in one crowded basket has been absorbed inside the index rather than spreading across it.
| Year | Beta vs 12-month momentum, daily correlation | Combined daily volatility (pts) | AI-linked share of names in both top tails, by value |
|---|---|---|---|
| 2020 | -0.45 | 1.07 | 46% (June) |
| 2022 | -0.51 | 1.11 | 38% (June) |
| 2025 | +0.15 | 1.24 | 22% (June) |
| 2026 | +0.51 | 1.88 | 79% (October) |
Style factors explained 11% of stock-level variance today against a 23% one-year average (23rd percentile), while thematic factors explained 7% against a 3% norm (98th percentile). Within that lighter style tape, our HF de-risking score finished at the 76.4th percentile since 2020, as names crowded in hedge-fund 13F filings fell net of their beta and momentum (0.20%, z=-1.8) and last week's relative moves continued instead of reverting. Thursday's final reading ranked sixth of 1,671 days since 2020 (99.6th percentile), and the trailing three-, five-, ten-, and twenty-day scores sit at the 98.7th, 96.5th, 98.4th, and 97.5th percentiles—a factor pattern consistent with a sustained multi-session de-gross. The Beta and 12-month momentum factors combined have given back 25.6 percentage points since their June 22, 2026 peak, their deepest drawdown since 2020, beyond the 25.0-point slide from February 16, 2021 to May 11, 2022. Beta's 10.2% 10-day loss is deeper than any since 2020 except March 2020 (-11.8%) and an earlier window of this same slide.

| Date | Type | Most-shorted names up | 12-month winners down | 13F-crowded names down | Last week's moves continuing |
|---|---|---|---|---|---|
| 20261005 | — | 0.26 | 0.21 | 0.00 | 0.00 |
| 20261006 | B | 0.23 | 1.05 | 0.88 | 1.35 |
| 20261007 | — | 0.39 | 0.00 | 0.00 | 0.00 |
| 20261008 | — | 0.00 | 0.39 | 0.47 | 0.00 |
| 20261009 | — | 0.05 | 0.00 | 0.00 | 0.00 |
| 20261012 | C | 0.70 | 0.29 | 0.00 | 0.55 |
| 20261013 | C | 0.59 | 0.00 | 0.48 | 0.00 |
| 20261014 | B | 0.23 | 0.06 | 0.82 | 0.32 |
| 20261015 | A | 1.10 | 1.99 | 0.00 | 0.93 |
| 20261016 | B | 0.32 | 0.52 | 0.91 | 0.19 |
| 20261019 | C | 0.74 | 0.00 | 0.00 | 0.00 |
| 20261020 | C | 0.80 | 0.13 | 0.00 | 1.10 |
| 20261021 | B | 0.42 | 0.00 | 2.35 | 0.00 |
| 20261022 | A | 1.86 | 2.34 | 0.33 | 3.21 |
| 20261023 | B | 0.02 | 0.00 | 1.45 | 0.53 |
Performance data from Goldman Sachs Prime Brokerage covering Thursday's session, reported by Bloomberg today, corroborates the breadth of the drawdown: more than two-thirds of hedge funds finished down, and for the first time since the pandemic, fundamental long/short (-1.4%, with TMT funds -2.7%), systematic long/short (-1.3%), and multistrategy platforms (-1.9%) all lost more than 1% on the same day Bloomberg. Goldman Sachs Prime Brokerage also noted today that short selling outpaced long buying 5-to-1 month-to-date, pushing short leverage to the 99th percentile and fundamental net leverage near a three-year low. Across 20 past de-risking episodes since 2020 in our data, the two sessions after a low brought a Beta snap-back, 5-day reversion (Short-Term Momentum turning negative), and underperformance in the most-shorted stocks. Today, none of the three appeared cleanly: Beta barely budged (+0.25%, z=+0.3) against its 11.61% 20-day drop, Short-Term Momentum, the 5-day trend, stayed positive (+0.17%, z=+0.6), and Short Interest moved -0.09% (z=-0.5) after gaining 1.00% over five days. 12-month momentum rose 0.68% (z=+1.1). Cybersecurity stocks extended a rally that began Wednesday, when critical flaws in the PHP web language, found with the help of AI, were disclosed CNN and CrowdStrike rose 5.9%. On Friday a further flaw affecting already-patched PHP releases was flagged and an Evercore ISI survey of channel partners pointed to firmer security budgets, with CrowdStrike up 8.3% and Palo Alto Networks 7.2%. SK Hynix ADRs gained 3.8% after shelving its Solidigm unit's U.S. IPO The Wall Street Journal.
| Factor | Return | Z-Score | 5d Z | 20d Z | 63d Z | Category | Direction |
|---|---|---|---|---|---|---|---|
| Oil | +1.07% | +2.3 | +0.0 | +0.3 | +1.5 | Thematic | High oil beta led |
| Profitability | -0.37% | -2.0 | -0.8 | +1.5 | -0.3 | Style | High profitability lagged |
| Hedge-Fund Ownership | -0.20% | -1.8 | -1.1 | -0.8 | -0.5 | Style-Positioning | 13F-crowded names lagged |
| Morning Activity | +0.16% | +1.3 | -0.2 | -1.1 | +1.5 | Style-Flow | Habitually early-volume names led |
| Liquidity | -0.34% | -1.3 | -0.1 | -0.7 | +1.1 | Style | Low-turnover names outperformed |
| Bitcoin / Crypto | +0.35% | +1.1 | +2.2 | +0.7 | +1.4 | Thematic | Crypto-exposed names rose |
| Dividend Yield | +0.20% | +1.1 | +0.7 | -0.8 | -0.3 | Style | High payout yield led |
| Long-Term Momentum | +0.68% | +1.1 | -0.2 | -0.7 | -0.4 | Style-Momentum | 12-month winners rebounded |
The lowest-turnover stocks also outperformed the highest-turnover, most-liquid names today, pushing Liquidity down 0.34% (z=-1.3) against its 63-day positive trend (+2.33%, z=+1.1), while Profitability fell 0.37% (z=-2.0).
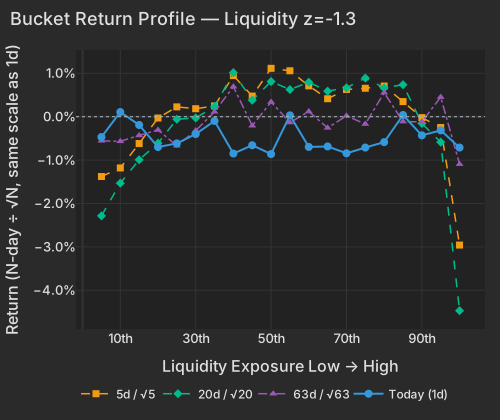
| Bucket | Ret 1D Pct | Ret 5D Norm Pct | Ret 20D Norm Pct | Ret 63D Norm Pct |
|---|---|---|---|---|
| 1 | -0.47 | -1.38 | -2.28 | -0.56 |
| 2 | 0.11 | -1.18 | -1.53 | -0.57 |
| 3 | -0.19 | -0.62 | -0.99 | -0.43 |
| 4 | -0.70 | -0.03 | -0.61 | -0.31 |
| 5 | -0.61 | 0.23 | -0.06 | -0.67 |
| 6 | -0.40 | 0.18 | -0.03 | -0.32 |
| 7 | -0.10 | 0.25 | 0.23 | 0.11 |
| 8 | -0.85 | 0.95 | 1.02 | 0.69 |
| 9 | -0.66 | 0.47 | 0.38 | -0.21 |
| 10 | -0.86 | 1.11 | 0.81 | 0.34 |
| 11 | 0.03 | 1.06 | 0.63 | -0.13 |
| 12 | -0.70 | 0.71 | 0.80 | 0.12 |
| 13 | -0.69 | 0.41 | 0.59 | -0.26 |
| 14 | -0.84 | 0.63 | 0.67 | 0.02 |
| 15 | -0.71 | 0.66 | 0.89 | -0.17 |
| 16 | -0.59 | 0.71 | 0.66 | 0.55 |
| 17 | 0.04 | 0.35 | 0.74 | -0.11 |
| 18 | -0.43 | -0.02 | -0.15 | -0.12 |
| 19 | -0.31 | -0.25 | -0.59 | 0.45 |
| 20 | -0.71 | -2.96 | -4.47 | -1.09 |
Earnings reactions in the regular sessionReporters worth over $100 billion, or moving more than 10% with a value above $5 billion
| Company | Move | Stock-specific | Market cap | Revenue YoY | Margin YoY | What drove it |
|---|---|---|---|---|---|---|
| Bloom Energy BE | -11.4% | -11.5% | $64B | +138% | +14.2 pts adj. operating | $180.6M cash burn outweighed 138% revenue growth |
| Newmont NEM | -4.7% | -3.1% | $120B | +15% | +3.1 pts operating | Q4 and 2027 cost warnings overshadowed Q3 beat |
| American Express AXP | -3.7% light volume | -2.4% | $220B | +9% | +1.8 pts pre-tax | Slight revenue miss and 5% workforce restructuring |
| Western Digital WDC | -2.9% | -5.7% | $133B | +55% | +18.8 pts adj. operating | Upbeat outlook and dividend hike failed to lift shares Bloomberg |
Stock-specific: the part of a stock's move not explained by the market, style or thematic (industry and theme) factors in the FactorPulse risk model.
Revenue and margin from the company's earnings release, year over year; margin change in percentage points; — where the release is not parsed or the figures failed checks.
Light volume: the company's earnings filing confirms the report, but trading volume has not caught up yet, so the move is an early read.
Of the 500 largest companies, 102 have reported (24% of market cap), on day 17 of the season.
How earnings reactions split, day 17 of the seasonThe 500 largest US companies with a confirmed earnings reaction so far (99), vs the same day in the past eight seasons and in four-season stretches back to mid-2020

| Season | ≤ −5σ | −5 to −2σ | −2 to 0σ | 0 to 2σ | 2 to 5σ | ≥ 5σ |
|---|---|---|---|---|---|---|
| This season | 4% | 24% | 30% | 21% | 17% | 4% |
| Past 8 seasons | 14% | 21% | 17% | 16% | 18% | 15% |
| Q2 2026 | 14% | 24% | 18% | 12% | 15% | 17% |
| Q1 2026 | 15% | 20% | 14% | 19% | 16% | 16% |
| Q4 2025 | 16% | 20% | 21% | 15% | 16% | 12% |
| Q3 2025 | 6% | 23% | 20% | 16% | 14% | 21% |
| Q2 2025 | 17% | 25% | 12% | 17% | 16% | 13% |
| Q1 2025 | 20% | 14% | 20% | 15% | 26% | 6% |
| Q4 2024 | 8% | 19% | 14% | 16% | 28% | 14% |
| Q3 2024 | 15% | 23% | 16% | 14% | 17% | 15% |
| Q3 '23–Q2 '24 | 12% | 22% | 15% | 15% | 20% | 16% |
| Q3 '22–Q2 '23 | 11% | 21% | 19% | 16% | 20% | 13% |
| Q3 '21–Q2 '22 | 15% | 18% | 13% | 20% | 25% | 8% |
| Q3 '20–Q2 '21 | 6% | 26% | 21% | 23% | 19% | 4% |
σ: a stock's earnings-day stock-specific move divided by its typical daily stock-specific move over the past year. Each bar is cut at the same business day of the season; companies weighted by the square root of market cap.
Earnings reactions this season have been muted on both sides. Weighted by size, 21% of this season's reporters rose 2σ or more on a stock-specific basis—below every one of the past eight seasons at this point (33% average, 28% lowest) and below every four-season stretch since mid-2020—while 29% fell 2σ or more, against 35% in past seasons. Fuel-cell maker Bloom Energy (BE) dropped 11.4% (erasing $6.6B of market value, with -11.5% stock-specific) even after Q3 revenue grew 138.1% to a record $1.24 billion and management raised full-year profit guidance, as investors focused on $180.6 million of negative free cash flow and $859 million in unbilled contract assets. HVAC and data-center contractor Comfort Systems USA (FIX) fell 9.4% (-9.8% stock-specific) after withholding forward guidance alongside CFO Bill George's retirement, overshadowing 53.7% revenue growth and a record $17.81 billion backlog. Oilfield-services leader SLB rose 7.1% (+6.2% stock-specific) on a Q3 beat and 76.0% growth in Data Center Solutions revenue. Infosys (INFY) lost 6.7% after trimming FY27 constant-currency revenue growth guidance to 1%–2% Economic Times. Auto-parts distributor LKQ Corp plunged 22.4% (-20.0% stock-specific) after a preliminary Q3 miss and guidance withdrawal, while staffing firm Robert Half (RHI) jumped 22.1% (+23.4% stock-specific) on its first positive Talent Solutions revenue growth since 2022.
In credit markets, stress remains concentrated in junk debt and levered AI borrowers rather than broad investment-grade corporates. Judging by fund prices through Thursday's close, high-yield spreads (HYG, -0.1% today) are roughly 60 basis points wider over the past 20 sessions while investment-grade spreads (LQD, -0.4% today, matching what higher 7-year yields imply) are within noise at roughly 10 basis points wider. Investor memos reported by Bloomberg showed London credit manager Arini's master fund lost 6.9% in the first half of October on concentrated distressed positions while Sona's master fund lost about 3.1%, erasing its 2026 gains Bloomberg. At the center of AI credit risk, CoreWeave's five-year credit default swaps climbed 39% in October to 1,145 bps—after hitting a record on October 15 that priced roughly 60% default odds Bloomberg—with its unsecured bonds yielding about 15% against $20.7 billion of debt due through 2030 CNBC. Barclays credit analyst Andrew Keches wrote this week that sentiment toward AI bonds is decidedly negative CNBC. Among equity proxies for AI data-center hosting, the bitcoin-miner fund WGMI fell 2.6% today, taking its loss over the past month to 41.7%.
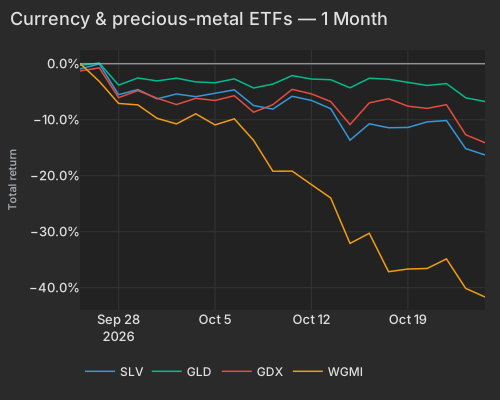
| Date | SLV | GLD | GDX | WGMI |
|---|---|---|---|---|
| 2026-09-24 | -0.93 | -0.30 | -1.29 | 0.06 |
| 2026-09-25 | -0.03 | 0.13 | -0.74 | -3.15 |
| 2026-09-28 | -5.52 | -3.81 | -6.06 | -7.09 |
| 2026-09-29 | -4.61 | -2.54 | -4.80 | -7.35 |
| 2026-09-30 | -6.28 | -3.06 | -6.16 | -9.76 |
| 2026-10-01 | -5.40 | -2.58 | -7.29 | -10.75 |
| 2026-10-02 | -5.88 | -3.24 | -6.18 | -8.94 |
| 2026-10-05 | -5.21 | -3.39 | -6.56 | -10.93 |
| 2026-10-06 | -4.66 | -2.70 | -5.71 | -9.84 |
| 2026-10-07 | -7.46 | -4.33 | -8.66 | -13.68 |
| 2026-10-08 | -8.10 | -3.63 | -7.31 | -19.20 |
| 2026-10-09 | -5.81 | -2.11 | -4.57 | -19.18 |
| 2026-10-12 | -6.55 | -2.73 | -5.38 | -21.59 |
| 2026-10-13 | -8.03 | -2.85 | -6.76 | -23.98 |
| 2026-10-14 | -13.65 | -4.30 | -10.86 | -32.09 |
| 2026-10-15 | -10.73 | -2.59 | -6.99 | -30.29 |
| 2026-10-16 | -11.43 | -2.77 | -6.25 | -37.16 |
| 2026-10-19 | -11.38 | -3.36 | -7.58 | -36.67 |
| 2026-10-20 | -10.39 | -3.88 | -7.97 | -36.57 |
| 2026-10-21 | -10.14 | -3.55 | -7.31 | -34.87 |
| 2026-10-22 | -15.17 | -6.08 | -12.69 | -40.14 |
| 2026-10-23 | -16.30 | -6.75 | -14.11 | -41.67 |
WTI crude climbed 4.1% to $103.59 per barrel CNBC as attacks on Saudi Arabia continued The Wall Street Journal, lifting the Oil factor 1.07% (z=+2.3, 99.6th percentile of daily returns since 2020), extending its 63-day gain to +5.73% (z=+1.5) and accounting for 5.2% of total cross-sectional variance (98.9th percentile). Energy was the only S&P 500 sector to finish higher (XLE +2.6%), led by ExxonMobil (+2.8%, adding $19.8B in market cap), Chevron (+2.7%), and oil producers Kosmos Energy (+6.7%) and Equinor (+5.4%).
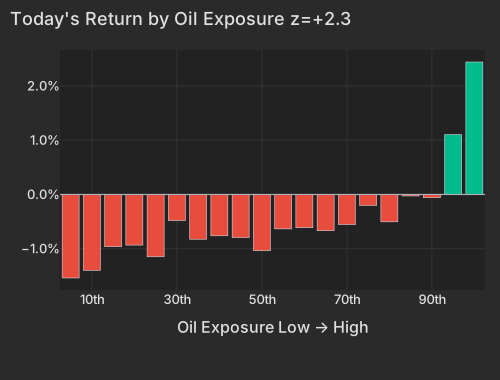
| Bucket | Avg Ret Pct |
|---|---|
| 1 | -1.54 |
| 2 | -1.40 |
| 3 | -0.96 |
| 4 | -0.93 |
| 5 | -1.15 |
| 6 | -0.48 |
| 7 | -0.83 |
| 8 | -0.76 |
| 9 | -0.80 |
| 10 | -1.04 |
| 11 | -0.64 |
| 12 | -0.61 |
| 13 | -0.67 |
| 14 | -0.56 |
| 15 | -0.20 |
| 16 | -0.50 |
| 17 | -0.03 |
| 18 | -0.06 |
| 19 | 1.10 |
| 20 | 2.44 |
Over the 10 sessions through Thursday, the 10-year Treasury yield fell 28.0 bps while semiconductor ETF SMH dropped 13.8% and oil fund USO rose 10.1%—a shift that put the 20-day correlation between yields and chip stocks in the 96th percentile since 2019, with chip stocks and yields falling together on growth worries. Today both rose, yields on oil: the 10-year yield rose 4.8 bps to 5.001% CNBC and the 2-year climbed 5.1 bps to 4.686% CNBC as crude rallied and University of Michigan inflation expectations hit five-month highs data.sca.isr.umich.edu Bloomberg, pushing Treasury (Duration) down 0.31% (z=-0.9) and long-bond ETF TLT down 0.5%, while SMH added 0.6%. Defensive consumer staples (XLP -1.9%, trading at 1.7× its typical session pace) pulled back from a 10.2% 20-day run (99.2nd percentile since late 2018) as Coca-Cola fell 2.7%. In communication services (XLC -1.8%), AT&T (-7.8%) and T-Mobile (-7.8%) suffered 3σ to 4.5σ stock-specific drops while tower REIT Crown Castle surged 9.2% after Bloomberg reported SpaceX is negotiating to lease 80,000 U.S. cell sites to launch a hybrid satellite-terrestrial wireless network Morningstar, with Verizon due to report before Monday's open.
| ETF | Theme | Today | 1d Ago | 5d Ago | 20d Ago | 63d Ago |
|---|---|---|---|---|---|---|
| USO | Oil | +4.3% | +1.7% | +3.3% | +6.2% | +18.9% |
| DRAM | Memory Chips & Storage | +3.1% | -7.1% | -7.4% | -24.8% | -14.1% |
| XLE | Energy | +2.6% | -0.9% | +1.5% | +7.9% | +14.0% |
| DTCR | Data Centers | +1.9% | -2.6% | -4.9% | -10.8% | -11.2% |
| IGV | Software | +1.7% | -0.1% | -0.8% | +1.5% | +23.6% |
| SMH | Semiconductors | +0.6% | -6.0% | -6.4% | -12.9% | -6.7% |
| SPY | Large Cap | -0.5% | -1.2% | -1.0% | -0.4% | +3.6% |
| XLC | Communication Services | -1.8% | -1.4% | -4.5% | -5.8% | +1.4% |
| XLP | Consumer Staples | -1.9% | +3.3% | +3.8% | +10.2% | +7.7% |
| WGMI | Crypto Miners | -2.6% | -8.1% | -14.1% | -40.2% | -44.4% |
Verizon reports before Monday's open, followed Tuesday by Coca-Cola, Visa, Boeing and PayPal alongside durable goods orders and Conference Board consumer confidence. Wednesday brings the Fed's rate decision, with Microsoft and Alphabet reporting after the close, the next of the large AI spenders after Meta's results on October 21. Thursday packs the first estimate of third-quarter GDP and September personal income and PCE prices at 8:30 a.m., Eli Lilly and Mastercard before the open, and Amazon and Intel after it; Exxon Mobil, Chevron and AbbVie report Friday alongside the employment cost index. Apple follows on Monday, November 2, and Nvidia on November 17.
Our study of 20 past de-risking episodes since 2020 describes, in hindsight, what showed up around past lows, and through Friday most of it has not appeared. Beta's best day since the October 2 peak, October 21 (+1.16%), fell short of the outsized first-day rebound that followed past lows, and Friday's 0.25% was smaller. Names crowded in 13F filings, which turned last in past episodes, fell again Friday. Staples lagged the S&P 500 by 1.4 percentage points but were bought again between 3:00 and 3:50 p.m., unlike past ends, when staples lagged for the whole session, and the oil rally weighs on staples regardless of positioning. Friday's volume ran at 0.74 times Thursday's, and only 35% of stocks rose. A strong rebound would not settle it either: this slide's own rally from July 29 to October 2 won back 55% of the loss before October's fresh low.
The Michigan Consumer Survey (Final), released at 10:00 AM ET, came in at 48.0, revised up from a preliminary 46.3 but below September's 48.1, though the Current Economic Conditions subindex dropped to 46.7 from 50.9 on an 18% plunge in durable-goods buying conditions. Year-ahead inflation expectations rose to 4.7% from 4.6% and long-run expectations ticked up to 3.5%, both the highest since May 2026 Bloomberg. The New York Fed Staff Nowcast held its Q3 and Q4 annualized GDP growth estimates at 2.7% and 2.8%.
Variance decomposition: live intraday — 20261023 session, bracketed against its trailing-year range. Factor returns are trailing through last close. Total cross-sectional dispersion: 36%ile of the past year.
Variance mix — % of total, today vs 1d ago vs 1-yr avg
market 45%ile style 23%ile thematic 97.6%ile idiosyncratic 67%ile
Variance explained — today vs. factor's trailing-year range
Marker = the factor's share of today's total variance, placed in its own trailing-year range (box 25–75%ile, ticks 90%ile and max). Amber marker = unusually load-bearing today (≥90%ile of its own year). Factor name green = up today / red = down.
Correlation & dispersion — realized vs implied
Pairwise realized correlation (20d): 8.96% 6.3%ile since 2020 · 62%ile 3m
Top-500 pairwise: 10.55% 9.8%ile since 2020 · 51%ile 3m · implied (Cboe COR1M): 11.97 7.2%ile since 2006 (gap -1.4pp)
Realized 20d vol (ann. pts): all stocks 40 vs VIXEQ 42 · index 11 vs VIX 20 · style factors 22 81%ile
20-day window (19 completed days + today); percentiles vs model history since 2020; '3m' tokens rank vs the trailing 63 trading days; definitions in Terms below. Implied prints (Cboe) are delayed ~15 min. as of 15:58 ET
Top 50 high-beta momentum names (eq-wt, since-2020 rank): +0.6% 55%ile · rest of market -0.6%
HF de-risking score (since-2020 rank): 76%ile today · 96.5%ile 5-day · beta + 12-month momentum 26 pts below peak, deepest since 2020 · selling only: no short-covering leg
| Factor | Today | 1d | 5d | 20d | 60d |
|---|---|---|---|---|---|
| Style-Risk | |||||
| International | +0.26% z+0.9 | -0.34% | -0.49% | -0.24% | -0.34% |
| Residual Volatility | +0.35% z+0.7 | -0.15% | +1.03% | +0.47% | +4.34% |
| Beta | +0.25% z+0.3 | -3.78% | -2.20% | -11.61% | -5.54% |
| Style | |||||
| Profitability | -0.37% z-2.0 | +0.28% | -0.35% | +1.28% | -0.39% |
| Liquidity | -0.34% z-1.3 | +0.30% | -0.06% | -0.88% | +2.13% |
| Dividend Yield | +0.20% z+1.1 | +0.16% | +0.28% | -0.61% | -0.04% |
| Value | -0.13% z-0.5 | +0.03% | -0.81% | +0.22% | +0.02% |
| Growth | -0.08% z-0.3 | -0.15% | -0.36% | -0.04% | +0.57% |
| Leverage | -0.03% z-0.2 | +0.14% | -0.21% | -1.35% | -4.25% |
| Size | +0.05% z+0.2 | -0.61% | -0.82% | +0.33% | +3.29% |
| Style-Momentum | |||||
| One-Day Momentum | -0.30% z-1.1 | -0.32% | -0.54% | -0.34% | -3.65% |
| Long-Term Momentum | +0.68% z+1.1 | -1.80% | -0.31% | -2.06% | -1.47% |
| Short-Term Momentum | +0.17% z+0.6 | +1.13% | +1.26% | +2.97% | -0.69% |
| Medium-Term Momentum | -0.07% z-0.2 | -0.00% | +0.39% | -0.26% | -0.17% |
| Style-Positioning | |||||
| Hedge-Fund Ownership | -0.20% z-1.8 | -0.04% | -0.26% | -0.38% | -0.46% |
| Short Interest | -0.09% z-0.5 | +0.58% | +1.00% | +0.61% | -0.71% |
| Style-Flow | |||||
| Morning Activity | +0.16% z+1.3 | -0.06% | -0.06% | -0.59% | +0.77% |
| Short-Sale Activity | -0.01% z-0.1 | +0.09% | +0.10% | +0.08% | +1.12% |
| Thematic | |||||
| Oil | +1.07% z+2.3 | -0.89% | +0.01% | +0.61% | +5.14% |
| Bitcoin / Crypto | +0.35% z+1.1 | +0.41% | +1.51% | +0.95% | +2.64% |
| Treasury (Duration) | -0.31% z-0.9 | +1.18% | +0.96% | +0.21% | -2.38% |
| Semiconductors | +0.51% z+0.8 | -1.72% | -1.08% | -4.61% | -4.77% |
| Gold | -0.16% z-0.5 | -1.02% | -1.36% | -1.92% | +1.29% |
| China | +0.18% z+0.4 | -0.10% | +0.48% | -0.04% | +0.56% |
5/20/60d windows include today's session; 1d is the previous session.
Pairwise realized correlation. Index variance net of the weighted idiosyncratic diagonal, over the cross terms — the estimator used for implied-correlation indices. 20-day window unless noted; history since 2020.
Market variance share. The fraction of cross-sectional variance explained by the market factor — the attribution companion to pairwise correlation, not a substitute for it.
Factor z-score. Today's factor return divided by its daily-return standard deviation over ~1,600 trading days.
Conditional importance. A factor's relative share of what a tree-based fit of today's stock returns explains; sums to 100% across factors.
High-beta momentum cohort. US names above $2B market cap in the top quintile of both raw beta and 12-month momentum; membership frozen at each month's first business day. “Top 50” = the 50 strongest by combined rank.
HF de-risking score. A FactorPulse measure of de-risking in factor returns: the average of four legs, each in its own daily-volatility units and counted only when it moves in the de-risking direction. They are the most-shorted names rising, 12-month momentum winners falling, names crowded in hedge-fund 13F filings falling net of their beta and momentum, and last week's relative moves continuing instead of reverting (counted only alongside another leg). A leg counts as firing at half its daily volatility or more, so a leg can show a small value without firing. Types: A, covering and selling together; B, selling only; C, covering only. Ranked against every session since January 2020. It reads factor returns only, never positions.
Dispersion (realized). Total cross-sectional volatility net of the market component; high dispersion is the flip side of low correlation.
Stock-specific (idiosyncratic) return. The part of a stock's move not explained by the market, style or thematic (industry and theme) factors in the FactorPulse risk model.
VIXEQ / DSPX / COR1M. Cboe implied indices: single-stock volatility, dispersion, and 1-month implied correlation (top-50 S&P names). Quotes delayed ~15 minutes.
Data compiled by FactorPulse AI; edited and verified by Jeff Klein. For informational purposes only. Does not constitute financial advice, an investment recommendation, or an offer to buy or sell any securities. Always consult a qualified financial professional before making investment decisions.
For more on factor construction methodology, see www.factorpulse.com/glossary.