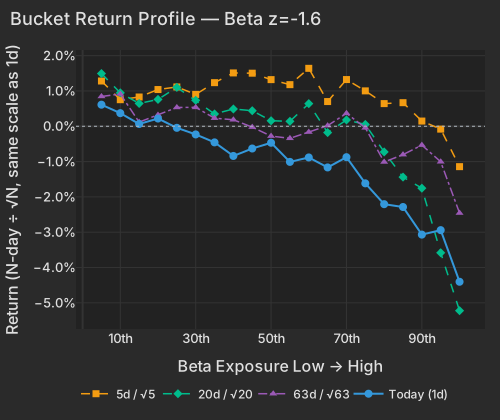
Facebook parent Meta fell 2.7% in early trading after creating a new class of non-voting shares. The shares would let it sell stock to pay for as much as $145 billion of AI spending without loosening Mark Zuckerberg's control of the company. Investors treated the plan, which hands holders one new share for each they own starting in January 2027, as a dilution threat, and the stock reversed a gain of about 3% in late trading Wednesday. That outweighed a revenue beat of about $65 billion, and a $35 billion quarter of capital spending pushed Meta's free cash flow below zero. Google parent Alphabet and rocket maker SpaceX each fell 2.2%, the S&P 500 dropped 1% and the Nasdaq-100 lost 1.7%, erasing Wednesday's rebound. High-beta stocks took the brunt: the tenth of the market most sensitive to market moves fell 3%, while the least sensitive tenth gained 0.2%. The high-beta group is now down about 9% over the past four weeks.
Supply bottlenecks added to the pain for AI builders. Chip-equipment maker Lam Research sank 7.4% after warning that parts shortages and falling China sales would cap growth this quarter. Chipmaker Nvidia slid 2.1%, contract chipmaker Taiwan Semiconductor lost 3.1% and the semiconductor fund SMH fell 3.1%. The South Korea fund EWY fell 3%, with memory makers Samsung and SK Hynix down 1.3% and 1.9%. In Sydney, data-center operator NextDC plunged about 40% on Wednesday after its utility pushed power upgrades at a Melbourne site to at least February 2027 amid community opposition, forcing the company to cut its earnings forecast by a third. Earnings added to the losses. Computing giant IBM fell 5.1% on flat consulting revenue and a profit-margin miss despite beating estimates, electric-car maker Tesla dropped 3.4% after operating income fell 56%, and toolmaker Snap-on tumbled 10.6% on a revenue miss. Hedge funds are pressing bets against stocks. Goldman Sachs's prime brokerage says short sales outpaced purchases five to one this month, pushing those bets near five-year highs. Only about one in ten big companies reporting this season has gotten a solid lift from its own results, versus a third at this point in past seasons.
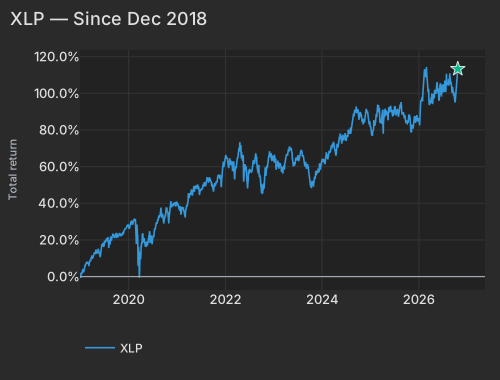
The U.S. ordered non-emergency diplomats out of Saudi Arabia after deadly Houthi strikes on an airport in Dammam and a Saudi Aramco oilfield. U.S. crude rose 1.8% to nearly $99 a barrel, and Brent reached about $112, its highest since May. Treasurys rallied as traders treated the oil shock as a threat to growth. The 10-year yield fell about a tenth of a percentage point to roughly 5.04%, lifting the long-term Treasury fund TLT 0.9%. Investors moved into safer stocks: the consumer-staples fund XLP rose 1% and is up 9% this month, headed for its second-best month since 2018. The volatility fund VXX gained 4%, gold fell 1.8% to about $4,070 an ounce, and bitcoin dropped 3.1% to roughly $82,000. Next up are weekly jobless claims at 8:30 a.m., expected around 200,000. Earnings follow tonight from data-storage maker Western Digital and gold miner Newmont, and the Fed's rate decision comes next Wednesday.
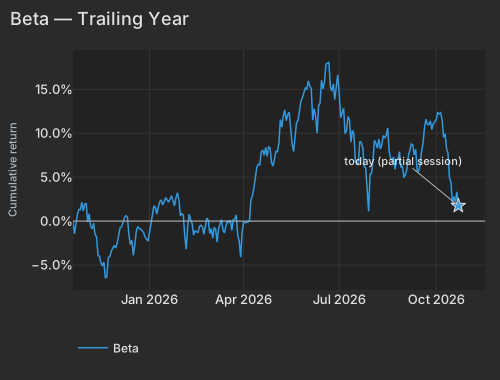
The capital cost of the AI buildout has migrated from credit markets to equity holders, pulling Beta down 1.56% (z=-1.6) and accounting for 47.3% of cross-sectional variance in early trading. Meta Platforms fell 2.7% in early trading on light volume, reversing a 2.8% gain in late trading Wednesday after it beat third-quarter revenue estimates at $64.6BBloomberg. After third-quarter capital expenditures of $34.9B pushed free cash flow to negative $2.1B, Meta declared one non-voting Class C share per existing share—effective January 19, 2027—allowing the company to sell equity for data centers and acquisitions without diluting CEO Mark Zuckerberg's 60.6% voting control, according to Bloomberg and ActuIA reports on October 21Bloomberg. Alphabet and SpaceX each fell 2.2%.
| Factor | Return | Z-Score | 5d Z | 20d Z | 63d Z | Category | Direction |
|---|---|---|---|---|---|---|---|
| Beta | -1.56% | -1.6 | -1.2 | -2.2 | -0.6 | Style-Risk | High-beta laggards |
| Morning Activity | -0.12% | -1.0 | -1.3 | -1.8 | +1.2 | Style-Flow | Morning-heavy laggards |
| Gold | -0.28% | -0.9 | -0.5 | -0.7 | +0.8 | Thematic | Gold-exposed laggards |
| Bitcoin / Crypto | -0.18% | -0.6 | -0.4 | -0.5 | +1.1 | Thematic | Crypto-beta laggards |
| Leverage | +0.09% | +0.6 | -0.2 | -1.8 | -3.8 | Style | Indebted leaders |
| Short-Term Momentum | +0.14% | +0.5 | +0.2 | +1.5 | -3.2 | Style-Momentum | 5-day winners lead |
| Semiconductors | -0.18% | -0.3 | -0.2 | -1.3 | -1.4 | Thematic | Semis laggards |
| Long-Term Momentum | -0.07% | -0.1 | +0.2 | -0.4 | -0.5 | Style-Momentum | 12m winners flat |
Physical bottlenecks are compounding the financing constraints across AI infrastructure. Lam Research fell 7.4% on light volume after warning that component supply shortages and a sequential drop in China revenue would cap December-quarter growthSEC, while the South Korea ETF (EWY) fell 3.0%, with Samsung Electronics down 1.3% and SK Hynix down 1.9%Economic Times. In Australia, data-center operator NextDC plunged 39.5% on Wednesday in Sydney after local utility Jemena pushed power upgrades at its Melbourne M3 site to at least February 2027 due to community opposition, forcing NextDC to defer about A$140M of contracted revenue and cut full-year earnings guidance by a third, CNBC and Bloomberg reported. In the U.S. cross-section, the factor decomposition shows the selling is driven by market sensitivity rather than a fresh leg of credit or sector distress: Nvidia (-2.1%) and Taiwan Semiconductor (-3.1%) moved entirely on their Beta exposures (stock-specific returns of +0.5% and +0.04%), and Leverage rose 0.09% (z=+0.6), pausing its 63-day decline of 4.43% (z=-3.8).
| Bucket | Ret 1D Pct | Ret 5D Norm Pct | Ret 20D Norm Pct | Ret 63D Norm Pct |
|---|---|---|---|---|
| 1 | 0.61 | 1.28 | 1.49 | 0.84 |
| 2 | 0.37 | 0.75 | 0.95 | 0.91 |
| 3 | 0.06 | 0.83 | 0.65 | 0.12 |
| 4 | 0.22 | 1.04 | 0.76 | 0.32 |
| 5 | -0.04 | 1.11 | 1.10 | 0.53 |
| 6 | -0.23 | 0.90 | 0.74 | 0.54 |
| 7 | -0.46 | 1.24 | 0.35 | 0.23 |
| 8 | -0.84 | 1.51 | 0.49 | 0.18 |
| 9 | -0.63 | 1.50 | 0.44 | -0.02 |
| 10 | -0.47 | 1.32 | 0.16 | -0.28 |
| 11 | -1.01 | 1.18 | 0.14 | -0.34 |
| 12 | -0.88 | 1.64 | 0.64 | -0.16 |
| 13 | -1.17 | 0.70 | -0.18 | 0.02 |
| 14 | -0.88 | 1.32 | 0.18 | 0.37 |
| 15 | -1.62 | 1.00 | 0.05 | -0.04 |
| 16 | -2.21 | 0.64 | -0.73 | -1.01 |
| 17 | -2.29 | 0.67 | -1.44 | -0.80 |
| 18 | -3.07 | 0.15 | -1.75 | -0.53 |
| 19 | -2.94 | -0.08 | -3.58 | -1.00 |
| 20 | -4.40 | -1.14 | -5.22 | -2.46 |
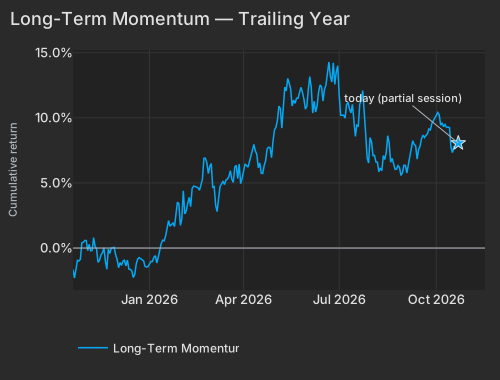
Over the trailing year, Beta has surrendered about three-quarters of its spring-summer rally while 12-month momentum—Long-Term Momentum in the table—has retained the majority of its advance. From their shared peak on June 22, cumulative trailing-year returns for Beta have dropped from +18.1% to +1.75% (with the completed 20-day loss of 9.21% sitting in the 1.1st percentile since 2020), whereas 12-month momentum has eased from +14.3% to +8.06%. Today's early trading reinforces that split: the top 50 high-beta momentum names fell 4.6% (and the broader ~130-name high-beta momentum cohort lost 3.4%) while stocks outside both screens slipped just 0.4%, yet pure 12-month momentum was essentially flat at -0.07% (z=-0.1). Bitcoin fell 3.1% to $81,788.50 at 7:25 AM ET CNBC, pulling Bitcoin / Crypto down 0.18% (z=-0.6) as crypto financials (median -4.0%), treasury holders (-5.4%), and AI-hosting miners (-3.7%) fell together.
| Date | Cumret Pct |
|---|---|
| 2025-10-21 | -0.11 |
| 2025-10-23 | -0.35 |
| 2025-10-28 | 1.30 |
| 2025-10-30 | 1.15 |
| 2025-11-04 | -0.11 |
| 2025-11-06 | -0.58 |
| 2025-11-11 | -1.53 |
| 2025-11-13 | -3.92 |
| 2025-11-18 | -5.09 |
| 2025-11-20 | -6.48 |
| 2025-11-25 | -4.09 |
| 2025-11-28 | -2.77 |
| 2025-12-03 | -1.67 |
| 2025-12-05 | -0.67 |
| 2025-12-10 | 0.62 |
| 2025-12-12 | -1.54 |
| 2025-12-17 | -3.89 |
| 2025-12-22 | -0.62 |
| 2025-12-24 | -0.90 |
| 2025-12-30 | -2.07 |
| 2026-01-02 | -0.33 |
| 2026-01-07 | 1.55 |
| 2026-01-09 | 1.59 |
| 2026-01-14 | 1.85 |
| 2026-01-16 | 2.69 |
| 2026-01-22 | 2.88 |
| 2026-01-26 | 1.74 |
| 2026-01-29 | 2.46 |
| 2026-02-02 | 0.84 |
| 2026-02-05 | -3.20 |
| 2026-02-09 | 0.77 |
| 2026-02-12 | -1.58 |
| 2026-02-17 | -1.29 |
| 2026-02-20 | -0.65 |
| 2026-02-25 | 0.35 |
| 2026-02-27 | -1.41 |
| 2026-03-04 | -0.71 |
| 2026-03-06 | -2.39 |
| 2026-03-11 | 0.18 |
| 2026-03-13 | -1.33 |
| 2026-03-18 | -0.16 |
| 2026-03-20 | -1.05 |
| 2026-03-25 | 0.70 |
| 2026-03-27 | -2.27 |
| 2026-04-01 | -0.11 |
| 2026-04-06 | -0.11 |
| 2026-04-09 | 2.89 |
| 2026-04-13 | 4.77 |
| 2026-04-16 | 6.40 |
| 2026-04-20 | 8.09 |
| 2026-04-23 | 7.37 |
| 2026-04-28 | 6.63 |
| 2026-04-30 | 7.21 |
| 2026-05-05 | 8.84 |
| 2026-05-07 | 10.69 |
| 2026-05-12 | 11.43 |
| 2026-05-14 | 12.40 |
| 2026-05-19 | 7.93 |
| 2026-05-21 | 11.20 |
| 2026-05-27 | 14.07 |
| 2026-05-29 | 15.15 |
| 2026-06-03 | 15.38 |
| 2026-06-05 | 11.49 |
| 2026-06-10 | 10.00 |
| 2026-06-12 | 13.44 |
| 2026-06-17 | 15.86 |
| 2026-06-22 | 18.11 |
| 2026-06-25 | 15.61 |
| 2026-06-30 | 16.64 |
| 2026-07-02 | 11.77 |
| 2026-07-08 | 10.31 |
| 2026-07-10 | 11.53 |
| 2026-07-15 | 9.92 |
| 2026-07-17 | 6.44 |
| 2026-07-22 | 8.94 |
| 2026-07-24 | 6.22 |
| 2026-07-29 | 1.11 |
| 2026-07-31 | 5.42 |
| 2026-08-05 | 8.85 |
| 2026-08-07 | 9.34 |
| 2026-08-12 | 9.74 |
| 2026-08-14 | 9.77 |
| 2026-08-19 | 7.11 |
| 2026-08-21 | 7.30 |
| 2026-08-26 | 7.07 |
| 2026-08-31 | 6.28 |
| 2026-09-02 | 5.27 |
| 2026-09-08 | 8.77 |
| 2026-09-10 | 7.52 |
| 2026-09-15 | 5.62 |
| 2026-09-17 | 7.92 |
| 2026-09-22 | 11.60 |
| 2026-09-24 | 10.99 |
| 2026-09-29 | 11.09 |
| 2026-10-01 | 11.56 |
| 2026-10-06 | 12.33 |
| 2026-10-08 | 9.55 |
| 2026-10-13 | 7.73 |
| 2026-10-15 | 4.44 |
| 2026-10-20 | 2.21 |
| 2026-10-22 | 1.75 |
| Date | Cumret Pct |
|---|---|
| 2025-10-21 | -1.65 |
| 2025-10-23 | -1.65 |
| 2025-10-28 | -0.87 |
| 2025-10-30 | 0.44 |
| 2025-11-04 | -0.20 |
| 2025-11-06 | -0.21 |
| 2025-11-11 | 0.14 |
| 2025-11-13 | -1.09 |
| 2025-11-18 | -0.36 |
| 2025-11-20 | -0.97 |
| 2025-11-25 | -0.42 |
| 2025-11-28 | 0.05 |
| 2025-12-03 | -1.51 |
| 2025-12-05 | -1.32 |
| 2025-12-10 | -1.37 |
| 2025-12-12 | -1.62 |
| 2025-12-17 | -2.26 |
| 2025-12-22 | -0.84 |
| 2025-12-24 | -0.84 |
| 2025-12-30 | -1.45 |
| 2026-01-02 | -1.03 |
| 2026-01-07 | -0.58 |
| 2026-01-09 | -0.68 |
| 2026-01-14 | 0.60 |
| 2026-01-16 | 0.94 |
| 2026-01-22 | 1.80 |
| 2026-01-26 | 1.65 |
| 2026-01-29 | 3.39 |
| 2026-02-02 | 2.26 |
| 2026-02-05 | 2.85 |
| 2026-02-09 | 3.89 |
| 2026-02-12 | 4.75 |
| 2026-02-17 | 4.63 |
| 2026-02-20 | 5.29 |
| 2026-02-25 | 6.56 |
| 2026-02-27 | 6.26 |
| 2026-03-04 | 4.72 |
| 2026-03-06 | 2.80 |
| 2026-03-11 | 4.92 |
| 2026-03-13 | 4.87 |
| 2026-03-18 | 5.50 |
| 2026-03-20 | 5.28 |
| 2026-03-25 | 6.35 |
| 2026-03-27 | 6.45 |
| 2026-04-01 | 5.99 |
| 2026-04-06 | 6.21 |
| 2026-04-09 | 7.46 |
| 2026-04-13 | 7.45 |
| 2026-04-16 | 6.53 |
| 2026-04-20 | 5.72 |
| 2026-04-23 | 7.61 |
| 2026-04-28 | 6.94 |
| 2026-04-30 | 9.07 |
| 2026-05-05 | 10.89 |
| 2026-05-07 | 9.21 |
| 2026-05-12 | 12.06 |
| 2026-05-14 | 12.67 |
| 2026-05-19 | 11.36 |
| 2026-05-21 | 11.50 |
| 2026-05-27 | 11.97 |
| 2026-05-29 | 10.67 |
| 2026-06-03 | 13.16 |
| 2026-06-05 | 10.37 |
| 2026-06-10 | 10.92 |
| 2026-06-12 | 12.52 |
| 2026-06-17 | 12.20 |
| 2026-06-22 | 14.28 |
| 2026-06-25 | 14.22 |
| 2026-06-30 | 14.00 |
| 2026-07-02 | 10.20 |
| 2026-07-08 | 11.01 |
| 2026-07-10 | 10.68 |
| 2026-07-15 | 9.80 |
| 2026-07-17 | 9.44 |
| 2026-07-22 | 11.32 |
| 2026-07-24 | 10.71 |
| 2026-07-29 | 6.53 |
| 2026-07-31 | 8.15 |
| 2026-08-05 | 6.61 |
| 2026-08-07 | 5.86 |
| 2026-08-12 | 7.10 |
| 2026-08-14 | 7.35 |
| 2026-08-19 | 6.58 |
| 2026-08-21 | 6.48 |
| 2026-08-26 | 6.33 |
| 2026-08-31 | 5.78 |
| 2026-09-02 | 6.35 |
| 2026-09-08 | 7.48 |
| 2026-09-10 | 7.96 |
| 2026-09-15 | 7.57 |
| 2026-09-17 | 8.41 |
| 2026-09-22 | 8.65 |
| 2026-09-24 | 9.15 |
| 2026-09-29 | 9.75 |
| 2026-10-01 | 10.18 |
| 2026-10-06 | 9.44 |
| 2026-10-08 | 9.31 |
| 2026-10-13 | 9.29 |
| 2026-10-15 | 7.73 |
| 2026-10-20 | 7.68 |
| 2026-10-22 | 8.06 |
Earnings reactions in early tradingReporters worth over $100 billion, or moving more than 10% with a value above $5 billion
| Company | Move | Stock-specific | Market cap | Revenue YoY | Margin YoY | What drove it |
|---|---|---|---|---|---|---|
| Lam Research LRCX | -7.4% light volume | -2.7% | $326B | +54% | +5.6 pts operating | Component bottlenecks and China revenue drop cap guidance SEC |
| IBM IBM | -5.1% light volume | -4.9% | $237B | +5% | +0.7 pts adj. pre-tax | Flat consulting revenue and gross margin miss |
| Tesla TSLA | -3.4% light volume | -0.3% | $1.5T | -0.2% | -3.2 pts operating | Revenue miss and 56% operating income drop WSJ |
| Meta Platforms META | -2.7% light volume | -0.6% | $1.8T | +26% | -20.0 pts operating | AI capex hike, $9.9B legal charge, Class C dilution Bloomberg |
| Texas Instruments TXN | -0.7% light volume | +1.6% | $260B | +28% | +12.4 pts operating | — |
| Lockheed Martin LMT | +3.7% light volume | +2.9% | $127B | +11% | -0.1 pts adj. operating | — |
| Spotify Technology SPOT | +4.8% | +4.7% | $108B | — | — | — |
Stock-specific: the part of a stock's move not explained by the market, style or thematic (industry and theme) factors in the FactorPulse risk model.
Revenue and margin from the company's earnings release, year over year; margin change in percentage points; — where the release is not parsed or the figures failed checks.
Light volume: the company's earnings filing confirms the report, but trading volume has not caught up yet, so the move is an early read.
Of the 500 largest companies, 92 have reported (23% of market cap), on day 16 of the season.
How earnings reactions split, day 16 of the seasonThe 500 largest US companies with a confirmed earnings reaction so far (73), vs the same day in the past eight seasons and in four-season stretches back to mid-2020

| Season | ≤ −5σ | −5 to −2σ | −2 to 0σ | 0 to 2σ | 2 to 5σ | ≥ 5σ |
|---|---|---|---|---|---|---|
| This season | 4% | 21% | 32% | 32% | 10% | 2% |
| Past 8 seasons | 14% | 22% | 15% | 16% | 18% | 15% |
| Q2 2026 | 14% | 26% | 15% | 14% | 15% | 16% |
| Q1 2026 | 15% | 20% | 15% | 21% | 15% | 14% |
| Q4 2025 | 14% | 26% | 21% | 12% | 17% | 11% |
| Q3 2025 | 6% | 23% | 14% | 18% | 16% | 23% |
| Q2 2025 | 18% | 26% | 16% | 14% | 14% | 13% |
| Q1 2025 | 19% | 8% | 21% | 18% | 30% | 5% |
| Q4 2024 | 6% | 20% | 14% | 15% | 30% | 15% |
| Q3 2024 | 17% | 22% | 10% | 16% | 15% | 19% |
| Q3 '23–Q2 '24 | 13% | 21% | 17% | 13% | 21% | 15% |
| Q3 '22–Q2 '23 | 11% | 21% | 18% | 17% | 22% | 11% |
| Q3 '21–Q2 '22 | 16% | 18% | 12% | 21% | 25% | 8% |
| Q3 '20–Q2 '21 | 6% | 27% | 21% | 24% | 17% | 5% |
σ: a stock's earnings-day stock-specific move divided by its typical daily stock-specific move over the past year. Each bar is cut at the same business day of the season; companies weighted by the square root of market cap.
Hedge-fund positioning has pivoted from liquidating tech longs to pressing shorts, removing the natural buyer base for third-quarter earnings beats. Goldman Sachs Prime Brokerage data reported by Bloomberg on October 22 (covering flows through October 21 at the latest) showed global short sales outpacing long purchases roughly 5-to-1 this month, driving short leverage to the 99th percentile of the past five years while fundamental net leverage fell near a three-year lowBloomberg. That follows the five sessions through October 15, when funds cut technology exposure at the fastest pace since 2016 to a 23.5% net allocation and overall net leverage hit a one-year low of 48.6%, according to Goldman Sachs Prime Brokerage data reported October 20. Bloomberg also reported on October 21 that Barclays and Goldman Sachs encouraged hedge-fund clients to add shorts to conserve scarce prime-financing capacityBloomberg. In our factor lenses, Short Interest (z=0.0) and Short-Sale Activity (z=+0.2) sit flat this morning, indicating the short-squeeze risk Goldman flagged has not been triggered.
With institutional net exposure compressed, companies beating third-quarter consensus are failing to attract follow-through buying. Across 73 earnings reactions so far this season among the 500 largest US companies, only 11% have risen 2σ or more on a stock-specific basis—below every one of the past eight seasons at this point (33% average)—while 25% have fallen at least 2σ. IBM dropped 5.1% (-4.9% stock-specific) on light volume after flat consulting revenue of $5.3B and a 58.5% gross margin miss overshadowed a third-quarter EPS and revenue beat, while Tesla fell 3.4% on light volume as a 56% drop in operating income to $718M offset an adjusted EPS beat of $0.48 and CEO Elon Musk's target for commercial Optimus robot sales next yearWSJ. Outside the earnings panel, Snap-on tumbled 10.6% (-9.8% stock-specific) after third-quarter revenue of $1.18B missed estimates on mobile-van inventory destocking, whereas Procter & Gamble gained 2.3% on 4% organic sales growth and Biohaven surged 32.5% (+33.8% stock-specific) after the FDA accepted its NDA resubmission for Vyglxia in spinocerebellar ataxia.
Escalating conflict in the Middle East drove a simultaneous bid for crude oil and sovereign duration. Front-month WTI crude gained 1.8% to $98.86 a barrel at 7:14 AM ET CNBC and Brent reached $112.40—its highest level since MayEconomic Times—after the U.S. State Department ordered non-emergency personnel to depart Saudi Arabia on October 21 following fatal Houthi strikes on Dammam's airport and Aramco's Shaybah oilfield, according to AP and CNBC reports. The 10-year Treasury yield fell 11.0 bps to 5.036% at 7:24 AM ET CNBC and the 2-year yield dropped 10.0 bps to 4.723% CNBC, lifting the 20+ Year Treasury ETF (TLT) 0.9%. Over the past 10 sessions through Wednesday's close, the oil ETF (USO) rose 11.0% while the 10-year yield fell 13.1 bps, flipping their 20-day relationship to the 1st percentile since 2019 as traders price energy supply shocks as a drag on growth rather than a purely inflationary impulse.
| ETF | Theme | Today | 1d Ago | 5d Ago | 20d Ago | 63d Ago |
|---|---|---|---|---|---|---|
| VXX | Volatility | +4.0% | -1.0% | +1.1% | -0.6% | -22.8% |
| USO | Oil | +1.5% | -0.5% | +4.1% | +7.4% | +14.6% |
| XLP | Consumer Staples | +1.0% | -0.7% | +1.2% | +5.7% | +5.4% |
| TLT | Long-Term Bonds | +0.9% | +0.1% | +1.7% | +0.1% | -2.4% |
| XLE | Energy | +0.8% | +0.3% | +0.8% | +9.3% | +15.5% |
| SPY | Large Cap | -1.0% | +0.5% | +0.5% | +0.7% | +5.0% |
| QQQ | Large Cap Growth | -1.7% | +1.1% | -0.5% | -2.2% | +4.9% |
| AIPO | AI Power Infrastructure | -2.9% | +2.2% | -2.8% | -9.7% | -14.6% |
| SMH | Semiconductors | -3.1% | +1.9% | -1.4% | -7.4% | -4.1% |
| DRAM | Memory Chips & Storage | -3.9% | +3.0% | -2.0% | -20.6% | -15.7% |
Defensive stocks led: the Consumer Staples fund XLP rose 1.0%, taking its month-to-date gain to 9.0%—its second-best month since late 2018—while gold spot fell 1.8% to $4,067.54 an ounce at 7:24 AM ET CNBC and the U.S. Dollar Index held at 101.757 (-0.02%) CNBC. Ahead of next Wednesday's FOMC decision federalreserve.gov, markets look to tonight's after-close earnings from Western Digital (WDC), Newmont (NEM), and Bloom Energy (BE), followed by American Express (AXP) and SLB before Friday's open.
| Date | Ret Pct |
|---|---|
| 2018-12-31 | 0.42 |
| 2019-01-29 | 2.97 |
| 2019-02-27 | 6.94 |
| 2019-03-26 | 10.66 |
| 2019-04-24 | 12.99 |
| 2019-05-22 | 14.82 |
| 2019-06-19 | 16.99 |
| 2019-07-18 | 20.85 |
| 2019-08-15 | 19.26 |
| 2019-09-12 | 22.99 |
| 2019-10-10 | 22.73 |
| 2019-11-07 | 22.53 |
| 2019-12-05 | 25.81 |
| 2020-01-06 | 27.00 |
| 2020-02-03 | 28.36 |
| 2020-03-03 | 22.43 |
| 2020-03-31 | 11.32 |
| 2020-04-28 | 21.01 |
| 2020-05-27 | 19.86 |
| 2020-06-24 | 19.27 |
| 2020-07-22 | 27.68 |
| 2020-08-19 | 32.37 |
| 2020-09-17 | 32.39 |
| 2020-10-14 | 36.98 |
| 2020-11-11 | 38.39 |
| 2020-12-10 | 39.17 |
| 2021-01-08 | 39.79 |
| 2021-02-08 | 37.93 |
| 2021-03-08 | 35.78 |
| 2021-04-06 | 45.24 |
| 2021-05-04 | 46.61 |
| 2021-06-01 | 48.25 |
| 2021-06-29 | 46.79 |
| 2021-07-28 | 50.19 |
| 2021-08-24 | 52.18 |
| 2021-09-22 | 49.63 |
| 2021-10-20 | 50.69 |
| 2021-11-16 | 54.73 |
| 2021-12-15 | 61.63 |
| 2022-01-12 | 64.40 |
| 2022-02-10 | 61.77 |
| 2022-03-11 | 53.03 |
| 2022-04-07 | 68.68 |
| 2022-05-06 | 65.08 |
| 2022-06-06 | 58.91 |
| 2022-07-05 | 57.69 |
| 2022-08-02 | 62.17 |
| 2022-08-30 | 59.44 |
| 2022-09-27 | 48.84 |
| 2022-10-25 | 55.04 |
| 2022-11-22 | 65.66 |
| 2022-12-20 | 63.07 |
| 2023-01-20 | 59.56 |
| 2023-02-16 | 59.82 |
| 2023-03-17 | 58.44 |
| 2023-04-17 | 67.02 |
| 2023-05-12 | 70.25 |
| 2023-06-12 | 61.35 |
| 2023-07-12 | 63.90 |
| 2023-08-08 | 66.13 |
| 2023-09-06 | 58.84 |
| 2023-10-04 | 53.09 |
| 2023-10-31 | 51.90 |
| 2023-11-29 | 56.60 |
| 2023-12-27 | 62.04 |
| 2024-01-26 | 63.80 |
| 2024-02-26 | 67.97 |
| 2024-03-22 | 71.83 |
| 2024-04-22 | 70.72 |
| 2024-05-20 | 76.45 |
| 2024-06-17 | 76.47 |
| 2024-07-17 | 80.21 |
| 2024-08-14 | 81.88 |
| 2024-09-11 | 89.57 |
| 2024-10-09 | 87.63 |
| 2024-11-06 | 83.05 |
| 2024-12-04 | 89.72 |
| 2025-01-03 | 81.60 |
| 2025-02-03 | 83.82 |
| 2025-03-04 | 90.34 |
| 2025-04-01 | 90.62 |
| 2025-04-29 | 89.33 |
| 2025-05-28 | 90.59 |
| 2025-06-26 | 88.11 |
| 2025-07-24 | 90.90 |
| 2025-08-21 | 93.51 |
| 2025-09-19 | 86.26 |
| 2025-10-16 | 85.89 |
| 2025-11-13 | 82.68 |
| 2025-12-11 | 86.18 |
| 2026-01-12 | 90.96 |
| 2026-02-10 | 107.56 |
| 2026-03-10 | 104.16 |
| 2026-04-08 | 98.26 |
| 2026-05-06 | 101.76 |
| 2026-06-03 | 96.78 |
| 2026-07-02 | 104.98 |
| 2026-07-31 | 105.12 |
| 2026-08-27 | 105.19 |
| 2026-09-25 | 99.22 |
| 2026-10-22 | 113.34 |
Initial Claims are due at 8:30 AM ET, with consensus forecasting a slight uptick to 200,000 for the week ending October 17 from the prior 199,000 print, alongside continuing claims rising to 1,720,000 dol.gov. Economists point to a low-hire, low-fire labor market where average unemployment duration has reached 11.5 weeks and weekly layoffs remain muted despite September's weak 29,000 nonfarm payroll gain bls.gov.
Variance decomposition: live intraday — 20261022 session, bracketed against its trailing-year range. Factor returns are trailing through last close. Total cross-sectional dispersion: 15%ile of the past year.
Variance mix — % of total, today vs 1d ago vs 1-yr avg
market 93.6%ile style 96.4%ile thematic 7.6%ile idiosyncratic 1.2%ile
Variance explained — today vs. factor's trailing-year range
Marker = the factor's share of today's total variance, placed in its own trailing-year range (box 25–75%ile, ticks 90%ile and max). Amber marker = unusually load-bearing today (≥90%ile of its own year). Factor name green = up today / red = down.
Correlation & dispersion — realized vs implied
Pairwise realized correlation (20d): 11.22% 13%ile since 2020 · 98.4%ile 3m
Top-500 pairwise: 12.93% 17%ile since 2020 · 87%ile 3m · implied (Cboe COR1M): 8.40 2.2%ile since 2006 (gap +4.5pp)
Realized 20d vol (ann. pts): all stocks 37 vs VIXEQ 41 · index 11 vs VIX 18 · style factors 19 70%ile
20-day window (19 completed days + today); percentiles vs model history since 2020; '3m' tokens rank vs the trailing 63 trading days; definitions in Terms below. Implied prints (Cboe) are delayed ~15 min. as of 07:21 ET
Top 50 high-beta momentum names (eq-wt, since-2020 rank): -4.6% 5.4%ile · rest of market -0.4%
| Factor | Today | 1d | 5d | 20d | 60d |
|---|---|---|---|---|---|
| Style-Risk | |||||
| Beta | -1.56% z-1.6 | +1.12% | -2.66% | -9.21% | +0.66% |
| International | -0.14% z-0.5 | -0.09% | -0.14% | -0.26% | -0.01% |
| Residual Volatility | -0.11% z-0.2 | +0.09% | -0.48% | -0.62% | +4.82% |
| Style | |||||
| Leverage | +0.09% z+0.6 | +0.01% | -0.09% | -1.33% | -4.43% |
| Size | -0.14% z-0.4 | +0.16% | -0.14% | +0.87% | +3.93% |
| Value | -0.07% z-0.3 | -0.27% | -0.34% | +0.40% | -0.26% |
| Growth | -0.05% z-0.2 | -0.07% | -0.34% | +0.12% | +0.53% |
| Liquidity | +0.05% z+0.2 | -0.05% | -0.17% | -0.74% | +3.59% |
| Dividend Yield | +0.02% z+0.1 | +0.06% | +0.15% | -0.97% | -0.20% |
| Profitability | -0.02% z-0.1 | -0.05% | -0.06% | +1.63% | -0.47% |
| Style-Momentum | |||||
| Short-Term Momentum | +0.14% z+0.5 | -0.28% | +0.17% | +1.47% | -3.22% |
| Medium-Term Momentum | +0.12% z+0.4 | +0.27% | +0.52% | -0.38% | -0.14% |
| One-Day Momentum | -0.05% z-0.2 | +0.19% | -0.08% | -0.02% | -3.76% |
| Long-Term Momentum | -0.07% z-0.1 | +0.46% | +0.34% | -1.08% | +1.54% |
| Style-Positioning | |||||
| Hedge-Fund Ownership | -0.02% z-0.2 | -0.30% | -0.16% | -0.21% | -0.29% |
| Short Interest | -0.00% z-0.0 | -0.07% | +0.21% | +0.01% | -1.95% |
| Style-Flow | |||||
| Morning Activity | -0.12% z-1.0 | -0.03% | -0.37% | -1.00% | +0.81% |
| Short-Sale Activity | +0.02% z+0.2 | +0.10% | +0.11% | +0.07% | +0.92% |
| Thematic | |||||
| Gold | -0.28% z-0.9 | +0.00% | -0.39% | -1.01% | +2.22% |
| Bitcoin / Crypto | -0.18% z-0.6 | +0.27% | -0.27% | -0.69% | +2.35% |
| Semiconductors | -0.18% z-0.3 | +0.47% | -0.21% | -3.48% | -1.59% |
| Treasury (Duration) | +0.09% z+0.3 | -0.12% | +0.07% | -0.79% | -3.31% |
| China | -0.05% z-0.1 | -0.37% | -0.29% | -0.15% | -0.08% |
| Oil | +0.00% z+0.0 | +0.33% | +0.31% | -0.07% | +5.88% |
5/20/60d windows include today's session; 1d is the previous session.
Market variance share. The fraction of cross-sectional variance explained by the market factor — the attribution companion to pairwise correlation, not a substitute for it.
Factor z-score. Today's factor return divided by its daily-return standard deviation over ~1,600 trading days.
High-beta momentum cohort. US names above $2B market cap in the top quintile of both raw beta and 12-month momentum; membership frozen at each month's first business day. “Top 50” = the 50 strongest by combined rank.
Stock-specific (idiosyncratic) return. The part of a stock's move not explained by the market, style or thematic (industry and theme) factors in the FactorPulse risk model.
Data compiled by FactorPulse AI; edited and verified by Jeff Klein. For informational purposes only. Does not constitute financial advice, an investment recommendation, or an offer to buy or sell any securities. Always consult a qualified financial professional before making investment decisions.
For more on factor construction methodology, see www.factorpulse.com/glossary.
← FactorPulse · All Digests · Follow us on X
FactorPulse is free during launch · Sign up free (no credit card)