
Worries about the cost of the AI build-out hit Wall Street's biggest technology names on Thursday, pulling the Nasdaq-100 down about 3% and the S&P 500 down about 1.4% by mid-afternoon. Facebook parent Meta sank 8%, erasing roughly $144 billion in market value, after a $135 billion to $145 billion AI spending plan pushed its third-quarter free cash flow to a deficit of about $2 billion and the cost of insuring its debt against default rose to a record. Chip-equipment maker Lam Research tumbled nearly 12% after warning that component shortages would hold back $300 million to $400 million of shipments and that its China sales would decline. Chipmaker AMD fell 8%, Nvidia lost 4.5%, the semiconductor fund SMH dropped 6%, and Amazon, which raised its 2026 spending forecast to about $220 billion in July, fell 5%.
Investors piled into government bonds, driving the 10-year Treasury yield down about 20 basis points to roughly 4.95%, amid AI credit jitters and a widening of the gap between French and German borrowing costs to a 15-year high. Falling rates sent the homebuilder fund ITB up 5%, the regional-bank fund KRE up 2.5% and the consumer-staples fund XLP up 3%, led by a 6% jump in Tide maker Procter & Gamble after its earnings beat on 4% sales growth. More than half of U.S. stocks were higher even as the big indexes fell. Oil climbed, with Brent crude up about 3% to $112 a barrel after the State Department ordered nonessential staff out of Saudi Arabia following Houthi strikes, while gold slid nearly 3% to about $4,030 an ounce and Bitcoin fell about 4% to roughly $81,000. Weekly jobless claims fell to a three-month low of 194,000 ahead of the Federal Reserve's decision next Wednesday.
Hedge funds are pulling back, according to Goldman Sachs prime-brokerage data showing their bets against stocks near the top of a five-year range, and the selling landed hardest on the high-beta stocks that had led the market for much of the year: the 50 stocks most sensitive to market moves that had also been the biggest winners fell about 11%, on pace for one of their five worst days since 2020. In earnings, Tesla slipped nearly 3% after its operating income fell 56%, it cut its 2026 spending plan to $20 billion and it floated a possible combination with SpaceX, which dropped about 9%. Telecom-equipment maker Nokia fell 15% after lowering its cash-flow outlook, while Spotify rose 10% on stronger subscriber growth and Blackstone gained 7% after its morning report.
Today's factor pattern is consistent with a hedge-fund de-gross, pushing our HF de-risking score to the 99.4th percentile since 2020 so far today (10th highest of 1,671 sessions, compared against full-day history) and the 98.6th percentile over three days. Three of the score's four legs fired today: last week's relative moves continued instead of reverting, 12-month momentum winners fell 1.69%, and the most-shorted stocks rose 0.52%. The most-shorted stocks' gains came as Goldman Sachs Prime Brokerage data reported by Bloomberg on October 22 showing hedge funds sold shorts at a 5-to-1 ratio over long buys this month, driving short leverage to the 99th five-year percentile and net leverage near a three-year low as prime brokers including Goldman Sachs and Barclays encouraged clients to add shorts to conserve scarce balance-sheet financingBloomberg.
| Date | Type | Most-Shorted Names Up | 12-Month Winners Down | 13F-Crowded Names Down | Last Week'S Moves Continuing |
|---|---|---|---|---|---|
| 20261002 | B | 0.33 | 0.00 | 1.12 | 0.78 |
| 20261005 | — | 0.26 | 0.21 | 0.00 | 0.00 |
| 20261006 | B | 0.23 | 1.05 | 0.88 | 1.35 |
| 20261007 | — | 0.39 | 0.00 | 0.00 | 0.00 |
| 20261008 | — | 0.00 | 0.39 | 0.47 | 0.00 |
| 20261009 | — | 0.05 | 0.00 | 0.00 | 0.00 |
| 20261012 | C | 0.70 | 0.29 | 0.00 | 0.55 |
| 20261013 | C | 0.59 | 0.00 | 0.48 | 0.00 |
| 20261014 | B | 0.23 | 0.06 | 0.82 | 0.32 |
| 20261015 | A | 1.10 | 1.99 | 0.00 | 0.93 |
| 20261016 | B | 0.32 | 0.52 | 0.91 | 0.19 |
| 20261019 | C | 0.74 | 0.00 | 0.00 | 0.00 |
| 20261020 | C | 0.80 | 0.13 | 0.00 | 1.10 |
| 20261021 | B | 0.42 | 0.00 | 2.35 | 0.00 |
| 20261022 | A | 1.54 | 2.21 | 0.40 | 2.98 |
The Beta and 12-month momentum factors have now given back 26.5 percentage points since their shared June 22 peak, surpassing the 25.0-point slide from February 2021 to May 2022 as the deepest drawdown since 2020. Beta alone has borne the brunt of the selling: after climbing from -4.1% on March 30 to +18.1% on June 22 and standing at +3.3% at yesterday's close, today's 3.89% drop pushed its trailing-year cumulative return negative (-0.61%) for the first time since April 6. Beta's 10-day return of -10.1% is deeper than any since 2020 except March 2020 (-11.8%) and two earlier windows of this same slide. By contrast, 12-month momentum still holds a +6.42% cumulative gain over the trailing year.
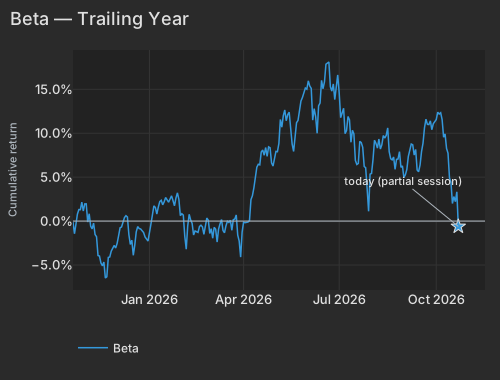
| Date | Cumret Pct |
|---|---|
| 2025-10-21 | -0.11 |
| 2025-10-23 | -0.35 |
| 2025-10-28 | 1.30 |
| 2025-10-30 | 1.15 |
| 2025-11-04 | -0.11 |
| 2025-11-06 | -0.58 |
| 2025-11-11 | -1.53 |
| 2025-11-13 | -3.92 |
| 2025-11-18 | -5.09 |
| 2025-11-20 | -6.48 |
| 2025-11-25 | -4.09 |
| 2025-11-28 | -2.77 |
| 2025-12-03 | -1.67 |
| 2025-12-05 | -0.67 |
| 2025-12-10 | 0.62 |
| 2025-12-12 | -1.54 |
| 2025-12-17 | -3.89 |
| 2025-12-22 | -0.62 |
| 2025-12-24 | -0.90 |
| 2025-12-30 | -2.07 |
| 2026-01-02 | -0.33 |
| 2026-01-07 | 1.55 |
| 2026-01-09 | 1.59 |
| 2026-01-14 | 1.85 |
| 2026-01-16 | 2.69 |
| 2026-01-22 | 2.88 |
| 2026-01-26 | 1.74 |
| 2026-01-29 | 2.46 |
| 2026-02-02 | 0.84 |
| 2026-02-05 | -3.20 |
| 2026-02-09 | 0.77 |
| 2026-02-12 | -1.58 |
| 2026-02-17 | -1.29 |
| 2026-02-20 | -0.65 |
| 2026-02-25 | 0.35 |
| 2026-02-27 | -1.41 |
| 2026-03-04 | -0.71 |
| 2026-03-06 | -2.39 |
| 2026-03-11 | 0.18 |
| 2026-03-13 | -1.33 |
| 2026-03-18 | -0.16 |
| 2026-03-20 | -1.05 |
| 2026-03-25 | 0.70 |
| 2026-03-27 | -2.27 |
| 2026-04-01 | -0.11 |
| 2026-04-06 | -0.11 |
| 2026-04-09 | 2.89 |
| 2026-04-13 | 4.77 |
| 2026-04-16 | 6.40 |
| 2026-04-20 | 8.09 |
| 2026-04-23 | 7.37 |
| 2026-04-28 | 6.63 |
| 2026-04-30 | 7.21 |
| 2026-05-05 | 8.84 |
| 2026-05-07 | 10.69 |
| 2026-05-12 | 11.43 |
| 2026-05-14 | 12.40 |
| 2026-05-19 | 7.93 |
| 2026-05-21 | 11.20 |
| 2026-05-27 | 14.07 |
| 2026-05-29 | 15.15 |
| 2026-06-03 | 15.38 |
| 2026-06-05 | 11.49 |
| 2026-06-10 | 10.00 |
| 2026-06-12 | 13.44 |
| 2026-06-17 | 15.86 |
| 2026-06-22 | 18.11 |
| 2026-06-25 | 15.61 |
| 2026-06-30 | 16.64 |
| 2026-07-02 | 11.77 |
| 2026-07-08 | 10.31 |
| 2026-07-10 | 11.53 |
| 2026-07-15 | 9.92 |
| 2026-07-17 | 6.44 |
| 2026-07-22 | 8.94 |
| 2026-07-24 | 6.22 |
| 2026-07-29 | 1.11 |
| 2026-07-31 | 5.42 |
| 2026-08-05 | 8.85 |
| 2026-08-07 | 9.34 |
| 2026-08-12 | 9.74 |
| 2026-08-14 | 9.77 |
| 2026-08-19 | 7.11 |
| 2026-08-21 | 7.30 |
| 2026-08-26 | 7.07 |
| 2026-08-31 | 6.28 |
| 2026-09-02 | 5.27 |
| 2026-09-08 | 8.77 |
| 2026-09-10 | 7.52 |
| 2026-09-15 | 5.62 |
| 2026-09-17 | 7.92 |
| 2026-09-22 | 11.60 |
| 2026-09-24 | 10.99 |
| 2026-09-29 | 11.09 |
| 2026-10-01 | 11.56 |
| 2026-10-06 | 12.33 |
| 2026-10-08 | 9.55 |
| 2026-10-13 | 7.73 |
| 2026-10-15 | 4.44 |
| 2026-10-20 | 2.21 |
| 2026-10-22 | -0.61 |
The pressure converged on the high-beta momentum cohort, where the top 50 names dropped 10.9% (0.2nd percentile since 2020) and the broader ~190-name group lost 8.6% (sixth-worst day since 2020), while stocks outside both screens rose 1.2%. Because the cohort's exposures correlate negatively with Short-Term Momentum (-0.31) and positively with Beta (+0.43) and 12-month momentum (+0.45), today's +1.05% jump in 5-day trend (z=+3.5; 20-day +2.39%, z=+1.8) while yesterday's winners reverted (-0.28%, z=-1.0) reflects the same multi-week losers continuing to slide. Across our 2,112-stock universe, the median stock rose 0.26% even as the equal-weighted average fell 0.57% and the Nasdaq-100 sank 3.1% — the same split, in one session, that Michael Burry described on October 17 for the months after the March 2000 peak, Benzinga reported.
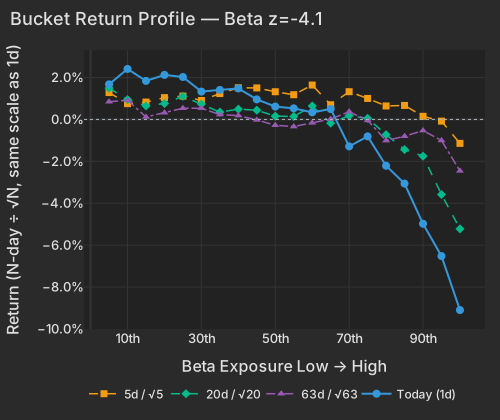
| Bucket | Ret 1D Pct | Ret 5D Norm Pct | Ret 20D Norm Pct | Ret 63D Norm Pct |
|---|---|---|---|---|
| 1 | 1.67 | 1.28 | 1.49 | 0.84 |
| 2 | 2.41 | 0.75 | 0.95 | 0.91 |
| 3 | 1.84 | 0.83 | 0.65 | 0.12 |
| 4 | 2.12 | 1.04 | 0.76 | 0.32 |
| 5 | 2.02 | 1.11 | 1.10 | 0.53 |
| 6 | 1.33 | 0.90 | 0.74 | 0.54 |
| 7 | 1.41 | 1.24 | 0.35 | 0.23 |
| 8 | 1.48 | 1.51 | 0.49 | 0.18 |
| 9 | 0.96 | 1.50 | 0.44 | -0.02 |
| 10 | 0.61 | 1.32 | 0.16 | -0.28 |
| 11 | 0.53 | 1.18 | 0.14 | -0.34 |
| 12 | 0.34 | 1.64 | 0.64 | -0.16 |
| 13 | 0.50 | 0.70 | -0.18 | 0.02 |
| 14 | -1.29 | 1.32 | 0.18 | 0.37 |
| 15 | -0.81 | 1.00 | 0.05 | -0.04 |
| 16 | -2.21 | 0.64 | -0.73 | -1.01 |
| 17 | -3.06 | 0.67 | -1.44 | -0.80 |
| 18 | -4.98 | 0.15 | -1.75 | -0.53 |
| 19 | -6.52 | -0.08 | -3.58 | -1.00 |
| 20 | -9.10 | -1.14 | -5.22 | -2.46 |
Style factors accounted for 60.6% of cross-sectional variance against a 23.1% one-year average (100th percentile of the past year) as falling Treasury yields lifted traditional duration beneficiaries while AI infrastructure stocks tumbled. The 10-year Treasury yield fell 19.7 bps to 4.949%CNBC and the 7-year yield dropped 20.9 bps to 4.844%CNBC as investors sought safety amid AI credit jitters and a widening in French-German 10-year sovereign spreads to a 15-year highBloomberg. That bond rally lifted Treasury (Duration) 1.05% (z=+3.3), boosting long-term Treasuries (TLT +2.0%), homebuilders (ITB +5.2%), and regional banks (KRE +2.5%). Over the 10 sessions through October 21, however, the 10-year yield fell 13.1 bps while the VanEck Semiconductor ETF (SMH, -6.0% today) lost 10.9%, Falling yields and falling chip stocks both read as worries about growth, the link that has held over the past year; the prior 20 sessions, when chips rose as yields fell, were the exception.

| Sym | Fund | Group | Today Pct | Past Year Pct | Tlt Sensitivity |
|---|---|---|---|---|---|
| ITB | Home construction | moved most with Treasuries | 4.78 | -15.50 | 1.38 |
| XHB | Homebuilders | moved most with Treasuries | 2.97 | -11.00 | 1.18 |
| XBI | Biotech | moved most with Treasuries | -1.37 | 39.30 | 0.59 |
| XLU | Utilities | moved most with Treasuries | 1.69 | -5.60 | 0.56 |
| IYR | US real estate | moved most with Treasuries | 1.13 | 1.50 | 0.51 |
| VNQ | REITs | moved most with Treasuries | 1.05 | 3.10 | 0.51 |
| XLRE | Real estate sector | moved most with Treasuries | 0.90 | 2.50 | 0.50 |
| LQD | Corporate bonds | moved most with Treasuries | 1.14 | -3.90 | 0.49 |
| XLV | Health care | moved most with Treasuries | 1.20 | 25.60 | 0.46 |
| XLP | Staples | moved most with Treasuries | 2.81 | 12.40 | 0.43 |
| IGV | Software | moved most against Treasuries | -0.31 | -4.40 | -0.19 |
| MTUM | Momentum stocks | moved most against Treasuries | -3.88 | 18.60 | -0.20 |
| AIPO | AI & power | moved most against Treasuries | -7.12 | 6.50 | -0.28 |
| XLK | Technology | moved most against Treasuries | -3.50 | 31.50 | -0.30 |
| SMH | Chips | moved most against Treasuries | -5.96 | 60.80 | -0.35 |
| BITO | Bitcoin futures | moved most against Treasuries | -3.84 | -26.10 | -0.45 |
| WGMI | Bitcoin miners | moved most against Treasuries | -9.03 | -45.70 | -0.59 |
| XLE | Energy | moved most against Treasuries | -0.86 | 61.30 | -0.59 |
| XOP | Oil producers | moved most against Treasuries | -0.84 | 62.10 | -0.95 |
| USO | Crude oil | moved most against Treasuries | 1.83 | 135.60 | -1.66 |
| Factor | Return | Z-Score | 5d Z | 20d Z | 63d Z | Category | Direction |
|---|---|---|---|---|---|---|---|
| Beta | -3.89% | -4.1 | -2.3 | -2.7 | -0.9 | Style-Risk | High-beta laggards |
| Short-Term Momentum | +1.05% | +3.5 | +1.6 | +1.8 | -1.6 | Style-Momentum | 5-day winners lead |
| Treasury (Duration) | +1.05% | +3.3 | +1.4 | +0.1 | -1.0 | Thematic | Bond-sensitive leaders |
| Gold | -1.02% | -3.2 | -1.6 | -1.2 | +0.5 | Thematic | Gold-exposed laggards |
| Short Interest | +0.52% | +3.1 | +2.0 | +0.7 | -0.3 | Style-Positioning | Most-shorted outperform |
| Semiconductors | -1.58% | -2.6 | -1.2 | -1.8 | -1.7 | Thematic | Semis laggards |
Hyperscalers and semiconductor suppliers are trading on their own balance-sheet demands and physical bottlenecks rather than the risk-free discount rate. Meta Platforms dropped 8.1% (stock-specific -5.9%, erasing $143.9B of market value) as its five-year credit default swaps climbed as much as 8.9 bps to 119.3 bps — the highest since active trading began a year ago — after its $135B–$145B 2026 capital expenditure plan pushed third-quarter free cash flow to a $2.12B deficitBloomberg. Amazon fell 5.0% (stock-specific -2.9%) , having raised its 2026 spending forecast to about $220 billion in July. In hardware, Lam Research tumbled 11.5% (carried -8.2% by style factors and -2.2% stock-specific) after flagging $300M–$400M in December-quarter shipment constraints from component shortages alongside an expected sequential drop in China revenueSEC. Factor pressure pulled Nvidia down 4.5% (style -3.2%) and Advanced Micro Devices down 8.2% (style -9.6%), while Western Digital (-7.2%) and Bloom Energy (-11.0%) slid on their Beta tilts ahead of their after-close earnings reports.
Earnings reactions so far todayReporters worth over $100 billion, or moving more than 10% with a value above $5 billion
| Company | Move | Stock-specific | Market cap | Revenue YoY | Margin YoY | What drove it |
|---|---|---|---|---|---|---|
| Carpenter Technology CRS | -20.1% | -17.0% | $18B | — | — | Q1 revenue missed estimates |
| Graco GGG | -15.8% | -16.4% | $13B | — | — | Q3 EPS and revenue miss; weak Q4 guide Financial Times |
| Nokia NOK | -14.9% | -6.8% | $52B | — | — | Lowered 2026 free cash flow conversion guidance |
| FirstCash FCFS | -14.2% | -12.3% | $9B | — | — | Fell despite a record Q3 beat |
| MSC Industrial Direct Co. Inc. Class A MSM | -13.7% | -12.0% | $7B | — | — | $42M impairment; Q1 margin guide below Q4 |
| Lam Research LRCX | -11.5% | -2.2% | $326B | +54% | +5.6 pts operating | Supply bottlenecks and projected China revenue decline SEC |
| Meta Platforms META | -8.1% | -5.9% | $1.8T | +26% | -20.0 pts operating | Negative FCF, $135B+ AI capex, $9.9B legal reserve Bloomberg |
| Valero Energy VLO | -2.9% light volume | +0.8% | $126B | +43% | +14.8 pts adj. operating | — |
| Tesla TSLA | -2.7% | +0.1% | $1.5T | -0.2% | -3.2 pts operating | Operating income fell 56%; cut 2026 capex The Wall Street Journal |
| Texas Instruments TXN | -0.7% | +3.6% | $260B | +28% | +12.4 pts operating | — |
| IBM IBM | -0.4% | -2.5% | $237B | +5% | +0.7 pts adj. pre-tax | — |
| Union Pacific UNP | +2.9% | +1.8% | $171B | +15% | -0.3 pts adj. operating | — |
| SAP SAP | +3.3% | +2.3% | $269B | — | — | Q3 beat and raised full-year cloud outlook |
| Procter & Gamble PG | +6.0% | +3.9% | $364B | +4% | -0.7 pts adj. operating | Core EPS beat on 4% organic sales growth |
| Lockheed Martin LMT | +6.5% | +3.8% | $127B | +11% | -0.1 pts adj. operating | — |
| Spotify Technology SPOT | +10.4% | +8.8% | $108B | — | — | Subscriber growth and operating income beat guidance |
| Waste Connections WCN | +10.5% | +7.1% | $42B | +7% | +2.7 pts operating | — |
| Pool POOL | +10.9% | +7.1% | $6B | — | — | — |
Stock-specific: the part of a stock's move not explained by the market, style or thematic (industry and theme) factors in the FactorPulse risk model.
Revenue and margin from the company's earnings release, year over year; margin change in percentage points; — where the release is not parsed or the figures failed checks.
Light volume: the company's earnings filing confirms the report, but trading volume has not caught up yet, so the move is an early read.
Of the 500 largest companies, 92 have reported (23% of market cap), on day 16 of the season.
How earnings reactions split, day 16 of the seasonThe 500 largest US companies with a confirmed earnings reaction so far (88), vs the same day in the past eight seasons and in four-season stretches back to mid-2020

| Season | ≤ −5σ | −5 to −2σ | −2 to 0σ | 0 to 2σ | 2 to 5σ | ≥ 5σ |
|---|---|---|---|---|---|---|
| This season | 3% | 23% | 26% | 27% | 17% | 4% |
| Past 8 seasons | 14% | 22% | 15% | 16% | 18% | 15% |
| Q2 2026 | 14% | 26% | 15% | 14% | 15% | 16% |
| Q1 2026 | 15% | 20% | 15% | 21% | 15% | 14% |
| Q4 2025 | 14% | 26% | 21% | 12% | 17% | 11% |
| Q3 2025 | 6% | 23% | 14% | 18% | 16% | 23% |
| Q2 2025 | 18% | 26% | 16% | 14% | 14% | 13% |
| Q1 2025 | 19% | 8% | 21% | 18% | 30% | 5% |
| Q4 2024 | 6% | 20% | 14% | 15% | 30% | 15% |
| Q3 2024 | 17% | 22% | 10% | 16% | 15% | 19% |
| Q3 '23–Q2 '24 | 13% | 21% | 17% | 13% | 21% | 15% |
| Q3 '22–Q2 '23 | 11% | 21% | 18% | 17% | 22% | 11% |
| Q3 '21–Q2 '22 | 16% | 18% | 12% | 21% | 25% | 8% |
| Q3 '20–Q2 '21 | 6% | 27% | 21% | 24% | 17% | 5% |
σ: a stock's earnings-day stock-specific move divided by its typical daily stock-specific move over the past year. Each bar is cut at the same business day of the season; companies weighted by the square root of market cap.
Earnings reactions across the broader universe remain muted even as big-cap defensives find support. Weighted by the square root of market cap, 21% of third-quarter reporters among the 500 largest US companies have risen 2σ or more on a stock-specific basis so far, below the 33% average at this point across the past eight seasons, while 26% have fallen 2σ or more against a 35% eight-season norm. SpaceX (SPCX) dropped 8.7% (style -5.3%, stock-specific -3.3%) as investors weighed capital-structure risk after Tesla (-2.7%) trimmed its 2026 capex forecast to $20B and floated a potential combination with the space companyNYTThe Wall Street Journal. On the upside, Ryder System gained 8.3% (stock-specific +9.5%) after beating third-quarter earnings estimates and raising full-year guidance, and Blackstone rose 7.3% (stock-specific +6.2%) following its morning report.
Cross-asset ETFs split between domestic rate beneficiaries and AI-linked hardware, power, and commodity funds. The First Trust Smart Grid Infrastructure ETF (GRID -4.7%) traded at 4.2× its typical session pace as Beta dragged down grid holdings Eaton (-6.9%, style -4.5%) and Quanta Services (-9.1%, style -5.7%) despite Wood Mackenzie reporting the global data-center pipeline has passed 250 GW, according to Business Insider, and Carrier Global announcing a $600M Texas liquid-cooling plantThe Wall Street Journal. Bitcoin miners hosting AI data centers led the downside, sending WGMI down 8.8% (-34.3% month to date, its second-worst month since 2022) as Bitcoin fell 3.8% to $81,240.37 at 3:02 PM ETCNBC. In commodities, WTI crude rose 2.4% to $99.47/bbl at 2:51 PM ETCNBC and Brent climbed 3.3% to $112.40/bblEconomic Times after the U.S. State Department ordered non-emergency personnel out of Saudi Arabia following Houthi strikes, according to AP News, while energy stocks, among the year's biggest winners (XLE up 61% over the past year), fell with the rest of the year's leaders and the Oil factor fell 0.75% (z=-1.6) and Gold dropped 1.02% (z=-3.2) as spot gold slid 2.7% to $4,030.24/oz at 3:01 PM ETCNBC, with Treasuries rather than gold serving as the safe haven.
| ETF | Theme | Today | 1d Ago | 5d Ago | 20d Ago | 63d Ago |
|---|---|---|---|---|---|---|
| VXX | volatility | +7.8% | -1.0% | +1.1% | -0.6% | -22.8% |
| ITB | homebuilders | +5.2% | -0.9% | +3.8% | -2.5% | -7.7% |
| XLP | consumer staples | +3.0% | -0.7% | +1.2% | +5.7% | +5.4% |
| KRE | banking | +2.5% | 0.0% | +3.0% | +0.3% | -5.5% |
| TLT | long-term bonds | +2.0% | +0.1% | +1.7% | +0.1% | -2.4% |
| USO | oil | +1.8% | -0.5% | +4.1% | +7.4% | +14.6% |
| GRID | AI power infrastructure | -4.7% | +1.5% | -2.3% | -4.9% | -5.0% |
| GDX | gold | -5.9% | +0.7% | +4.0% | -7.3% | +15.6% |
| SMH | semiconductors | -6.0% | +1.9% | -1.4% | -7.4% | -4.1% |
| AIPO | AI power infrastructure | -7.2% | +2.2% | -2.8% | -9.7% | -14.6% |
| WGMI | crypto miners | -8.8% | +2.7% | -4.1% | -34.9% | -44.4% |
Financing stress at AI cloud providers reaches the broader market through private-credit lenders holding GPU-backed debt, high-yield data-center bonds, Nvidia's off-balance-sheet backstops, and hyperscaler credit spreads. CoreWeave's five-year credit default swaps hit an intraday record of 1,194.5 bps on October 15 — pricing roughly 60% five-year default odds — and its 2032 notes yielded about 14.9% on October 19, according to Bloomberg and CNBC. Private Equity Wire, citing Reuters, reported Thursday that CoreWeave's roughly $50B debt load was arranged largely by private-credit firms including Blackstone (+7.3% today; BXSL +2.4%), Magnetar, Carlyle, and BlackRock against GPUs and contracts with Microsoft (-2.1%), OpenAI, and Meta, while Carlyle estimated private credit may need to supply $1T for the AI buildout. In public debt, Forbes reported that neoclouds and data-center developers issued $37B of junk bonds in 2026 (with bonds backing CoreWeave-leased facilities yielding an average of 11%), while high-yield spreads overall have widened roughly 60 bps over the past 20 sessions judging by HYG (+0.1% today).
On the supplier and customer channels, Forbes reported Wednesday that Nvidia has backed $164.5B of AI data-center commitments, and Reuters reported Monday that S&P Global's Mark Habib warned hyperscalers likely carry more undisclosed AI liabilities through interconnected project backstops, though S&P sees no current rating changes. Secured bank lending remains open at steeper terms — Nebius closed a $3.5B, 364-day facility from Citigroup on Thursday at Term SOFR plus 2.75%, stepping up 25 bps every 90 days to 3.50%, according to its press release — and there is no reporting of contract renegotiations by Microsoft or OpenAI or of neocloud receivable write-downs at Dell Technologies (-7.4%) or Super Micro Computer, leaving the equity fallout concentrated in Beta (-3.89%) rather than Leverage (+0.12%, z=+0.7).
Initial jobless claims, released at 8:30 AM ET, fell by 6,000 to a three-month low of 194,000 for the week ended October 17, beating the 200,000 consensus estimate, while continuing claims for the week ended October 10 rose to a six-week high of 1.73 million Labor Department. Despite the firmer labor print, the US Dollar Index edged down 0.2% to 101.604 at 3:02 PM ETCNBC and Treasury yields fell across the curve ahead of next Wednesday's October 28 FOMC decision Federal Reserve.
Variance decomposition: live intraday — 20261022 session, bracketed against its trailing-year range. Factor returns are trailing through last close. Total cross-sectional dispersion: 98.4%ile of the past year.
Variance mix — % of total, today vs 1d ago vs 1-yr avg
market 41%ile style 100.0%ile thematic 79%ile idiosyncratic 2.0%ile
Variance explained — today vs. factor's trailing-year range
Marker = the factor's share of today's total variance, placed in its own trailing-year range (box 25–75%ile, ticks 90%ile and max). Amber marker = unusually load-bearing today (≥90%ile of its own year). Factor name green = up today / red = down.
Correlation & dispersion — realized vs implied
Pairwise realized correlation (20d): 9.59% 7.8%ile since 2020 · 78%ile 3m
Top-500 pairwise: 12.46% 15%ile since 2020 · 84%ile 3m · implied (Cboe COR1M): 12.31 7.6%ile since 2006 (gap +0.1pp)
Realized 20d vol (ann. pts): all stocks 40 vs VIXEQ 42 · index 11 vs VIX 20 · style factors 22 82%ile
20-day window (19 completed days + today); percentiles vs model history since 2020; '3m' tokens rank vs the trailing 63 trading days; definitions in Terms below. Implied prints (Cboe) are delayed ~15 min. as of 14:58 ET
Top 50 high-beta momentum names (eq-wt, since-2020 rank): -10.9% 0.2%ile worst since 2026-06-05 · rest of market +1.2%
HF de-risking score (since-2020 rank so far today): 99.4%ile today · 96.1%ile 5-day · beta + 12-month momentum 26 pts below peak, deepest since 2020 · covering plus selling
| Factor | Today | 1d | 5d | 20d | 60d |
|---|---|---|---|---|---|
| Style-Risk | |||||
| Beta | -3.89% z-4.1 | +1.12% | -5.00% | -11.55% | -1.67% |
| International | -0.22% z-0.8 | -0.09% | -0.23% | -0.35% | -0.09% |
| Residual Volatility | -0.20% z-0.4 | +0.09% | -0.57% | -0.71% | +4.73% |
| Style | |||||
| Size | -0.49% z-1.4 | +0.16% | -0.49% | +0.52% | +3.58% |
| Profitability | +0.26% z+1.4 | -0.05% | +0.21% | +1.91% | -0.19% |
| Dividend Yield | +0.19% z+1.1 | +0.06% | +0.32% | -0.81% | -0.03% |
| Liquidity | +0.21% z+0.8 | -0.05% | -0.02% | -0.59% | +3.74% |
| Leverage | +0.12% z+0.7 | +0.01% | -0.06% | -1.30% | -4.40% |
| Growth | -0.15% z-0.6 | -0.07% | -0.44% | +0.02% | +0.43% |
| Value | +0.01% z+0.0 | -0.27% | -0.25% | +0.48% | -0.17% |
| Style-Momentum | |||||
| Short-Term Momentum | +1.05% z+3.5 | -0.28% | +1.08% | +2.39% | -2.31% |
| Long-Term Momentum | -1.69% z-2.7 | +0.46% | -1.29% | -2.71% | -0.09% |
| One-Day Momentum | -0.28% z-1.0 | +0.19% | -0.31% | -0.25% | -3.99% |
| Medium-Term Momentum | -0.05% z-0.2 | +0.27% | +0.34% | -0.56% | -0.32% |
| Style-Positioning | |||||
| Short Interest | +0.52% z+3.1 | -0.07% | +0.74% | +0.53% | -1.43% |
| Hedge-Fund Ownership | -0.05% z-0.5 | -0.30% | -0.19% | -0.23% | -0.32% |
| Style-Flow | |||||
| Short-Sale Activity | +0.06% z+0.6 | +0.10% | +0.16% | +0.11% | +0.97% |
| Morning Activity | -0.05% z-0.4 | -0.03% | -0.30% | -0.93% | +0.88% |
| Thematic | |||||
| Treasury (Duration) | +1.05% z+3.3 | -0.12% | +1.03% | +0.17% | -2.35% |
| Gold | -1.02% z-3.2 | +0.00% | -1.12% | -1.75% | +1.49% |
| Semiconductors | -1.58% z-2.6 | +0.47% | -1.60% | -4.87% | -2.98% |
| Oil | -0.75% z-1.6 | +0.33% | -0.44% | -0.82% | +5.13% |
| Bitcoin / Crypto | +0.45% z+1.5 | +0.27% | +0.36% | -0.06% | +2.98% |
| China | -0.21% z-0.5 | -0.37% | -0.45% | -0.30% | -0.24% |
5/20/60d windows include today's session; 1d is the previous session.
Pairwise realized correlation. Index variance net of the weighted idiosyncratic diagonal, over the cross terms — the estimator used for implied-correlation indices. 20-day window unless noted; history since 2020.
Market variance share. The fraction of cross-sectional variance explained by the market factor — the attribution companion to pairwise correlation, not a substitute for it.
Factor z-score. Today's factor return divided by its daily-return standard deviation over ~1,600 trading days.
Conditional importance. A factor's relative share of what a tree-based fit of today's stock returns explains; sums to 100% across factors.
High-beta momentum cohort. US names above $2B market cap in the top quintile of both raw beta and 12-month momentum; membership frozen at each month's first business day. “Top 50” = the 50 strongest by combined rank.
HF de-risking score. A FactorPulse measure of de-risking in factor returns: the average of four legs, each in its own daily-volatility units and counted only when it moves in the de-risking direction. They are the most-shorted names rising, 12-month momentum winners falling, names crowded in hedge-fund 13F filings falling net of their beta and momentum, and last week's relative moves continuing instead of reverting (counted only alongside another leg). Ranked against every session since January 2020. A leg counts as firing at half its daily volatility or more. Types: A, covering and selling together; B, selling only; C, covering only. It reads factor returns only, never positions.
Dispersion (realized). Total cross-sectional volatility net of the market component; high dispersion is the flip side of low correlation.
Stock-specific (idiosyncratic) return. The part of a stock's move not explained by the market, style or thematic (industry and theme) factors in the FactorPulse risk model.
VIXEQ / DSPX / COR1M. Cboe implied indices: single-stock volatility, dispersion, and 1-month implied correlation (top-50 S&P names). Quotes delayed ~15 minutes.
Data compiled by FactorPulse AI; edited and verified by Jeff Klein. For informational purposes only. Does not constitute financial advice, an investment recommendation, or an offer to buy or sell any securities. Always consult a qualified financial professional before making investment decisions.
For more on factor construction methodology, see www.factorpulse.com/glossary.