SpaceX's First Profit Lifts AI Stocks; Meta Plans New Non-Voting Shares
Macro: AI hardware earnings drove the day: SpaceX posted its first quarterly net profit and Super Micro raised server revenue guidance. A soft 20-year Treasury auction priced at a 5.469% high yield, the highest since 1986.
Market Moves: The S&P 500rose 0.6% while IWMadded 0.2%. AI hardware and power ETFs led as investors bought proven AI revenue, with the memory-chip fund DRAMup 2.8%. Crypto miners (WGMI) rose 3.9% as bitcoin climbed. The China internet fund KWEBfell 2.2% as Alibaba dropped.
Factors: Hedge-Fund Ownership fell 0.30% (z=-2.8) as lightly owned stocks led the rebound. Beta rose 1.16% (z=+1.2) as high-beta AI hardware names bounced.
Micro:Super Microrose 9.5% after raising preliminary first-quarter revenue guidance. SpaceXgained 7.8% on its first quarterly net profit, led by AI compute. After the close, Meta raised its 2026 capex floor to $135 billion and authorized non-voting Class C stock.
Watch: Will Meta's turn to non-voting equity to fund its AI buildout sustain the AI hardware bid when its results meet Thursday's regular session on October 22?
October 21, 2026 17:21 ET · Updated 18:07 ET
Elon Musk's SpaceX posted its first quarterly profit, about $4.4 billion, as sales of its AI computing power jumped ninefold to $7.6 billion. The rocket and satellite company rose nearly 8% Wednesday, adding about $150 billion in market value. Musk also said SpaceX and Tesla have set up independent board committees to weigh a merger, and Tesla gained 3.4%. Server maker Super Micro Computerrose nearly 10% after raising its revenue forecast by $4 billion, with Dellup 5.5% and Nvidiaup 2.6%. The semiconductor fund SMHgained 1.6%, the Nasdaq-100rose 1.1% and the S&P 500added 0.6%. High-beta stocks, the ones most sensitive to market moves, led the bounce. Hedge funds' favorite stocks lagged, while the stocks they own least gained about 1%.
After the closing bell, Meta Platforms showed how expensive the AI race has become. Revenue grew 26% to about $65 billion. But it spent about $35 billion on data centers and equipment in the quarter, enough to leave it about $2 billion short on free cash flow. Meta raised the low end of its 2026 spending forecast to $135 billion and plans a new class of non-voting shares to raise money for AI computing. The stock rose 2.8% in late trading. The move toward selling stock comes as lenders grow warier of AI borrowers: the cost of insuring Meta's debt against default hit a record this month, and bonds of AI cloud provider CoreWeave yield 15% to 16%. Elsewhere after hours, German software giant SAPjumped 5.2% on strong cloud sales and IBMadded 3.3%. Chip-equipment maker Lam Researchfell 6.9% even though its revenue rose 54%.
Borrowing costs stayed high in the bond market. A $13 billion sale of 20-year Treasury bonds drew weaker-than-usual demand and priced at a yield of about 5.47%, the highest since 1986. The 10-year yield held near 5.12%. Earnings disappointments hit some big names: AT&Tfell 6.3% after missing on new phone-plan subscribers, and Netflixlost 5.3% after cutting its ad-revenue forecast. Investors have been stingy all season. Only about 15% of the big companies that have reported so far got a solid lift from their results, compared with about a third at this point in a typical season. Bitcoin rose 2.6% to about $84,600, and the crypto miner fund WGMIgained 3.9%, though the fund is still down 39% over the past month.
Meta Turns to Non-Voting Equity for $135B AI Tab
During regular trading, investors bought proven AI hardware revenue: SpaceX (SPCX) closed the session up 7.8% (+7.6% combined with late trading), adding $147.8B of market value after reporting its first quarterly net profit of $4.4 billion on $14.58 billion in revenue, led by a ninefold surge in its Super Intelligence AI compute segment to $7.6 billion The Wall Street Journal. Elon Musk also disclosed that SpaceX and Tesla (TSLA, up 3.4% in the regular session) formed special independent board committees to evaluate a potential merger The Wall Street Journal. Super Micro Computer (SMCI) closed up 9.5% (+6.0% stock-specific) after lifting preliminary first-quarter revenue guidance by $4.0 billion to $18.5 billion–$19.5 billion and projecting gross margins of 12.0%–12.5% The Wall Street Journal. Server peer Dell Technologies (DELL +5.5% regular session) and Nvidia (NVDA +2.6%) followed, lifting the Semiconductors factor 0.37% (z=+0.6) and the S&P 500 0.6% while the Nasdaq-100 gained 1.1% in regular trading; both indexes were little changed after the close.
After the closing bell, the focus shifted to how that hardware tab will be financed. Meta Platforms (META) closed the regular session up 0.7% and gained a further 2.8% in late trading (+3.5% combined) after third-quarter revenue rose 26% to $64.60 billion and non-GAAP diluted EPS reached $7.40, excluding a $9.89 billion legal settlement charge. However, third-quarter capital expenditures of $34.91 billion pushed Meta's quarterly free cash flow to negative $2.12 billion. Management lifted the bottom of its full-year 2026 capital expenditure forecast by $5 billion to $135 billion–$145 billion and announced a new class of non-voting Class C common stock to raise capital for AI compute requirements BloombergCrypto Briefing.
That turn to equity financing arrives as the credit market demands steeper compensation for AI debt: the Financial Times reported Tuesday that five-year credit default swaps on Meta reached a record 108 basis points in October, alongside record protection costs on Nvidia (101 bps), and that Oracle's reached 322 bps on Oct. 19, while CoreWeave's five-year CDS reached roughly 1,090 basis points with its unsecured notes yielding 15% to 16%. Janus Henderson portfolio manager John Lloyd argued Tuesday that the CoreWeave bond selloff is an overreaction to higher Treasury rates rather than an AI demand problem given the absence of near-term maturities, according to CNBC. Elsewhere in after-hours reporting, Tesla (TSLA, -0.1% post-close) posted adjusted EPS of $0.48 and $1.53 billion in free cash flow on 19.6% GAAP gross margins Bloomberg. Enterprise software reporters also rallied late: SAP SE (SAP) closed the regular session up 1.5% and jumped 5.2% after the bell on stronger-than-forecast cloud revenue growth, while IBM closed up 3.8% and added 3.3% post-close after reporting 5% sales growth on revived infrastructure deals Bloomberg.
Earnings reactions in the regular sessionReporters worth over $100 billion, or moving more than 10% with a value above $5 billion
Stock-specific: the part of a stock's move not explained by the market, style or thematic (industry and theme) factors in the FactorPulse risk model.
After the close: moves trade on a fraction of a normal session's volume, so each is an early read. Market-adjusted: the move minus the stock's beta times the S&P 500's late-trading move.
Revenue and margin from the company's earnings release, year over year; margin change in percentage points; — where the release is not parsed or the figures failed checks.
† The company's year-ago figure differs from the one originally filed, usually a restatement; growth is on its current basis.
Light volume: the company's earnings filing confirms the report, but trading volume has not caught up yet, so the move is an early read.
Of the 500 largest companies, 71 have reported (20% of market cap), on day 15 of the season.
How earnings reactions split, day 15 of the seasonThe 500 largest US companies with a confirmed earnings reaction so far (57), vs the same day in the past eight seasons and in four-season stretches back to mid-2020
Weighted by size, 15% of this season's reporters rose 2σ or more on a stock-specific basis, against 34% at this point in the past eight seasons; 29% fell 2σ or more (past: 33%).
Earnings reactions this season vs the past eight seasons, day 15
Season
≤ −5σ
−5 to −2σ
−2 to 0σ
0 to 2σ
2 to 5σ
≥ 5σ
This season
5%
23%
30%
26%
13%
2%
Past 8 seasons
12%
21%
16%
17%
19%
15%
Q2 2026
11%
25%
18%
15%
20%
12%
Q1 2026
17%
15%
12%
27%
19%
10%
Q4 2025
14%
27%
21%
12%
16%
11%
Q3 2025
2%
23%
18%
18%
9%
29%
Q2 2025
15%
28%
17%
14%
15%
11%
Q1 2025
19%
10%
18%
16%
32%
5%
Q4 2024
6%
20%
15%
16%
28%
16%
Q3 2024
15%
15%
10%
20%
19%
21%
Q3 '23–Q2 '24
12%
20%
18%
15%
21%
14%
Q3 '22–Q2 '23
9%
23%
17%
17%
22%
12%
Q3 '21–Q2 '22
15%
19%
13%
22%
25%
6%
Q3 '20–Q2 '21
5%
26%
22%
25%
16%
5%
σ: a stock's earnings-day stock-specific move divided by its typical daily stock-specific move over the past year. Each bar is cut at the same business day of the season; companies weighted by the square root of market cap.
Factor
Return
Z-Score
5d Z
20d Z
63d Z
Category
Direction
Hedge-Fund Ownership
-0.30%
-2.8
+0.3
-0.3
-0.2
Style-Positioning
Lightly owned led
Beta
+1.16%
+1.2
-0.7
-1.8
-0.7
Style-Risk
High-beta led
Short-Term Momentum
-0.36%
-1.2
+0.4
+1.1
-2.2
Style-Momentum
5-day losers bounced
Medium-Term Momentum
+0.31%
+1.1
-0.3
-0.3
+0.9
Style-Momentum
20-day winners led
Value
-0.25%
-1.1
-0.6
+0.2
+0.1
Style
Expensive names led
China
-0.31%
-0.8
+0.2
+0.0
+0.3
Thematic
China-exposed lagged
Semiconductors
+0.37%
+0.6
-1.2
-1.3
-1.7
Thematic
Chip names led
Short Interest
-0.10%
-0.6
+0.9
+0.0
-0.6
Style-Positioning
Un-shorted led
Hedge-Fund Favorites Lag at z=-2.8 as Uncrowded Beta Rallies
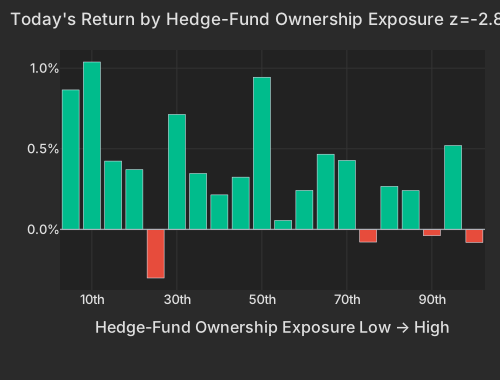
Beneath the index advance, factor decomposition shows institutional books held back from chasing the bounce. Hedge-Fund Ownership dropped 0.30% (z=-2.8, and -0.18% at z=-1.3 on a raw basis), ranking in the 97.8th percentile of variance share since 2020 as the least-owned stock bucket gained 0.9%. Goldman Sachs Prime Brokerage described last week's record tech selling, over the five sessions through October 15, as mainly long liquidation rather than new short bets, with chipmakers taking the biggest dollar outflows. Even so, tech was still 23.5% of Goldman's global prime book afterward, around the 90th percentile of the past five years. Meanwhile, the Beta factor's 1.16% gain (z=+1.2) accounted for 14.5% of today's cross-sectional variance, lifted by its highest-exposure bucket (+3.0%) and factor-carried rallies in MARA Holdings (MARA +5.2%), Vicor (VICR +5.0%), MaxLinear (MXL +3.9%) and AXT (AXTI +3.8%).
Hedge-Fund Ownership fell at z=-2.8 today, driven by the least-owned bucket 1 gaining +0.9% while heavily owned stocks lagged.
Today's Return by Hedge-Fund Ownership Exposure z=-2.8
Bucket
Avg Ret Pct
1
0.86
2
1.04
3
0.42
4
0.37
5
-0.30
6
0.71
7
0.35
8
0.21
9
0.32
10
0.94
11
0.06
12
0.24
13
0.47
14
0.43
15
-0.08
16
0.27
17
0.24
18
-0.04
19
0.52
20
-0.08
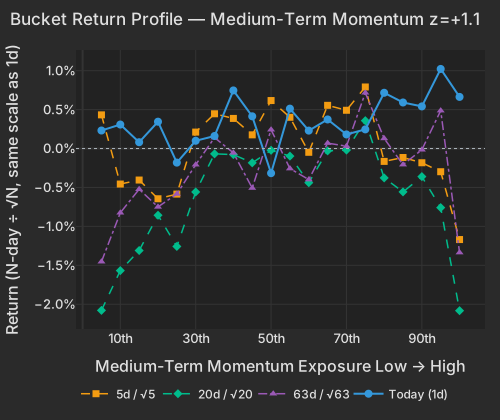
Horizon returns underscored the snapback: 5-day reversion (Short-Term Momentum in the table) printed -0.36% (z=-1.2; 63-day z=-2.2) as last week's losers bounced 0.6% in the bottom bucket, whereas 20-day momentum (Medium-Term Momentum in the table) rose 0.31% (z=+1.1) and Value slipped 0.25% (z=-1.1). Even strong semiconductor results struggled to hold after-hours bids: Lam Research (LRCX) closed the regular session down 0.7% and tumbled 6.9% in late trading (-7.6% combined) despite reporting a 54% jump in fiscal first-quarter revenue to $8.22 billion and guiding December-quarter sales to $8.6 billion. Texas Instruments (TXN) closed the session up 2.4% before slipping 0.6% post-close (+1.8% combined). Across 57 earnings reactions so far among the 500 largest US companies, only 15% rose 2σ or more on a stock-specific basis, below the 34% norm at this point in the past eight seasons and below every four-season stretch since mid-2020. In biotech, Arcus Biosciences (RCUS) fell 19.6% in regular trading and 4.7% after the bell (-24.3% combined) after its Phase 3 lung cancer trial with Gilead Sciences failed to meet its primary progression-free survival endpoint Bloomberg.
20-day momentum (Medium-Term Momentum) rose at z=+1.1 today, maintaining a positive cross-horizon slope across the 1-day (0.582), 20-day (0.301) and 63-day (0.516) windows.
Soft 20-Year Treasury Auction Keeps Pressure on Indebted Equities
The afternoon's $13 billion 20-year Treasury bond auction capped the morning's rate relief, pricing at a 5.469% high yield—the highest since 1986—with a 0.9 basis-point tail against a 0.2 basis-point average as indirect buyers took 58.2% versus the 65.2% norm investingLive. By late afternoon, the 20-year Treasury yield sat at 5.466% (-1.3 bps) while the 10-year yield edged up 0.2 bps to 5.119% and the 2-year rose 2.1 bps to 4.808%, leaving the 20-year yielding more than both the 10-year and the 30-year (5.410%, -1.5 bps) CNBC. Newsquawk noted that the 20-year remains the Treasury's least-favored tenor, trading cheap to the curve on thin liquidity Newsquawk. With borrowing costs pinned near multi-year highs, the Leverage factor finished flat today (-0.01%, z=-0.1) and remains down 4.73% over the past 60 sessions, while high-yield credit spreads sit roughly 70 basis points wider over the past month, judging by fund prices.
ETF
Theme
Today
1d Ago
5d Ago
20d Ago
63d Ago
WGMI
crypto miners
+3.9%
+0.2%
-16.6%
-39.0%
-44.8%
DRAM
memory chips & storage
+2.8%
-1.3%
-9.7%
-25.0%
-17.4%
AIPO
AI power infrastructure
+2.5%
-1.1%
-9.9%
-13.1%
-16.0%
GRID
AI power infrastructure
+2.3%
-0.5%
-6.3%
-8.0%
-6.8%
IGV
software
+2.2%
+0.9%
-3.7%
+0.2%
+20.1%
SMH
semiconductors
+1.6%
-0.4%
-7.1%
-10.1%
-6.9%
NLR
nuclear power
+1.5%
-0.1%
-6.2%
-16.7%
-16.3%
DTCR
data centers
-0.8%
+0.8%
-5.2%
-10.0%
-9.1%
ITB
homebuilders
-1.3%
+2.8%
+3.2%
-4.1%
-7.7%
KWEB
china
-2.2%
+0.3%
-1.5%
-4.0%
-7.9%
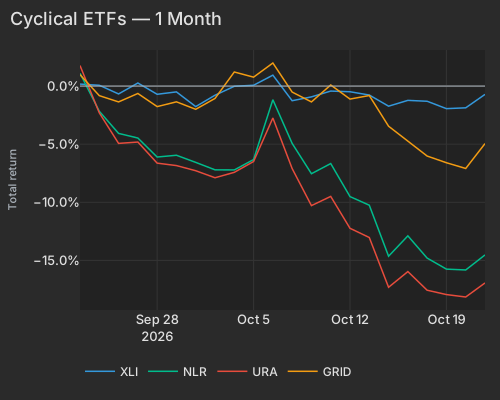
Across the thematic ETF complex, today's gains in crypto miners (WGMI, as bitcoin rose 2.6% to $84,627 at 5:12 PM ET), nuclear power (NLR) and smart-grid infrastructure (GRID) trimmed only a fraction of their steep 20-day drawdowns, where WGMI (-39.0%, 0.3rd percentile since 2022) and NLR (-16.7%, 1.5th percentile since late 2018) remain among their worst 20-day stretches CNBC. Meanwhile, the China factor fell 0.31% (z=-0.8; 95.4th percentile of variance share since 2020) as Alibaba (BABA) dropped 3.9% and KWEB fell 2.2% on 3.0× the typical session pace.
Cyclical and power-infrastructure ETFs remain in deep one-month drawdowns despite today's bounce, led lower by URA (-19.6% over 20 completed sessions, 1.5th percentile since late 2018) and NLR (-16.7%, 1.5th percentile).
Variance decomposition: live intraday — 20261021 session, bracketed against its trailing-year range. Factor returns are trailing through last close. Total cross-sectional dispersion: 34%ile of the past year.
Variance mix — % of total, today vs 1d ago vs 1-yr avg
Variance explained — today vs. factor's trailing-year range
Marker = the factor's share of today's total variance, placed in its own trailing-year range (box 25–75%ile, ticks 90%ile and max). Amber marker = unusually load-bearing today (≥90%ile of its own year). Factor name green = up today / red = down.
Realized 20d vol (ann. pts): all stocks 37 vs VIXEQ 41 · index 11 vs VIX 17 · style factors 1967%ile
20-day window (19 completed days + today); percentiles vs model history since 2020; '3m' tokens rank vs the trailing 63 trading days; definitions in Terms below. Implied prints (Cboe) are delayed ~15 min. as of 16:58 ET
5/20/60d windows include today's session; 1d is the previous session.
Terms
Pairwise realized correlation.Index variance net of the weighted idiosyncratic diagonal, over the cross terms — the estimator used for implied-correlation indices. 20-day window unless noted; history since 2020.
Market variance share.The fraction of cross-sectional variance explained by the market factor — the attribution companion to pairwise correlation, not a substitute for it.
Factor z-score.Today's factor return divided by its daily-return standard deviation over ~1,600 trading days.
Conditional importance.A factor's relative share of what a tree-based fit of today's stock returns explains; sums to 100% across factors.
High-beta momentum cohort.US names above $2B market cap in the top quintile of both raw beta and 12-month momentum; membership frozen at each month's first business day. “Top 50” = the 50 strongest by combined rank.
Dispersion (realized).Total cross-sectional volatility net of the market component; high dispersion is the flip side of low correlation.
Stock-specific (idiosyncratic) return.The part of a stock's move not explained by the market, style or thematic (industry and theme) factors in the FactorPulse risk model.
Data compiled by FactorPulse AI; edited and verified by Jeff Klein. For informational purposes only. Does not constitute financial advice, an investment recommendation, or an offer to buy or sell any securities. Always consult a qualified financial professional before making investment decisions.