A research firm's bet on artificial intelligence in drug discovery led the day. Citrini Research said it used Anthropic's Claude to design candidate proteins and named lab-services firm Charles River Laboratories and lab-equipment maker Revvity as top picks; Charles River rose about 5% and Revvity about 3%. Drug stocks rallied with them: health care was the best sector, up 2.8%, and the biotech fund XBI jumped about 3.6% as heavily shorted, money-losing drug developers soared. Drugmaker Eli Lilly rose 3.7% to a record above $1,300 after upbeat late-stage trial results, a higher Goldman Sachs price target and a $1.1 billion AI drug-delivery partnership, pushing its market value past Berkshire Hathaway's. The jump in heavily shorted stocks suggests hedge funds are now buying back bets against stocks, after a stretch in which, Goldman Sachs said, they dumped technology and chip holdings at the fastest pace since 2016. In a deal, software maker Salesforce agreed to buy customer-engagement software firm Braze for $5.7 billion, sending Braze up 51%.
Easing bond yields and cheaper oil helped the rest of the market. The 10-year Treasury yield slipped to about 5.11% and U.S. crude fell 2.5% to around $101 a barrel, even as 18 attacks on ships in the Strait of Hormuz over two weeks pushed supertanker rates above $1 million a day. The S&P 500 rose 0.3%, the small-company fund IWM gained 1.8%, the homebuilder fund ITB climbed 2.8% and the regional-bank fund KRE added 2.1%. Earnings were a tougher sell. General Motors fell 6.7% despite beating estimates and approving a $20 billion buyback, as investors balked at unchanged guidance and a collapse in international profit, and GE Aerospace dropped 3.7% after free cash flow fell 14%. So far this season, only about 13% of big companies, weighted by size, have seen a solid stock-specific jump on their results, versus 35% at this point in past seasons. 3M was among the winners, up 5.8%.
After the bell, the S&P 500 added another 0.3%. SpaceX rose 2.7% as third-quarter revenue jumped 161% to about $14.6 billion, beating forecasts, powered by an 830% surge in its AI computing business, and the company swung to a $4.4 billion profit. Netflix fell 5.1% after cutting its 2026 advertising forecast to $2.7 billion from $3 billion. Medical-device maker Intuitive Surgical tumbled about 11% after booking a $450 million antitrust charge and warning about tariff costs in Mexico and Germany in 2027. Late in the session, the Wall Street Journal reported that a draft of Anthropic's IPO filing shows the Claude maker could spend as much as $750 billion on computing in the coming years. In Taiwan, local reports said Thursday's planned walkout by a union at memory-chip maker Micron is a one-day warning strike rather than an open-ended halt.
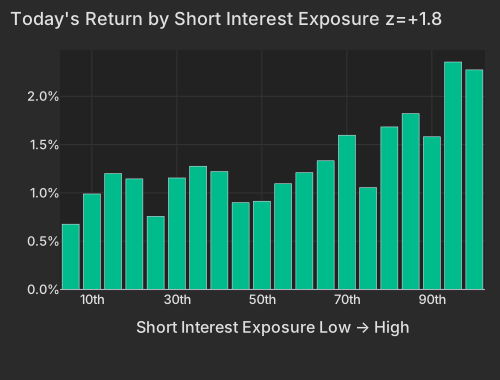
Style factors explained 8.7% of cross-sectional variance today against a 23.0% one-year average (12.7th percentile), while the broad market move explained 17.4% against a 9.1% norm (84.9th percentile). Even with style carrying a light share of total variance, the factor returns that did stand out captured a clear turn in institutional positioning: Short Interest rose 0.29% (z=+1.8), Size fell 0.54% (z=-1.6), and Profitability dropped 0.22% (z=-1.2), while Beta stabilized at -0.28% (z=-0.3) after losing 5.22% over the prior five sessions and 9.10% over the past 20 days. On a raw basis, yesterday's most heavily short-sold stocks outperformed the barely shorted by 0.35% (z=+1.8), though the near-flat Short-Sale Activity factor (-0.01%, z=-0.1) confirms that gain was shared with standing short-interest crowding rather than an independent one-day flow effect.
| Factor | Return | Z-Score | 5d Z | 20d Z | 63d Z | Category | Direction |
|---|---|---|---|---|---|---|---|
| Short Interest | +0.29% | +1.8 | +1.4 | -0.3 | -0.7 | Style-Positioning | Most-shorted names outperformed |
| Treasury (Duration) | +0.50% | +1.6 | +1.2 | -0.8 | -1.2 | Thematic | Long-duration equities led |
| Size | -0.54% | -1.6 | -0.6 | +1.0 | +1.2 | Style | Small caps beat large caps |
| Profitability | -0.22% | -1.2 | +1.2 | +1.9 | -0.1 | Style | Unprofitable names outperformed |
| Oil | -0.51% | -1.1 | -1.1 | +0.1 | +1.0 | Thematic | Oil-exposed equities lagged |
| Bitcoin / Crypto | +0.31% | +1.0 | -0.3 | -0.5 | +0.8 | Thematic | High-crypto-beta stocks led |
| Hedge-Fund Ownership | +0.06% | +0.5 | +0.8 | -0.2 | -0.0 | Style-Positioning | Heavily owned names edged up |
| Short-Sale Activity | -0.01% | -0.1 | +0.2 | -0.4 | +1.1 | Style-Flow | Prior-day short flow flat |
Health Care (+2.8%) was the session's top-performing sector. Bloomberg reported Tuesday that Citrini Research named Charles River Laboratories (CRL, +5.4% in regular trading) and Revvity (RVTY, +3.4% in regular trading, +0.7% post-close) as top life-sciences picks to benefit from AI drug discovery after using Anthropic's Claude to design candidate proteinsBloomberg. The SPDR S&P Biotech ETF (XBI) climbed 3.6% in regular trading as heavily shorted clinical-stage developers Spyre Therapeutics (SYRE, +8.0%) and Trevi Therapeutics (TRVI, +7.9% in the regular session) rallied alongside peers Oruka Therapeutics (ORKA, +6.2%), Enliven Therapeutics (ELVN, +6.7%), and Edgewise Therapeutics (EWTX, +4.8% in the regular session) on no company-specific news. At the top of the sector, Eli Lilly (LLY) rose 3.7% to a record intraday high of $1,311.21, adding $40.3B of market value to surpass Berkshire Hathaway Class B (BRK.B, +1.4%) after positive Phase 3 pediatric ulcerative colitis data for Omvoh, a Goldman Sachs price target increase to $1,413, and a $1.1 billion AI delivery collaboration with JT Therapeutics, according to MorningstarMorningstar. The group's only fresh deal came Monday, when Merck KGaA agreed to buy Silence Therapeutics (SLN) for $20 per ADS in cashBloomberg.
| Bucket | Avg Ret Pct |
|---|---|
| 1 | 0.68 |
| 2 | 0.99 |
| 3 | 1.20 |
| 4 | 1.15 |
| 5 | 0.76 |
| 6 | 1.15 |
| 7 | 1.28 |
| 8 | 1.22 |
| 9 | 0.90 |
| 10 | 0.91 |
| 11 | 1.09 |
| 12 | 1.21 |
| 13 | 1.33 |
| 14 | 1.60 |
| 15 | 1.06 |
| 16 | 1.68 |
| 17 | 1.82 |
| 18 | 1.58 |
| 19 | 2.36 |
| 20 | 2.27 |
Earnings reactions in the regular sessionReporters worth over $100 billion, or moving more than 10% with a value above $5 billion
| Company | Move | Stock-specific | Market cap | Revenue YoY | Margin YoY | What drove it |
|---|---|---|---|---|---|---|
| GE Aerospace GE | -3.7% | -4.1% | $323B | +16%† | +2.3 pts† adj. operating | Free cash flow fell 14% despite beat |
| BHP Group Limited American Depositary Shares (Each representing two Ordinary Shares) BHP | -1.6% | -2.0% | $212B | — | — | Q1 copper production missed consensus by 7% |
| RTX RTX | +0.6% | -0.3% | $259B | +11% | +2.8 pts adj. operating | Q3 beat and third FY26 guidance raise |
| Hasbro HAS | +11.2% | +10.4% | $14B | — | — | — |
| Equifax Incorporated EFX | +11.7% | +8.8% | $19B | — | — | — |
Stock-specific: the part of a stock's move not explained by the market, style or thematic (industry and theme) factors in the FactorPulse risk model.
Revenue and margin from the company's earnings release, year over year; margin change in percentage points; — where the release is not parsed or the figures failed checks.
† The company's year-ago figure differs from the one originally filed, usually a restatement; growth is on its current basis.
Of the 500 largest companies, 48 have reported (13% of market cap), on day 14 of the season.
How earnings reactions split, day 14 of the seasonThe 500 largest US companies with a confirmed earnings reaction so far (41), vs the same day in the past eight seasons and in four-season stretches back to mid-2020

| Season | ≤ −5σ | −5 to −2σ | −2 to 0σ | 0 to 2σ | 2 to 5σ | ≥ 5σ |
|---|---|---|---|---|---|---|
| This season | 7% | 26% | 24% | 29% | 10% | 3% |
| Past 8 seasons | 12% | 21% | 15% | 17% | 21% | 14% |
| Q2 2026 | 13% | 21% | 20% | 11% | 20% | 13% |
| Q1 2026 | 23% | 14% | 8% | 32% | 20% | 2% |
| Q4 2025 | 12% | 26% | 21% | 13% | 15% | 12% |
| Q3 2025 | 3% | 26% | 20% | 15% | 12% | 24% |
| Q2 2025 | 10% | 32% | 14% | 16% | 18% | 10% |
| Q1 2025 | 18% | 12% | 11% | 17% | 37% | 5% |
| Q4 2024 | 4% | 18% | 13% | 16% | 31% | 18% |
| Q3 2024 | 15% | 15% | 10% | 20% | 19% | 21% |
| Q3 '23–Q2 '24 | 11% | 21% | 16% | 17% | 24% | 11% |
| Q3 '22–Q2 '23 | 8% | 24% | 15% | 18% | 22% | 12% |
| Q3 '21–Q2 '22 | 14% | 20% | 14% | 20% | 27% | 6% |
| Q3 '20–Q2 '21 | 6% | 28% | 22% | 23% | 17% | 4% |
σ: a stock's earnings-day stock-specific move divided by its typical daily stock-specific move over the past year. Each bar is cut at the same business day of the season; companies weighted by the square root of market cap.
After the bell, SpaceX and Capital One rallied on their results while Netflix and Intuitive Surgical fell sharply on theirs. SpaceX (SPCX) rose 2.7% after hours, reversing a 0.5% regular-session dip for a 2.2% combined gain that added $43.4B of market value. Third-quarter revenue rose 161% from a year earlier to $14.58 billion, ahead of the $12.72 billion consensus. The growth came from its Super Intelligence AI segment, where revenue surged 830% to $7.56 billion and the unit swung to a $431 million operating profit despite $19.6 billion of quarterly capital spendingBloombergThe Wall Street Journal. Capital One Financial (COF) jumped 6.2% after its third-quarter release, adding to a 0.9% session gain (+7.2% combined). Netflix (NFLX) fell 5.1% post-close after management cut its 2026 advertising revenue forecast to $2.7 billion from $3.0 billion and reorganized its programming unitsNYT. With a 1.7% regular-session decline, the stock lost 6.7% on the day, erasing $19.3B of market value. Intuitive Surgical (ISRG) tumbled 10.9% in late trading after booking a $450 million antitrust litigation charge and flagging 2027 tariff costs in Mexico and Germany. That wiped out a 1.1% session gain, leaving the stock down 9.8% combined and $15.3B lighter in market value.
That unforgiving reception extends an early third-quarter pattern where beats with any guidance blemish are sold. Across the 41 reactions among the 500 largest U.S. companies so far this season, only 13% of reporters weighted by the square root of market cap rose 2σ or more on a stock-specific basis, below every one of the past eight seasons at this point (35% average; 22% lowest) and below every four-season stretch since mid-2020. During regular trading, General Motors (GM) fell 6.7% despite beating third-quarter estimates and authorizing a $20 billion share buybackBloomberg, as an unchanged $15.0 billion adjusted EBIT guidance midpoint and an 87.7% drop in international operating profit disappointed investors. Meanwhile, 3M (MMM) gained 5.8% in the regular session on its morning report.
The Bitcoin / Crypto factor gained 0.31% (z=+1.0) as spot bitcoin rose 1.0% to $82,648.49 at 4:41 PM ETCNBC, lifting crypto treasury holders and exchanges (median +5.8% and +2.2%) alongside AI-cloud operators CoreWeave (CRWV, +3.4%) and Nebius Group (NBIS, +2.3%), while miners hosting AI computing posted a +0.4% median return led by Bitdeer Technologies (BTDR, +2.8%) and Hut 8 (HUT, +2.0%). Yet credit markets continue to price severe strain in debt-funded AI infrastructure: CNBC reported Monday that CoreWeave's 9.625% 2032 bond yielded 14.9% with five-year credit default swaps near 1,082 bps—down from Thursday's record 1,194.5 bps—while Oracle's (ORCL) five-year default swaps widened to roughly 315 bpsCNBC. Late in the session, the Wall Street Journal reported that a draft of Anthropic's IPO filing puts its possible computing spending at as much as $750 billion over the coming years, including deals still under negotiationBloomberg. The company already has about $450 billion contracted for cloud capacity over seven to ten years, most of it noncancelable. Across the broader market, high-yield spreads are roughly 80 basis points wider over the past 20 sessions judging by HYG fund prices, whereas investment-grade spreads moved less than 20 basis points, and Fitch Ratings reported Monday that trailing 12-month U.S. leveraged-loan and high-yield default rates stand at 3.9% and 2.6% as distressed exchanges extend default risk into 2027Fitch Ratings, exemplified by JetBlue Airways' (JBLU) 2031 loyalty-backed notes falling to 72 cents on the dollar on October 8Bloomberg and Medical Properties Trust's (MPT) $2.4 billion refinancing at a 9.25% coupon. In memory chips, the Roundhill Memory ETF (DRAM) fell 1.3% in regular trading before rebounding 1.1% after hours (-0.1% combined, -21.5% over 20 days) and the iShares MSCI South Korea ETF (EWY) lost 1.6% in the session before adding 0.8% post-close (-0.9% combined) as SK Hynix (SKHY) dropped 1.5% and Apple (AAPL, -0.8%) slipped following a Loop Capital downgrade to Hold that flagged firm memory pricing as a margin headwind; Nikkei Asia and Focus Taiwan reported Tuesday that Thursday's walkout by Micron's (MU) Taoyuan union in Taiwan is a one-day warning strike timed to mediation at its Taichung high-bandwidth memory plant rather than an indefinite haltNikkei Asia.
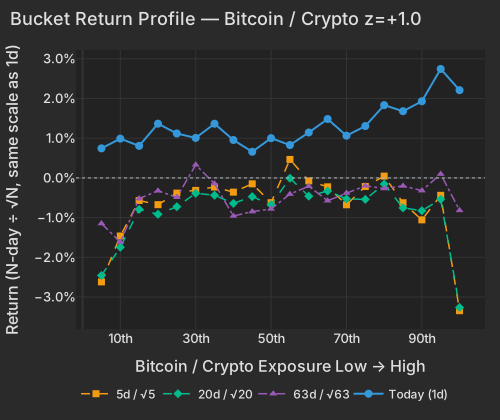
| Bucket | Ret 1D Pct | Ret 5D Norm Pct | Ret 20D Norm Pct | Ret 63D Norm Pct |
|---|---|---|---|---|
| 1 | 0.74 | -2.62 | -2.46 | -1.15 |
| 2 | 0.99 | -1.46 | -1.75 | -1.62 |
| 3 | 0.81 | -0.57 | -0.79 | -0.52 |
| 4 | 1.37 | -0.67 | -0.92 | -0.32 |
| 5 | 1.12 | -0.38 | -0.73 | -0.49 |
| 6 | 1.01 | -0.31 | -0.39 | 0.33 |
| 7 | 1.36 | -0.23 | -0.44 | -0.14 |
| 8 | 0.96 | -0.36 | -0.64 | -0.96 |
| 9 | 0.66 | -0.15 | -0.47 | -0.85 |
| 10 | 1.00 | -0.62 | -0.67 | -0.78 |
| 11 | 0.83 | 0.47 | -0.01 | -0.41 |
| 12 | 1.14 | -0.08 | -0.46 | -0.21 |
| 13 | 1.48 | -0.22 | -0.33 | -0.57 |
| 14 | 1.06 | -0.68 | -0.53 | -0.38 |
| 15 | 1.31 | -0.22 | -0.54 | -0.20 |
| 16 | 1.83 | 0.05 | -0.15 | -0.27 |
| 17 | 1.68 | -0.63 | -0.75 | -0.20 |
| 18 | 1.93 | -1.06 | -0.83 | -0.32 |
| 19 | 2.74 | -0.44 | -0.54 | 0.10 |
| 20 | 2.21 | -3.34 | -3.26 | -0.82 |
Long-end yields retreated while the front end edged higher: the 30-year Treasury yield fell 4.7 bps to 5.426%CNBC and the 20-year dropped 4.6 bps to 5.477%CNBC, while the 2-year rose 1.9 bps to 4.78%CNBC and the US Dollar Index (DXY) slipped 0.3% to 101.708 at 4:40 PM ETCNBC. That long-end relief lifted the Treasury (Duration) factor 0.50% (z=+1.6) and drove gains across homebuilders (ITB +2.8%, XHB +2.2%), real estate (VNQ +1.7% in regular trading, +1.9% combined), and mortgage REITs AGNC Investment (AGNC, +4.4%) and Annaly Capital Management (NLY, +3.2%), while the Global X Data Center & Digital Infrastructure ETF (DTCR) rose 0.6% after losing 10.4% over the prior 20 completed sessions (3.2nd percentile since 2024). Meanwhile, the Oil factor fell 0.51% (z=-1.1) as November WTI crude settled down 1.8% at $101.79 on contract expiration despite 18 vessel attacks in the Strait of Hormuz over two weeks pushing supertanker rates past $1 million per dayCNBCBloomberg.
| ETF | Theme | Today | 1d Ago | 5d Ago | 20d Ago | 63d Ago |
|---|---|---|---|---|---|---|
| XBI | biotech growth | +3.7% | +2.5% | -2.3% | -6.6% | -4.3% |
| ITB | homebuilders | +2.8% | -1.7% | +1.1% | -3.7% | -9.8% |
| KRE | banking | +2.1% | -0.8% | -0.4% | -3.8% | -8.3% |
| VNQ | real estate | +1.9% | -1.1% | -0.7% | -2.5% | -8.1% |
| IWM | small cap | +1.8% | +0.3% | -2.4% | -5.0% | -8.3% |
| WGMI | crypto miners | +1.7% | +0.8% | -19.2% | -38.1% | -43.8% |
| TLT | long-term bonds | +0.8% | -0.7% | +1.8% | -2.5% | -3.9% |
| DTCR | data centers | +0.6% | -0.3% | -7.3% | -10.4% | -9.2% |
| DRAM | memory chips & storage | -0.1% | +4.1% | -11.7% | -21.5% | -17.9% |
| EWY | south korea | -0.9% | +4.1% | -8.0% | -17.2% | -9.4% |
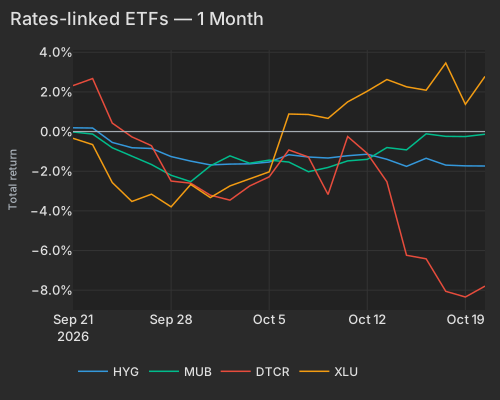
| T | Hyg | Mub | Dtcr | Xlu |
|---|---|---|---|---|
| 2026-09-21 | 0.19 | -0.02 | 2.32 | -0.34 |
| 2026-09-22 | 0.18 | -0.13 | 2.67 | -0.66 |
| 2026-09-23 | -0.55 | -0.82 | 0.43 | -2.57 |
| 2026-09-24 | -0.81 | -1.25 | -0.27 | -3.53 |
| 2026-09-25 | -0.85 | -1.66 | -0.71 | -3.16 |
| 2026-09-28 | -1.26 | -2.21 | -2.50 | -3.80 |
| 2026-09-29 | -1.49 | -2.53 | -2.60 | -2.67 |
| 2026-09-30 | -1.68 | -1.73 | -3.21 | -3.33 |
| 2026-10-01 | -1.64 | -1.23 | -3.46 | -2.74 |
| 2026-10-02 | -1.63 | -1.60 | -2.75 | -2.37 |
| 2026-10-05 | -1.54 | -1.44 | -2.28 | -2.03 |
| 2026-10-06 | -1.17 | -1.54 | -0.93 | 0.89 |
| 2026-10-07 | -1.28 | -2.02 | -1.28 | 0.86 |
| 2026-10-08 | -1.33 | -1.81 | -3.17 | 0.67 |
| 2026-10-09 | -1.22 | -1.48 | -0.25 | 1.50 |
| 2026-10-12 | -1.14 | -1.40 | -1.11 | 2.04 |
| 2026-10-13 | -1.40 | -0.81 | -2.53 | 2.63 |
| 2026-10-14 | -1.76 | -0.92 | -6.24 | 2.26 |
| 2026-10-15 | -1.35 | -0.11 | -6.42 | 2.09 |
| 2026-10-16 | -1.69 | -0.24 | -8.06 | 3.46 |
| 2026-10-19 | -1.73 | -0.25 | -8.35 | 1.38 |
| 2026-10-20 | -1.74 | -0.13 | -7.80 | 2.78 |
Realized co-movement across the equity universe has climbed to a three-month high even as options markets price near-record dispersion ahead. Blended 20-day pairwise realized correlation reached 11.15% today, its highest reading in the past 63 sessions (100.0th percentile of the 3-month window, though still in the 12.8th percentile since 2020), with the 5-day blend at 17.07% (98.4th percentile over 3 months). That rise in 20-day co-movement reflects heavy style factor swings—style accounted for 24.7% of 20-day variance led by Beta at 14.2%, while the index itself explained just 8.8% (18.6th percentile since 2020). By contrast, implied 1-month correlation among the 50 largest S&P 500 stocks (Cboe COR1M) fell 1.28 points today to 8.40 (2.2nd percentile since 2006), sitting 2.46 percentage points below the like-for-like S&P 500 20-day realized pairwise correlation of 10.86% as implied dispersion (Cboe DSPX) rose to 37.33 (96.2nd percentile since 2014). Ahead of Wednesday's session, Philip Morris International (PM), Thermo Fisher Scientific (TMO), and Abbott Laboratories (ABT) are scheduled to report third-quarter results before the open.
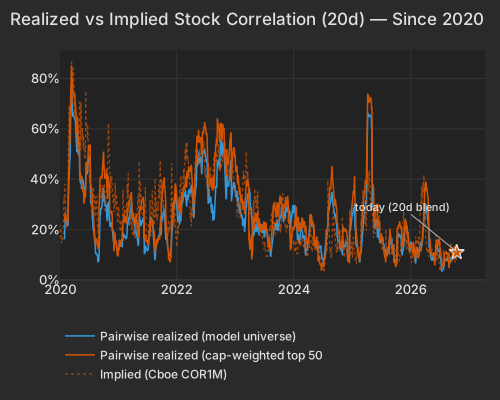
| Series | Today Pct | Prev Close Pct |
|---|---|---|
| Realized, all stocks (20d) | 11.15 | 10.19 |
| Realized, top 500 (20d) | 10.86 | 10.44 |
| Implied, Cboe COR1M | 8.40 | 9.68 |
The Philadelphia Fed's October services survey, released at 8:30 AM ET, showed firm-level activity rising to +12.9 from +0.3, with new orders and sales back in positive territory. Firms' view of the regional economy stayed deeply negative at -23.6, and the index of prices they receive slowed to +8.6 from +20.0 even as wage and benefit costs rose to +48.5 from +40.7. The survey follows Thursday's drop in the region's manufacturing index to 20.9 from 37.8.
Variance decomposition: live intraday — 20261020 session, bracketed against its trailing-year range. Factor returns are trailing through last close. Total cross-sectional dispersion: 33%ile of the past year.
Variance mix — % of total, today vs 1d ago vs 1-yr avg
market 85%ile style 13%ile thematic 74%ile idiosyncratic 46%ile
Variance explained — today vs. factor's trailing-year range
Marker = the factor's share of today's total variance, placed in its own trailing-year range (box 25–75%ile, ticks 90%ile and max). Amber marker = unusually load-bearing today (≥90%ile of its own year). Factor name green = up today / red = down.
Correlation & dispersion — realized vs implied
Pairwise realized correlation (20d): 11.15% 13%ile since 2020 · 100.0%ile 3m
Top-500 pairwise: 10.86% 11%ile since 2020 · 70%ile 3m · implied (Cboe COR1M): 8.40 2.2%ile since 2006 (gap +2.5pp)
Realized 20d vol (ann. pts): all stocks 37 vs VIXEQ 41 · index 11 vs VIX 17 · style factors 18 65%ile
20-day window (19 completed days + today); percentiles vs model history since 2020; '3m' tokens rank vs the trailing 63 trading days; definitions in Terms below. Implied prints (Cboe) are delayed ~15 min. as of 16:21 ET
Top 50 high-beta momentum names (eq-wt, since-2020 rank): -0.6% 37%ile · rest of market +1.4%
| Factor | Today | 1d | 5d | 20d | 60d |
|---|---|---|---|---|---|
| Style-Risk | |||||
| Residual Volatility | +0.33% z+0.7 | +0.47% | -0.36% | -0.23% | +4.86% |
| International | -0.10% z-0.3 | -0.21% | +0.09% | -0.37% | +0.50% |
| Beta | -0.28% z-0.3 | +0.79% | -5.22% | -9.10% | -3.57% |
| Style | |||||
| Size | -0.54% z-1.6 | +0.19% | -0.48% | +1.56% | +3.87% |
| Profitability | -0.23% z-1.2 | -0.03% | +0.49% | +1.56% | -0.42% |
| Value | -0.18% z-0.8 | -0.24% | -0.09% | +0.77% | +0.25% |
| Dividend Yield | +0.13% z+0.7 | -0.20% | -0.27% | -1.02% | -0.78% |
| Liquidity | +0.15% z+0.6 | -0.05% | +0.10% | -0.75% | +2.49% |
| Growth | -0.13% z-0.5 | +0.12% | -0.47% | +0.61% | +0.96% |
| Leverage | +0.07% z+0.4 | -0.36% | -0.66% | -1.75% | -4.76% |
| Style-Momentum | |||||
| Short-Term Momentum | +0.28% z+0.9 | -0.14% | +0.65% | +1.84% | -3.70% |
| One-Day Momentum | +0.16% z+0.6 | -0.29% | +0.25% | -0.14% | -1.91% |
| Medium-Term Momentum | -0.12% z-0.4 | +0.29% | -0.72% | -0.22% | +0.41% |
| Long-Term Momentum | -0.01% z-0.0 | +0.45% | -1.52% | -0.88% | -1.03% |
| Style-Positioning | |||||
| Short Interest | +0.28% z+1.7 | +0.28% | +0.50% | -0.23% | -1.09% |
| Hedge-Fund Ownership | +0.05% z+0.5 | +0.16% | +0.20% | -0.09% | +0.03% |
| Style-Flow | |||||
| Morning Activity | -0.04% z-0.3 | -0.10% | -0.26% | -0.96% | +1.36% |
| Short-Sale Activity | -0.01% z-0.1 | -0.06% | +0.06% | -0.18% | +0.91% |
| Thematic | |||||
| Treasury (Duration) | +0.50% z+1.5 | -0.31% | +0.83% | -1.21% | -3.05% |
| Oil | -0.51% z-1.1 | +0.05% | -1.17% | +0.25% | +5.27% |
| Bitcoin / Crypto | +0.31% z+1.0 | +0.14% | -0.18% | -0.69% | +2.28% |
| China | +0.28% z+0.7 | +0.48% | +0.47% | +0.04% | +1.10% |
| Semiconductors | -0.32% z-0.5 | +0.13% | -2.42% | -3.31% | -4.82% |
| Gold | -0.02% z-0.1 | -0.16% | +0.34% | -1.35% | +2.31% |
5/20/60d windows include today's session; 1d is the previous session.
Pairwise realized correlation. Index variance net of the weighted idiosyncratic diagonal, over the cross terms — the estimator used for implied-correlation indices. 20-day window unless noted; history since 2020.
Market variance share. The fraction of cross-sectional variance explained by the market factor — the attribution companion to pairwise correlation, not a substitute for it.
Factor z-score. Today's factor return divided by its daily-return standard deviation over ~1,600 trading days.
Conditional importance. A factor's relative share of what a tree-based fit of today's stock returns explains; sums to 100% across factors.
High-beta momentum cohort. US names above $2B market cap in the top quintile of both raw beta and 12-month momentum; membership frozen at each month's first business day. “Top 50” = the 50 strongest by combined rank.
Dispersion (realized). Total cross-sectional volatility net of the market component; high dispersion is the flip side of low correlation.
Stock-specific (idiosyncratic) return. The part of a stock's move not explained by the market, style or thematic (industry and theme) factors in the FactorPulse risk model.
VIXEQ / DSPX / COR1M. Cboe implied indices: single-stock volatility, dispersion, and 1-month implied correlation (top-50 S&P names). Quotes delayed ~15 minutes.
Data compiled by FactorPulse AI; edited and verified by Jeff Klein. For informational purposes only. Does not constitute financial advice, an investment recommendation, or an offer to buy or sell any securities. Always consult a qualified financial professional before making investment decisions.
For more on factor construction methodology, see www.factorpulse.com/glossary.