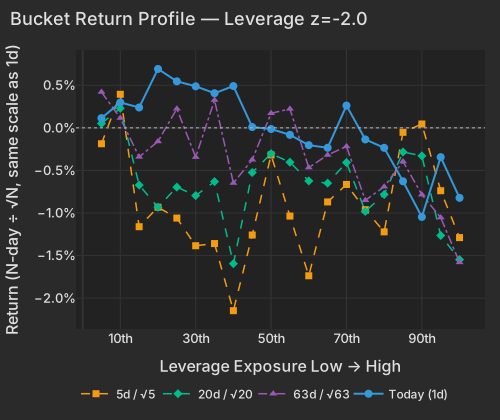
The 10-year Treasury yield rose to 5.14% on Monday, and the 30-year yield climbed to nearly 5.5%. The move extended a months-long selloff in the companies carrying the most debt, even as the Nasdaq-100 gained 1.3% and the S&P 500 rose 0.5%. Investments that trade like bonds fell. The utilities fund XLU dropped 2%, the real-estate fund IYR lost 1.2% and the homebuilder fund ITB fell 1.6%. Mortgage investor Annaly Capital slid 2.6%.
Much of the tech rebound came from traders buying back bets against heavily shorted stocks and Friday's biggest losers. It followed a Goldman Sachs report showing the largest weekly net selling of tech stocks in a decade. The 50 high-flying stocks most sensitive to market moves rose about 3%, recovering only a small slice of a 28% drop. The South Korea fund EWY jumped 4.3% and the memory-chip fund DRAM rose 4.1%, after losing 17% and 22% over the past month. Memory-chip maker SK hynix gained 5%, and bitcoin rose 1.3% to about $82,000. Amazon climbed 5%, adding about $130 billion in market value, after releasing free open-source software that lets developers run AI code on its own Trainium chips without rewriting it. The software is a challenge to Nvidia's software. Tesla rose 3.7% ahead of its earnings report Wednesday.
Money for building AI got harder to raise. Investors are pushing back on the $30 billion valuation sought by Nvidia-backed data-center developer Nscale for its initial public offering. They are countering with $16 billion to $19 billion, even as Nscale negotiates a $45 billion cloud-computing contract with Anthropic. Separately, S&P Global warned of potentially hidden AI debt at the biggest cloud companies and of bottlenecks in the aging U.S. power grid. Google faces local opposition over its Pine Island project in Minnesota. Steelmaker Cleveland-Cliffs jumped 17% after third-quarter results beat expectations on steel pricing. Before Tuesday's open, jet-engine maker GE Aerospace, defense contractors RTX and Northrop Grumman, industrial company 3M and automaker General Motors report results.
Style factors accounted for 27.7% of cross-sectional variance against a 23.0% one-year average, while the broad market explained 0.0% as the S&P 500 rose 0.5%. Friday's fear gauges came in notably. The VIX fell to about 18 from 21.86 on Friday, its highest level since June 10. Cboe's implied correlation index (COR1M) dropped to 9.33 from 12.56, back in the 3rd percentile of its range since 2006. That split reflects two opposing flows across the equity cross-section. Heavily shorted stocks outperformed (Short Interest +0.28%, z=+1.7) and Beta gained 0.84% (z=+0.9) after falling in all five prior sessions for a 5.43% five-day loss. At the same time, rising long-end yields pressured balance-sheet-heavy equities and long-duration bond proxies, pulling Treasury (Duration) down 0.33% (z=-1.0) and Dividend Yield down 0.18% (z=-1.0).
| Factor | Return | Z-Score | 5d Z | 20d Z | 63d Z | Category | Direction |
|---|---|---|---|---|---|---|---|
| Leverage | -0.34% | -2.0 | -1.7 | -2.5 | -3.5 | Style | Indebted names lagging |
| Short Interest | +0.28% | +1.7 | +0.4 | -0.4 | -1.2 | Style-Positioning | Most-shorted outperforming |
| Hedge-Fund Ownership | +0.14% | +1.3 | +0.3 | -0.2 | -0.3 | Style-Positioning | HF-owned outperforming |
| China | +0.49% | +1.2 | -0.0 | -0.1 | +0.3 | Thematic | China-exposed leading |
| One-Day Momentum | -0.30% | -1.1 | +0.4 | -0.2 | -0.6 | Style-Momentum | Friday losers bouncing |
| Medium-Term Momentum | +0.30% | +1.1 | -0.6 | -0.5 | +0.3 | Style-Momentum | 20-day winners continuing |
| Value | -0.25% | -1.1 | +0.6 | +1.0 | +0.4 | Style | Cheaper stocks lagging |
| Treasury (Duration) | -0.33% | -1.0 | +0.2 | -1.1 | -3.9 | Thematic | Bond-sensitive lagging |
The persistent drop in Leverage is the clearest sign that borrowing costs rather than equity sentiment are dictating cross-sectional risk. The 30-year Treasury yield rose 3.7 bps to 5.474% CNBC and the 20-year yield reached 5.523% (+3.6 bps) CNBC as equity gains reduced demand for government bonds Economic Times. In the most indebted decile of the Leverage factor, mortgage REITs and alternative asset managers bore the brunt of the selling. Annaly Capital Management (NLY) fell 2.6% — with -2.6% of the move driven by style tilts led by Leverage — while Blackstone Mortgage Trust (BXMT) and KKR & Co. (KKR) lagged alongside a 1.6% drop in homebuilders (ITB) and a 1.5% decline in Blackstone Secured Lending Fund (BXSL).
| Bucket | Ret 1D Pct | Ret 5D Norm Pct | Ret 20D Norm Pct | Ret 63D Norm Pct |
|---|---|---|---|---|
| 1 | 0.11 | -0.19 | 0.05 | 0.42 |
| 2 | 0.30 | 0.39 | 0.23 | 0.11 |
| 3 | 0.24 | -1.16 | -0.67 | -0.34 |
| 4 | 0.69 | -0.93 | -0.93 | -0.16 |
| 5 | 0.55 | -1.06 | -0.70 | 0.22 |
| 6 | 0.49 | -1.38 | -0.80 | -0.34 |
| 7 | 0.41 | -1.36 | -0.63 | 0.33 |
| 8 | 0.49 | -2.15 | -1.60 | -0.65 |
| 9 | 0.01 | -1.26 | -0.52 | -0.37 |
| 10 | -0.01 | -0.32 | -0.30 | 0.17 |
| 11 | -0.08 | -1.04 | -0.40 | 0.22 |
| 12 | -0.20 | -1.74 | -0.62 | -0.47 |
| 13 | -0.23 | -0.87 | -0.65 | -0.32 |
| 14 | 0.26 | -0.66 | -0.41 | -0.22 |
| 15 | -0.14 | -0.96 | -0.98 | -0.85 |
| 16 | -0.23 | -1.22 | -0.78 | -0.69 |
| 17 | -0.63 | -0.05 | -0.28 | -0.40 |
| 18 | -1.05 | 0.05 | -0.33 | -0.78 |
| 19 | -0.34 | -0.74 | -1.26 | -1.05 |
| 20 | -0.82 | -1.29 | -1.55 | -1.58 |
Fifth Third (FITB) showed none of the credit strain M&T flagged on Friday. Net charge-offs held at 0.31% of loans, against 0.30% in the second quarter, and the bank guided 0.30% to 0.35% for the fourth quarter SEC. Revenue rose 42% on the Comerica acquisition, though diluted earnings per share slipped to $0.90 from $0.91. The stock barely moved on the results.
After the close, Steel Dynamics (STLD) reported third-quarter earnings of $5.26 a share, below the $5.34 to $5.38 it guided in September SEC. Net sales rose 35% to $6.5 billion from a year earlier. Operating margin widened to 15.5% from 10.5%. The stock rose 1.8% in the regular session, then fell 5.2% in after-hours trading after the release, as of 5:29 PM ET.
Earnings reactions in the regular sessionReporters worth over $100 billion, or moving more than 10% with a value above $5 billion
| Company | Move | Stock-specific | Market cap | What drove it |
|---|---|---|---|---|
| Cleveland-Cliffs CLF | +16.9% | +16.2% | $7B | Q3 revenue and EBITDA beat on steel pricing The Wall Street Journal |
Stock-specific: the part of a stock's move not explained by the market, style or thematic (industry and theme) factors in the FactorPulse risk model.
Of the 500 largest companies, 34 have reported (8% of market cap), on day 13 of the season.
How earnings reactions split, day 13 of the seasonThe 500 largest US companies with a confirmed earnings reaction so far (30), vs the same day in the past eight seasons

| Season | ≤ −5σ | −5 to −2σ | −2 to 0σ | 0 to 2σ | 2 to 5σ | ≥ 5σ |
|---|---|---|---|---|---|---|
| This season | 7% | 27% | 24% | 33% | 6% | 3% |
| Past 8 seasons | 11% | 22% | 15% | 18% | 21% | 14% |
| Q2 2026 | 10% | 25% | 14% | 12% | 24% | 14% |
| Q1 2026 | 27% | 9% | 9% | 38% | 16% | 2% |
| Q4 2025 | 4% | 29% | 28% | 12% | 12% | 14% |
| Q3 2025 | 3% | 26% | 20% | 15% | 12% | 25% |
| Q2 2025 | 10% | 33% | 15% | 16% | 16% | 10% |
| Q1 2025 | 21% | 12% | 12% | 18% | 31% | 6% |
| Q4 2024 | 5% | 19% | 11% | 14% | 31% | 19% |
| Q3 2024 | 15% | 13% | 9% | 22% | 25% | 16% |
σ: a stock's earnings-day stock-specific move divided by its typical daily stock-specific move over the past year. Each bar is cut at the same business day of the season; companies weighted by the square root of market cap.
While secondary equity prices for volatile technology names rose, primary financing conditions for capital-intensive AI infrastructure builders tightened further. Institutional investors are pushing back against the $30 billion valuation sought by Nvidia-backed data-center developer Nscale for its planned initial public offering, counter-proposing a $16 billion to $19 billion range even as Nscale negotiates a $45 billion cloud computing contract with Anthropic Bloomberg Bloomberg. That valuation resistance coincides with an S&P Global warning flagging potentially hidden AI debt at hyperscalers and electrical grid bottlenecks across aging U.S. power infrastructure, where Google faces local opposition over its Pine Island project in Minnesota Bloomberg. The Global X Data Center & Digital Infrastructure ETF (DTCR) traded at 3.3× its typical session pace, closing the regular session down -0.4% before rising 1.0% in late trading for a combined +0.6% mark.
Within megacap cloud providers, Amazon (AMZN) gained 5.0%, adding $132.2B of market value on a 3.6% stock-specific move after its Annapurna Labs unit released TorchNeuron Economic Times. The open-source software allows developers to run PyTorch AI workloads directly on Amazon's custom Trainium chips without manual code rewriting, challenging Nvidia's CUDA software ecosystem Economic Times. Elsewhere in single-name movers, Disc Medicine (IRON) surged 37.2% (+36.9% stock-specific), Palantir (PLTR) gained 4.6%, and Tesla (TSLA) rose 3.7% ahead of its Wednesday earnings report. Sea Limited (SE) fell -5.6% (-5.7% stock-specific), erasing $3.1B of market value following insider selling disclosures. In post-close trading, Woodward (WWD) rose 5.6% after closing the regular session up 0.3% (+6.0% combined), while Brunswick (BC) gained 7.5% after the bell following a -0.9% regular-session decline (+6.6% combined).
The rebound in technology and biotech was driven by short-covering and a snapback in Friday's deepest losers rather than fresh thematic leadership. Yesterday's winners and losers — One-Day Momentum in the table — fell -0.30% (z=-1.1) as Friday's laggards bounced, while 20-day momentum — Medium-Term Momentum in the table — gained 0.30% (z=+1.1). Stocks with heavier hedge-fund ownership outperformed by 0.14% (z=+1.3) on a residualized basis and 0.29% (z=+2.0) on a raw basis. Even so, the top 50 high-beta momentum names gained 2.8% (and the broader ~190-name high-beta momentum group rose 1.8% against -0.2% for stocks outside the screen), clawing back only a fraction of a -27.7% drawdown through Friday's close, after Goldman Sachs reported the largest weekly net tech selling in a decade for the period ended October 16.
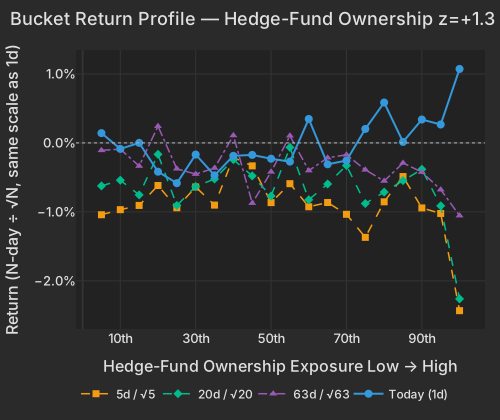
| Bucket | Ret 1D Pct | Ret 5D Norm Pct | Ret 20D Norm Pct | Ret 63D Norm Pct |
|---|---|---|---|---|
| 1 | 0.14 | -1.04 | -0.62 | -0.11 |
| 2 | -0.09 | -0.97 | -0.54 | -0.09 |
| 3 | 0.00 | -0.91 | -0.75 | -0.34 |
| 4 | -0.42 | -0.62 | -0.17 | 0.24 |
| 5 | -0.58 | -0.94 | -0.91 | -0.38 |
| 6 | -0.17 | -0.64 | -0.63 | -0.45 |
| 7 | -0.47 | -0.90 | -0.52 | -0.36 |
| 8 | -0.19 | -0.21 | -0.24 | 0.11 |
| 9 | -0.17 | -0.33 | -0.48 | -0.87 |
| 10 | -0.23 | -0.87 | -0.77 | -0.42 |
| 11 | -0.27 | -0.59 | -0.07 | 0.10 |
| 12 | 0.35 | -0.93 | -0.82 | -0.40 |
| 13 | -0.31 | -0.86 | -0.60 | -0.22 |
| 14 | -0.26 | -1.04 | -0.33 | -0.17 |
| 15 | 0.20 | -1.37 | -0.88 | -0.39 |
| 16 | 0.59 | -0.85 | -0.71 | -0.55 |
| 17 | 0.01 | -0.49 | -0.55 | -0.29 |
| 18 | 0.34 | -0.94 | -0.38 | -0.42 |
| 19 | 0.27 | -1.02 | -0.91 | -0.68 |
| 20 | 1.07 | -2.43 | -2.26 | -1.05 |
That partial relief was most visible in memory chips, South Korean equities, and crypto miners. The iShares MSCI South Korea ETF (EWY +4.3%) and the Roundhill Memory ETF (DRAM +4.1%) led the ETF universe today after falling -17.0% and -22.1% over the prior 20 sessions, while the CoinShares Bitcoin Mining ETF (WGMI) gained 1.0% on 2.0× its typical volume pace after a -36.8% 20-day slide (1.0th percentile since February 2022) as spot bitcoin traded at $81,919.18 at 4:13 PM ET (+1.3%) CNBC. SK hynix (SKHY) rose 5.0% (+4.8% in the regular session) despite company-specific headwinds: Chinese rival CXMT projected an over eightfold revenue jump as it scales domestic DRAM capacity The Wall Street Journal, and South Korea's Financial Supervisory Service warned that a potential U.S. listing for SK hynix subsidiary Solidigm could violate domestic dual-listing rules Economic Times Bloomberg.
| ETF | Theme | Today | 1d Ago | 5d Ago | 20d Ago | 63d Ago |
|---|---|---|---|---|---|---|
| EWY | south korea | +4.3% | -3.7% | -15.1% | -17.0% | -7.6% |
| DRAM | memory chips & storage | +4.1% | -5.8% | -18.8% | -22.1% | -12.5% |
| XBI | biotech growth | +2.6% | -3.7% | -6.2% | -7.9% | -4.4% |
| SMH | semiconductors | +1.7% | -3.4% | -10.5% | -5.8% | -3.4% |
| IGV | software | +1.7% | -4.8% | -7.4% | -0.01% | +12.2% |
| WGMI | crypto miners | +1.0% | -9.9% | -22.2% | -36.8% | -40.6% |
| IYR | real estate | -1.2% | +0.4% | +1.3% | -0.6% | -7.1% |
| ITB | homebuilders | -1.6% | -0.4% | +1.9% | -1.2% | -8.7% |
| XLU | utilities | -2.0% | +1.3% | +1.9% | +3.5% | -5.4% |
| VXX | volatility | -3.1% | +7.6% | +8.2% | +3.5% | -16.9% |
Industrial and defense bellwethers GE Aerospace (GE), RTX (RTX -0.9% today), 3M (MMM), Northrop Grumman (NOC), and General Motors (GM) are scheduled to report third-quarter results before Tuesday's open.
Variance decomposition: live intraday — 20261019 session, bracketed against its trailing-year range. Factor returns are trailing through last close. Total cross-sectional dispersion: 7.2%ile of the past year.
Variance mix — % of total, today vs 1d ago vs 1-yr avg
market 0.0%ile style 77%ile thematic 12%ile idiosyncratic 48%ile
Variance explained — today vs. factor's trailing-year range
Marker = the factor's share of today's total variance, placed in its own trailing-year range (box 25–75%ile, ticks 90%ile and max). Amber marker = unusually load-bearing today (≥90%ile of its own year). Factor name green = up today / red = down.
Correlation & dispersion — realized vs implied
Pairwise realized correlation (20d): 10.17% 10%ile since 2020 · 93.7%ile 3m
Top-500 pairwise: 10.51% 9.5%ile since 2020 · 52%ile 3m · implied (Cboe COR1M): 9.33 3.4%ile since 2006 (gap +1.2pp)
Realized 20d vol (ann. pts): all stocks 37 vs VIXEQ 41 · index 11 vs VIX 18 · style factors 19 66%ile
20-day window (19 completed days + today); percentiles vs model history since 2020; '3m' tokens rank vs the trailing 63 trading days; definitions in Terms below. Implied prints (Cboe) are delayed ~15 min. as of 15:58 ET
Top 50 high-beta momentum names (eq-wt, since-2020 rank): +2.8% 85%ile · rest of market -0.2%
| Factor | Today | 1d | 5d | 20d | 60d |
|---|---|---|---|---|---|
| Style-Risk | |||||
| Residual Volatility | +0.48% z+1.0 | -1.20% | -0.80% | -0.50% | +4.87% |
| Beta | +0.84% z+0.9 | -2.44% | -5.43% | -7.77% | -3.37% |
| International | -0.20% z-0.7 | +0.39% | +0.34% | -0.20% | +0.70% |
| Style | |||||
| Leverage | -0.34% z-2.0 | +0.14% | -0.65% | -1.89% | -5.17% |
| Value | -0.25% z-1.1 | +0.45% | +0.60% | +0.98% | +0.41% |
| Dividend Yield | -0.18% z-1.0 | +0.20% | -0.38% | -1.24% | -1.29% |
| Size | +0.22% z+0.6 | +0.27% | +0.16% | +1.88% | +3.98% |
| Growth | +0.12% z+0.5 | -0.17% | -0.26% | +0.61% | +1.16% |
| Liquidity | -0.06% z-0.2 | -0.20% | +0.04% | -0.92% | +2.30% |
| Profitability | -0.03% z-0.2 | +0.21% | +1.00% | +1.99% | -0.15% |
| Style-Momentum | |||||
| One-Day Momentum | -0.30% z-1.1 | -0.12% | +0.27% | -0.20% | -1.38% |
| Medium-Term Momentum | +0.30% z+1.1 | -0.06% | -0.38% | -0.63% | +1.24% |
| Long-Term Momentum | +0.43% z+0.7 | -0.40% | -1.50% | -0.72% | -2.95% |
| Short-Term Momentum | -0.18% z-0.6 | +0.07% | +0.25% | +1.74% | -4.94% |
| Style-Positioning | |||||
| Short Interest | +0.28% z+1.7 | -0.29% | +0.15% | -0.29% | -1.21% |
| Hedge-Fund Ownership | +0.14% z+1.3 | -0.12% | +0.06% | -0.10% | -0.02% |
| Style-Flow | |||||
| Morning Activity | -0.09% z-0.7 | -0.09% | -0.28% | -0.89% | +1.41% |
| Short-Sale Activity | -0.07% z-0.6 | +0.08% | +0.20% | -0.08% | +1.05% |
| Thematic | |||||
| China | +0.49% z+1.2 | -0.65% | -0.02% | -0.18% | +0.93% |
| Treasury (Duration) | -0.33% z-1.0 | -0.11% | +0.19% | -1.14% | -3.95% |
| Bitcoin / Crypto | +0.15% z+0.5 | -0.85% | -0.57% | -1.02% | +2.21% |
| Gold | -0.14% z-0.4 | +0.07% | +0.08% | -1.04% | +2.29% |
| Semiconductors | +0.15% z+0.2 | -0.16% | -2.19% | -2.97% | -6.47% |
| Oil | +0.07% z+0.2 | +0.48% | -0.27% | +0.70% | +5.24% |
5/20/60d windows include today's session; 1d is the previous session.
Pairwise realized correlation. Index variance net of the weighted idiosyncratic diagonal, over the cross terms — the estimator used for implied-correlation indices. 20-day window unless noted; history since 2020.
Market variance share. The fraction of cross-sectional variance explained by the market factor — the attribution companion to pairwise correlation, not a substitute for it.
Factor z-score. Today's factor return divided by its daily-return standard deviation over ~1,600 trading days.
Conditional importance. A factor's relative share of what a tree-based fit of today's stock returns explains; sums to 100% across factors.
High-beta momentum cohort. US names above $2B market cap in the top quintile of both raw beta and 12-month momentum; membership frozen at each month's first business day. “Top 50” = the 50 strongest by combined rank.
Dispersion (realized). Total cross-sectional volatility net of the market component; high dispersion is the flip side of low correlation.
Stock-specific (idiosyncratic) return. The part of a stock's move not explained by the market, style or thematic (industry and theme) factors in the FactorPulse risk model.
VIXEQ / DSPX / COR1M. Cboe implied indices: single-stock volatility, dispersion, and 1-month implied correlation (top-50 S&P names). Quotes delayed ~15 minutes.
Data compiled by FactorPulse AI; edited and verified by Jeff Klein. For informational purposes only. Does not constitute financial advice, an investment recommendation, or an offer to buy or sell any securities. Always consult a qualified financial professional before making investment decisions.
For more on factor construction methodology, see www.factorpulse.com/glossary.