Macro: Wednesday's 3.7% September CPI and Thursday's 1.3% PPI jump kept inflation worries alive. The 10-year yield held near 5.09% while the 2-year fell to 4.73%, and Eurostat confirmed eurozone inflation at 3.8%.
Market Moves:SPYrose 0.1% and IWMfell 0.2% as money rotated out of volatile groups: CoreWeavefell 7.3% and Nebius6.1%, IGV2.5%, XBI2.0% and the miner fund WGMI3.8%. Materials (+1.5%), energy (+1.2%), ITA and GDX (+2.1% each) led.
Factors:Residual Volatility fell 0.96% (z=-1.9) and Beta 0.90% while Value rose 0.29% (z=+1.2). Style factors explained 43.4% of variance, the 93rd percentile of the past year, and the market almost none. Bitcoin / Crypto (-0.68%, z=-2.2) reflected AI-hosting miners, not bitcoin, which was flat.
Micro:Alcoarose 7.8% on higher third-quarter profit and tight alumina supply. Truist Financialgained 2.0% after its morning earnings release. Hut 8 fell 4.7%, almost entirely on its factor exposures.
Watch: Will Fifth Third Bancorp's results before Monday's October 19 open extend the bank bid, in a season where just 10% of reporters have posted solid stock-specific gains versus 35% at this point in the past eight seasons?
October 16, 2026 · 10:52 ET · Updated 12:08 ET
The S&P 500 fund SPY barely moved Friday morning, up 0.1%, but beneath the calm investors were pulling money out of the market's most volatile stocks, led by the companies building out artificial-intelligence computing. AI-cloud operators CoreWeave and Nebiusfell 6% to 7%, and bitcoin miners slid even though Bitcoin itself barely budged at about $82,000: many of the largest now earn much of their money hosting AI computing, and the miner fund WGMIfell nearly 4%. Biotech and software sold off too, with the biotech fund XBIdown 2%, the software fund IGVdown 2.5% and vaccine maker Modernadown nearly 10%. Chip stocks headed for a fifth straight losing day as memory-chip maker SK Hynixfell about 4%.
The money went to cheaper, steadier corners. Aluminum maker Alcoajumped about 8% after reporting higher third-quarter profit and revenue, helping materials stocks gain 1.5% and energy stocks 1.2%. Banks rose too: JPMorgan Chasegained 2%, adding about $18 billion in market value, and regional lender Truistrose 2% after its earnings, lifting the regional-bank fund KRE 1.3%. The defense fund ITA and the gold-miner fund GDX each rose about 2%, and the consumer-staples fund XLPadded 0.8%.
The backdrop was a week of hot inflation reports: consumer prices rose 3.7% from a year earlier in September, reported Wednesday, and producer prices jumped 1.3% in a month, reported Thursday. Abroad, Europe's statistics agency confirmed eurozone inflation sped up to 3.8%, and the euro rose to about $1.13. The 10-year Treasury yield edged up to about 5.09% while the 2-year fell to about 4.73%. Earnings season has been short on winners: weighted by size, only about one in ten reporters so far has posted a solid gain on its own news, against about a third at this point in past seasons.
How earnings reactions split, day 12 of the seasonThe 1,000 largest US companies that have reported so far (34), vs the same day in the past eight seasons; 9 still trading intraday
Weighted by size, 10% of this season's reporters rose 2σ or more on a stock-specific basis, against 35% at this point in the past eight seasons; 35% fell 2σ or more (past: 33%).
Earnings reactions this season vs the past eight seasons, day 12
Season
≤ −5σ
−5 to −2σ
−2 to 0σ
0 to 2σ
2 to 5σ
≥ 5σ
This season
7%
28%
25%
30%
7%
3%
Past 8 seasons
12%
21%
13%
19%
22%
13%
Q2 2026
10%
26%
14%
13%
23%
13%
Q1 2026
26%
9%
11%
34%
16%
2%
Q4 2025
7%
34%
18%
12%
14%
15%
Q3 2025
5%
26%
15%
15%
14%
24%
Q2 2025
12%
23%
18%
22%
13%
12%
Q1 2025
11%
11%
8%
13%
48%
9%
Q4 2024
7%
24%
10%
16%
29%
13%
Q3 2024
16%
7%
7%
25%
30%
15%
σ: a stock's earnings-day stock-specific move divided by its typical daily stock-specific move over the past year. Each bar is cut at the same business day of the season; companies weighted by the square root of market cap.
Of the 500 largest companies, 31 have reported (8% of market cap), on day 12 of the season.
Volatile Stocks Fell 1% as AI Infrastructure, Biotech and Software Sold Off
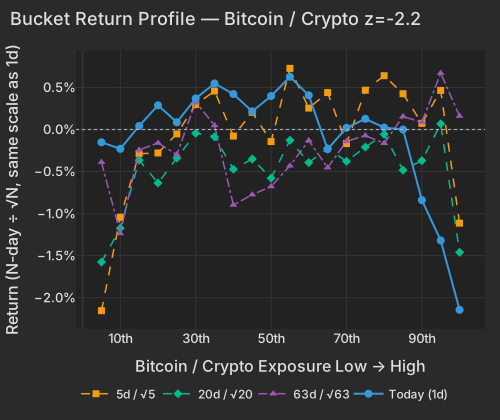
The Bitcoin / Crypto factor dropped 0.68% at z=-2.2, its lowest session-so-far reading since April 2026 (0.4th percentile since 2020), even as spot Bitcoin held at $82,222.94 at 10:44 AM EDT (-0.2%) CNBC and the ProShares Bitcoin Strategy ETF (BITO) slipped just 0.1%. After Wednesday's hotter-than-expected 3.7% September CPI bls.gov and Thursday's 1.3% jump in producer prices, U.S. spot Bitcoin ETFs saw $262 million in net outflows and over $938 million in leveraged longs were liquidated as Bitcoin briefly broke below $80,000 to $79,770. While the token stabilized on Friday as the U.S. Dollar Index (DXY) eased 0.4% to 101.651 at 10:45 AM EDT CNBC, equity investors continued selling crypto miners: the CoinShares Bitcoin Mining ETF (WGMI) fell 3.8%, deepening its 20-day drop to 24.9%, while Hut 8 (HUT) lost 4.7% almost entirely on its factor exposures (-5.2% factor contribution versus +0.5% stock-specific).
The miners falling hardest are the ones that now rent out data-center capacity for AI computing: Hut 8, IREN (IREN), CleanSpark (CLSK) and Cipher Mining (CIFR) fell between 3.8% and 4.8%, while Coinbase (COIN -0.7%) and Robinhood (HOOD, flat), with the same crypto exposure, barely moved. The AI-cloud operators fell harder still: CoreWeave (CRWV) lost 7.3% and Nebius (NBIS) 6.1%. Much of the Bitcoin / Crypto factor's z=-2.2 is the AI-infrastructure selloff registering under a crypto label.
Factor
Return
Z-Score
5d Z
20d Z
63d Z
Category
Direction
Bitcoin / Crypto
-0.68%
z=-2.2
-0.6
-0.7
+0.7
Thematic
High crypto exposure lagged
Residual Volatility
-0.96%
z=-1.9
-1.3
-0.2
+0.9
Style-Risk
Most volatile stocks lagged
China
-0.56%
z=-1.4
-0.8
-0.2
+0.1
Thematic
China-exposed names lagged
Short Interest
-0.23%
z=-1.4
+0.0
-0.6
-1.5
Style-Positioning
Most-shorted names underperformed
Value
+0.29%
z=+1.2
+1.7
+0.8
+0.6
Style
Cheapest names outperformed
Beta
-0.90%
z=-0.9
-3.0
-1.2
-0.4
Style-Risk
High-beta names underperformed
Dividend Yield
+0.15%
z=+0.9
-0.6
-1.7
-0.6
Style
Higher-yield names outperformed
Hedge-Fund Ownership
-0.09%
z=-0.8
-0.2
-0.1
-0.6
Style-Positioning
Heavily HF-owned names lagged
Bitcoin / Crypto fell to z=-2.23 today with high-exposure buckets averaging -0.86% on a 1-day basis, reversing their positive 63-day slope (+0.54 monotonicity).
Bucket Return Profile — Bitcoin / Crypto z=-2.2
Bucket
Ret 1D Pct
Ret 5D Norm Pct
Ret 20D Norm Pct
Ret 63D Norm Pct
1
-0.15
-2.15
-1.58
-0.39
2
-0.23
-1.04
-1.17
-1.24
3
0.04
-0.29
-0.36
-0.24
4
0.29
-0.28
-0.64
-0.16
5
0.09
-0.05
-0.34
-0.30
6
0.37
0.30
-0.04
0.33
7
0.55
0.46
-0.09
0.05
8
0.42
-0.08
-0.47
-0.90
9
0.22
0.20
-0.35
-0.77
10
0.40
-0.14
-0.58
-0.68
11
0.63
0.73
-0.13
-0.43
12
0.41
0.25
-0.39
-0.13
13
-0.23
0.44
-0.23
-0.45
14
0.02
-0.17
-0.38
-0.14
15
0.13
0.47
-0.21
-0.07
16
0.02
0.64
-0.06
-0.16
17
0.00
0.43
-0.48
0.15
18
-0.84
0.07
-0.37
0.09
19
-1.32
0.46
0.07
0.67
20
-2.14
-1.11
-1.46
0.16
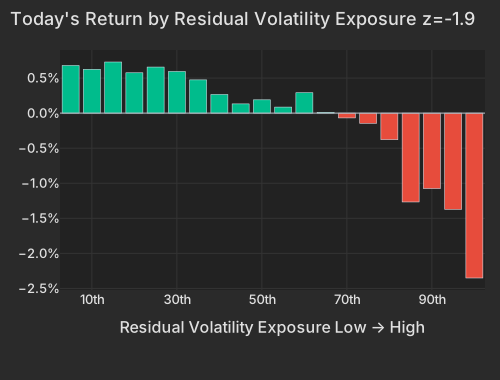
The selling in speculative equities ran well beyond crypto proxies. Residual Volatility fell 0.96% (z=-1.9) and accounted for 18.2% of total cross-sectional variance, exceeding its prior one-year maximum share. Together with Beta (-0.90%, z=-0.9, explaining 16.5% of variance), the risk factors pushed the total style share of variance to 43.4% (93.2nd percentile of the past year), while the broad market explained just 0.1%. The most volatile exposure bucket dropped 2.4%, hitting biotechnology and high-multiple software: the SPDR S&P Biotech ETF (XBI) fell 2.0% and the iShares Expanded Tech-Software Sector ETF (IGV) lost 2.5%.
Residual Volatility posted z=-1.931 as losses concentrated in the highest-volatility exposure bucket at -2.4%.
Today's Return by Residual Volatility Exposure z=-1.9
Bucket
Avg Ret Pct
1
0.68
2
0.63
3
0.73
4
0.58
5
0.66
6
0.59
7
0.47
8
0.27
9
0.13
10
0.19
11
0.09
12
0.29
13
0.01
14
-0.07
15
-0.14
16
-0.38
17
-1.27
18
-1.08
19
-1.37
20
-2.35
Factor decomposition shows how heavily common risk exposures weighed on individual biotech and tech movers. Iovance Biotherapeutics (IOVA) fell 5.3% on a -5.5% factor drag with a nearly flat +0.2% stock-specific return, while Moderna (MRNA) dropped 9.6% (erasing $9.5B in market value), split between a -4.6% style drag and a -5.2% stock-specific drop. In software, Snowflake (SNOW -4.7%) and Palo Alto Networks (PANW -4.2%) lost 2.4% and 2.3% on style tilts alone. In semiconductors, SK Hynix ADRs (SKHY) fell 4.3% (erasing $44.9B of market value) and Taiwan Semiconductor (TSM) slipped 1.4%, keeping the Semiconductors factor down 0.27% (z=-0.4) for a fifth consecutive negative session (-2.91% over five days). China fell 0.56% (z=-1.4) as FXI lost 0.8%.
Value, Cyclicals, and Defense Climb as Alcoa Beats Q3 Estimates
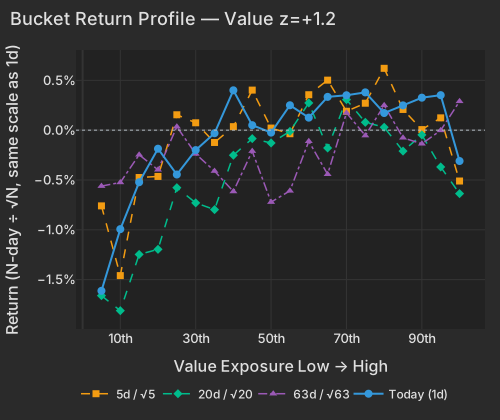
On the other side of the ledger, Value rose +0.29% (z=+1.2), bringing its five-day gain to 0.88% (z=+1.7) and its 60-day cumulative return to 0.75%. Unlike single-day factor snaps, Value's cross-horizon return profile shows positive monotonicity across 1-day (+0.65), 5-day (+0.46), 20-day (+0.63), and 63-day (+0.59) windows, driven today by investors selling the most expensive growth-priced bucket (-1.6%) while bidding up cheaper cyclicals and financials.
Value rose to z=+1.238 with consistent positive slope across 1-day (0.648), 5-day (0.462), 20-day (0.633), and 63-day (0.591) horizons as the most expensive left-tail buckets averaged -0.75%.
Bucket Return Profile — Value z=+1.2
Bucket
Ret 1D Pct
Ret 5D Norm Pct
Ret 20D Norm Pct
Ret 63D Norm Pct
1
-1.61
-0.76
-1.66
-0.56
2
-0.99
-1.46
-1.81
-0.53
3
-0.52
-0.48
-1.25
-0.25
4
-0.19
-0.46
-1.20
-0.40
5
-0.45
0.15
-0.58
0.03
6
-0.20
0.07
-0.73
-0.24
7
-0.03
-0.12
-0.80
-0.41
8
0.40
0.04
-0.25
-0.62
9
0.05
0.40
-0.08
-0.21
10
-0.02
0.02
-0.13
-0.72
11
0.25
-0.04
-0.01
-0.61
12
0.13
0.36
0.27
-0.11
13
0.33
0.50
-0.18
-0.44
14
0.35
0.19
0.31
0.17
15
0.38
0.27
0.08
-0.05
16
0.17
0.62
0.03
0.25
17
0.25
0.21
-0.21
-0.08
18
0.33
0.01
-0.05
-0.14
19
0.35
0.12
-0.37
-0.00
20
-0.31
-0.51
-0.64
0.29
Materials (+1.5%) and Energy (+1.2%) led sector gains. Alcoa (AA) jumped 7.8% (+6.8% stock-specific) after reporting higher third-quarter net income and revenue on increased global production volumes and tight alumina supply, shrugging off stalled U.S.-Mexico trade talks over metal and auto tariffs WSJ. Financials also advanced (XLF +1.0%, KRE +1.3%), led by JPMorgan Chase (JPM +2.1%, adding $18.3B of market value) and regional lender Truist Financial (TFC +2.0%) following its morning earnings release. In India, HDFC Bank (HDB) rose 1.5% ahead of its results on Saturday, when peer ICICI Bank also reports; analysts projected 15% to 21% year-on-year second-quarter profit growth for ICICI alongside 20 bps of sequential margin compression Economic Times. Across the 34 third-quarter earnings reactions among the 1,000 largest US companies so far this season (9 still intraday), only 10% have risen 2σ or more on a stock-specific basis compared with 35% at the same point across the past eight seasons.
ETF
Theme
Today
1d Ago
5d Ago
20d Ago
63d Ago
ITA
Defense
+2.1%
+1.3%
+1.0%
-3.3%
-10.2%
GDX
Gold Miners
+2.1%
+4.3%
+0.4%
-9.3%
+22.0%
XLB
Materials
+1.5%
+1.8%
+2.6%
+0.2%
+0.5%
KRE
Regional Banking
+1.3%
+1.8%
+0.2%
-3.6%
-8.5%
XLE
Energy
+1.2%
-1.6%
+2.0%
+3.9%
+16.1%
XLP
Consumer Staples
+0.8%
+0.7%
+3.9%
+4.5%
+2.4%
SMH
Semiconductors
-0.9%
-1.0%
-8.0%
-0.3%
+0.4%
XBI
Biotech Growth
-2.0%
+2.1%
+0.3%
-5.4%
-2.9%
IGV
Software
-2.5%
+1.8%
+0.01%
+3.6%
+18.1%
WGMI
Crypto Miners
-3.8%
+2.7%
-13.7%
-24.9%
-27.0%
Positioning and dispersion signals confirm that Friday's factor shift is occurring without an index-level shock or a short squeeze. Short Interest fell -0.23% (z=-1.4, -2.03% over 63 days at z=-1.5), meaning the most heavily shorted stocks continued to lag un-shorted peers, while stocks with heavier hedge-fund ownership lagged by 0.22% on a raw basis (z=-1.5) and 0.09% net of style tilts (z=-0.8). Meanwhile, 20-day realized pairwise correlation sits at 10.20% (10.0th percentile since 2020, 95.2nd percentile over the past three months) and implied 1-month correlation (Cboe COR1M) trades at 7.38 (1.0th percentile since 2006), leaving implied dispersion (Cboe DSPX) elevated at 36.95 (95.8th percentile) as single-stock and style swings continue to dominate a flat index.
Long-End Yields Hold Above 5.09% and Euro Rebounds on 3.8% CPI
In fixed income and currencies, the Treasury curve twisted slightly steeper as front-end yields eased while long-end rates held firm: the 2-year yield fell 2.4 bps to 4.727% at 10:44 AM EDT, whereas the 10-year yield rose 0.7 bps to 5.094% and the 30-year added 0.5 bps to 5.433% CNBC. In Europe, Eurostat confirmed that eurozone annual inflation accelerated to 3.8% in September from 3.2% in August, with energy adding 1.71 percentage points and services 1.52 percentage points, lifting the Euro to 1.1255 Ec and sending the CurrencyShares Euro Trust (FXE) up 0.4% on 2.0× its typical session volume pace. Spot gold gained 0.5% to $4,190.14/oz at 10:44 AM EDT CNBC, lifting the VanEck Gold Miners ETF (GDX) 2.1%, while front-month WTI crude slipped 0.6% to $97.38/bbl at 10:35 AM EDT CNBC. Defense and Consumer Staples ETFs also drew bids, with iShares U.S. Aerospace & Defense (ITA) up 2.1% and Consumer Staples (XLP) rising 0.8% on 2.1× its typical volume pace to reach +8.6% month to date (its third-best month since late 2018). Fifth Third Bancorp (FITB) is due to report third-quarter results before the open on October 19.
Economic Context
The New York Fed Staff Nowcast is due at 12:45 PM ET, with the fourth-quarter 2026 GDP growth tracker entering today's update at 2.8% following upward revisions from 2.5% on firm domestic demand bea.gov. Analysts expect the release to incorporate recent industrial production and import price figures, keeping the growth estimate above the FOMC's 2.0% long-run median projection while highlighting downside risks from cost-push inflation and trade policy uncertainty federalreserve.gov.
Factor Regime Reference
Variance decomposition: live intraday — 20261016 session, bracketed against its trailing-year range. Factor returns are trailing through last close. Total cross-sectional dispersion: 2.8%ile of the past year.
Variance mix — % of total, today vs 1d ago vs 1-yr avg
Variance explained — today vs. factor's trailing-year range
Marker = the factor's share of today's total variance, placed in its own trailing-year range (box 25–75%ile, ticks 90%ile and max). Amber marker = unusually load-bearing today (≥90%ile of its own year). Factor name green = up today / red = down.
Realized 20d vol (ann. pts): all stocks 37 vs VIXEQ 40 · index 10 vs VIX 16 · style factors 1862%ile
20-day window (19 completed days + today); percentiles vs model history since 2020; '3m' tokens rank vs the trailing 63 trading days; definitions in Terms below. Implied prints (Cboe) are delayed ~15 min. as of 10:41 ET
Top 50 high-beta momentum names (eq-wt, since-2020 rank): -2.6%15%ile · rest of market +0.4%
Trailing factor returns
Factor
Today
1d
5d
20d
60d
Style-Risk
Residual Volatility
-0.96%z-1.9
+0.26%
-1.42%
-0.43%
+3.98%
Beta
-0.90%z-0.9
-0.48%
-6.39%
-5.34%
-4.86%
International
+0.18%z+0.6
-0.04%
+0.41%
-0.21%
+0.61%
Style
Value
+0.29%z+1.2
-0.06%
+0.88%
+0.81%
+0.75%
Dividend Yield
+0.15%z+0.9
-0.29%
-0.25%
-1.30%
-1.35%
Profitability
+0.16%z+0.8
+0.20%
+1.02%
+1.84%
-0.11%
Leverage
+0.11%z+0.7
-0.24%
-0.38%
-1.54%
-4.93%
Growth
-0.10%z-0.4
+0.05%
-0.33%
+0.69%
+1.17%
Liquidity
-0.07%z-0.3
+0.52%
+0.16%
-0.72%
+1.81%
Size
+0.05%z+0.1
-0.85%
+0.08%
+1.77%
+3.58%
Style-Momentum
Long-Term Momentum
-0.47%z-0.7
-1.52%
-2.23%
-1.41%
-4.83%
Medium-Term Momentum
-0.15%z-0.5
-0.59%
-0.69%
-0.95%
+1.53%
One-Day Momentum
-0.02%z-0.1
+0.68%
+0.65%
+0.02%
-1.23%
Short-Term Momentum
+0.01%z+0.0
+0.33%
+0.56%
+2.31%
-5.29%
Style-Positioning
Short Interest
-0.23%z-1.4
+0.14%
+0.00%
-0.43%
-1.25%
Hedge-Fund Ownership
-0.09%z-0.8
+0.21%
-0.04%
-0.07%
-0.17%
Style-Flow
Short-Sale Activity
+0.06%z+0.5
+0.17%
+0.38%
-0.13%
+1.21%
Morning Activity
+0.01%z+0.1
+0.05%
-0.12%
-0.92%
+1.53%
Thematic
Bitcoin / Crypto
-0.68%z-2.2
+0.40%
-0.42%
-0.99%
+1.96%
China
-0.56%z-1.4
+0.35%
-0.72%
-0.38%
+0.68%
Gold
+0.21%z+0.7
+0.44%
+0.39%
-1.11%
+2.78%
Semiconductors
-0.27%z-0.4
-1.52%
-2.91%
-3.62%
-8.12%
Oil
+0.15%z+0.3
-1.08%
-0.65%
-0.17%
+4.06%
Treasury (Duration)
-0.02%z-0.1
+1.02%
+0.46%
-0.96%
-3.35%
5/20/60d windows include today's session; 1d is the previous session.
Terms
Pairwise realized correlation.Index variance net of the weighted idiosyncratic diagonal, over the cross terms — the estimator used for implied-correlation indices. 20-day window unless noted; history since 2020.
Factor z-score.Today's factor return divided by its daily-return standard deviation over ~1,600 trading days.
Dispersion (realized).Total cross-sectional volatility net of the market component; high dispersion is the flip side of low correlation.
Stock-specific (idiosyncratic) return.The part of a stock's move not explained by the market, style or thematic (industry and theme) factors in the FactorPulse risk model.
Data compiled by FactorPulse AI; edited and verified by Jeff Klein. For informational purposes only. Does not constitute financial advice, an investment recommendation, or an offer to buy or sell any securities. Always consult a qualified financial professional before making investment decisions.