This week's hot inflation reports, a 3.7% consumer-price reading on Wednesday and a 1.3% jump in producer prices on Thursday, kept pressure on crypto-linked and speculative stocks Friday morning, even as Bitcoin itself settled down. The selling had briefly knocked Bitcoin below $80,000, forcing the sale of more than $900 million in borrowed bets that it would rise and prompting investors to pull about $260 million from Bitcoin funds. On Friday the coin slipped just 0.2% to about $82,000 as the dollar eased. Even so, the crypto-miner fund WGMI fell nearly 4%, bringing its loss over the past month to about 25%. The selling spread to the market's most volatile corners. The biotech fund XBI fell 2%, vaccine maker Moderna dropped nearly 10%, and the software fund IGV lost 2.5%. Memory-chip maker SK Hynix slid about 4% as chip stocks headed for a fifth straight losing day. The S&P 500 fund SPY was up just 0.1%.
Investors moved money into cheaper, steadier corners. Aluminum maker Alcoa jumped about 8% after reporting higher third-quarter profit and revenue on bigger production and tight alumina supply, helping materials stocks gain 1.5% and energy stocks 1.2%. Banks rose too: JPMorgan Chase gained 2%, adding about $18 billion in market value, and regional lender Truist rose 2% after its morning earnings report, lifting the regional-bank fund KRE 1.3%. The defense fund ITA and the gold-miner fund GDX each rose about 2% as gold climbed 0.5% to roughly $4,190 an ounce. The consumer-staples fund XLP added 0.8%, putting it up nearly 9% for the month. Earnings season has otherwise been short on big winners: only about 10% of companies reporting so far have jumped sharply on their own news, versus roughly 35% at this point in past seasons.
Abroad, Europe's statistics agency confirmed that eurozone inflation sped up to 3.8% in September from 3.2% in August, driven by energy and services, and the euro rose to about $1.13. In the U.S. bond market, the 10-year Treasury yield edged up to about 5.09% while the 2-year yield fell to about 4.73%. Oil slipped 0.6% to about $97 a barrel. The New York Fed's latest estimate of economic growth was due at 12:45 p.m. Eastern, and it entered the day tracking fourth-quarter growth at 2.8%.
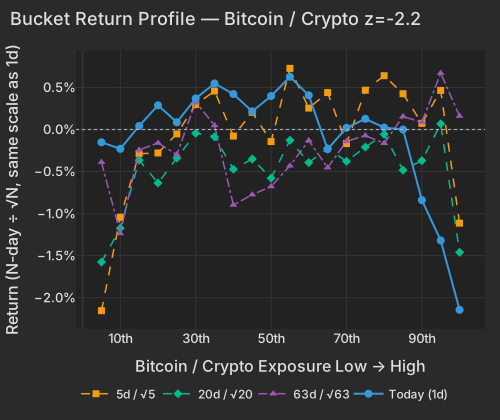
The Bitcoin / Crypto factor dropped 0.68% at z=-2.2, its lowest session-so-far reading since April 2026 (0.4th percentile since 2020), even as spot Bitcoin held at $82,222.94 at 10:44 AM EDT (-0.2%) CNBC and the BlackRock Bitcoin Strategy ETF (BITO) slipped just 0.1%. After Wednesday's hotter-than-expected 3.7% September CPI bls.gov and Thursday's 1.3% jump in producer prices, U.S. spot Bitcoin ETFs saw $262 million in net outflows and over $938 million in leveraged longs were liquidated as Bitcoin briefly broke below $80,000 to $79,770. While the token stabilized on Friday as the U.S. Dollar Index (DXY) eased 0.4% to 101.651 at 10:45 AM EDT CNBC, equity investors continued selling crypto miners: the CoinShares Bitcoin Mining ETF (WGMI) fell 3.8%, deepening its 20-day drop to 24.9%, while Hut 8 (HUT) lost 4.7% almost entirely on its factor exposures (-5.2% factor contribution versus +0.5% stock-specific).
| Factor | Return | Z-Score | 5d Z | 20d Z | 63d Z | Category | Direction |
|---|---|---|---|---|---|---|---|
| Bitcoin / Crypto | -0.68% | z=-2.2 | -0.6 | -0.7 | +0.7 | Thematic | High crypto exposure lagged |
| Residual Volatility | -0.96% | z=-1.9 | -1.3 | -0.2 | +0.9 | Style-Risk | Most volatile stocks lagged |
| China | -0.56% | z=-1.4 | -0.8 | -0.2 | +0.1 | Thematic | China-exposed names lagged |
| Short Interest | -0.23% | z=-1.4 | +0.0 | -0.6 | -1.5 | Style-Positioning | Most-shorted names underperformed |
| Value | +0.29% | z=+1.2 | +1.7 | +0.8 | +0.6 | Style | Cheapest names outperformed |
| Beta | -0.90% | z=-0.9 | -3.0 | -1.2 | -0.4 | Style-Risk | High-beta names underperformed |
| Dividend Yield | +0.15% | z=+0.9 | -0.6 | -1.7 | -0.6 | Style | Higher-yield names outperformed |
| Hedge-Fund Ownership | -0.09% | z=-0.8 | -0.2 | -0.1 | -0.6 | Style-Positioning | Heavily HF-owned names lagged |
| Bucket | Ret 1D Pct | Ret 5D Norm Pct | Ret 20D Norm Pct | Ret 63D Norm Pct |
|---|---|---|---|---|
| 1 | -0.15 | -2.15 | -1.58 | -0.39 |
| 2 | -0.23 | -1.04 | -1.17 | -1.24 |
| 3 | 0.04 | -0.29 | -0.36 | -0.24 |
| 4 | 0.29 | -0.28 | -0.64 | -0.16 |
| 5 | 0.09 | -0.05 | -0.34 | -0.30 |
| 6 | 0.37 | 0.30 | -0.04 | 0.33 |
| 7 | 0.55 | 0.46 | -0.09 | 0.05 |
| 8 | 0.42 | -0.08 | -0.47 | -0.90 |
| 9 | 0.22 | 0.20 | -0.35 | -0.77 |
| 10 | 0.40 | -0.14 | -0.58 | -0.68 |
| 11 | 0.63 | 0.73 | -0.13 | -0.43 |
| 12 | 0.41 | 0.25 | -0.39 | -0.13 |
| 13 | -0.23 | 0.44 | -0.23 | -0.45 |
| 14 | 0.02 | -0.17 | -0.38 | -0.14 |
| 15 | 0.13 | 0.47 | -0.21 | -0.07 |
| 16 | 0.02 | 0.64 | -0.06 | -0.16 |
| 17 | 0.00 | 0.43 | -0.48 | 0.15 |
| 18 | -0.84 | 0.07 | -0.37 | 0.09 |
| 19 | -1.32 | 0.46 | 0.07 | 0.67 |
| 20 | -2.14 | -1.11 | -1.46 | 0.16 |
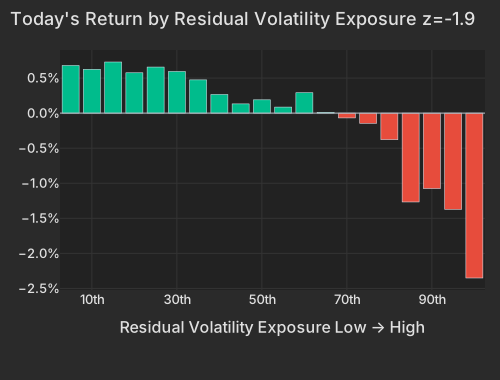
The selling in speculative equities ran well beyond crypto proxies. Residual Volatility fell 0.96% (z=-1.9) and accounted for 18.2% of total cross-sectional variance, exceeding its prior one-year maximum share. Together with Beta (-0.90%, z=-0.9, explaining 16.5% of variance), the risk factors pushed the total style share of variance to 43.4% (93.2nd percentile of the past year), while the broad market explained just 0.1%. The most volatile exposure bucket dropped 2.4%, hitting biotechnology and high-multiple software: the SPDR S&P Biotech ETF (XBI) fell 2.0% and the iShares Expanded Tech-Software Sector ETF (IGV) lost 2.5%.
| Bucket | Avg Ret Pct |
|---|---|
| 1 | 0.68 |
| 2 | 0.63 |
| 3 | 0.73 |
| 4 | 0.58 |
| 5 | 0.66 |
| 6 | 0.59 |
| 7 | 0.47 |
| 8 | 0.27 |
| 9 | 0.13 |
| 10 | 0.19 |
| 11 | 0.09 |
| 12 | 0.29 |
| 13 | 0.01 |
| 14 | -0.07 |
| 15 | -0.14 |
| 16 | -0.38 |
| 17 | -1.27 |
| 18 | -1.08 |
| 19 | -1.37 |
| 20 | -2.35 |
Factor decomposition shows how heavily common risk exposures weighed on individual biotech and tech movers. Iovance Biotherapeutics (IOVA) fell 5.3% on a -5.5% factor drag with a nearly flat +0.2% stock-specific return, while Moderna (MRNA) dropped 9.6% (erasing $9.5B in market value), split between a -4.6% style drag and a -5.2% stock-specific drop. In software, Snowflake (SNOW -4.7%) and Palo Alto Networks (PANW -4.2%) lost 2.4% and 2.3% on style tilts alone. In semiconductors, SK Hynix ADRs (SKHY) fell 4.3% (erasing $44.9B of market value) and Taiwan Semiconductor (TSM) slipped 1.4%, keeping the Semiconductors factor down 0.27% (z=-0.4) for a fifth consecutive negative session (-2.91% over five days). China fell 0.56% (z=-1.4) as FXI lost 0.8%.
How earnings reactions split, day 12 of the seasonStock-specific moves, vs the same day in the past eight seasons; 9 of this season's 41 reactions are still intraday

| Season | ≤ −5σ | −5 to −2σ | −2 to 0σ | 0 to 2σ | 2 to 5σ | ≥ 5σ |
|---|---|---|---|---|---|---|
| This season | 6% | 22% | 37% | 25% | 6% | 4% |
| Past 8 seasons | 12% | 21% | 13% | 19% | 22% | 13% |
| Q2 2026 | 10% | 26% | 14% | 13% | 23% | 13% |
| Q1 2026 | 26% | 9% | 11% | 34% | 16% | 2% |
| Q4 2025 | 7% | 34% | 18% | 12% | 14% | 15% |
| Q3 2025 | 5% | 26% | 15% | 15% | 14% | 24% |
| Q2 2025 | 12% | 23% | 18% | 22% | 13% | 12% |
| Q1 2025 | 11% | 11% | 8% | 13% | 48% | 9% |
| Q4 2024 | 7% | 24% | 10% | 16% | 29% | 13% |
| Q3 2024 | 16% | 7% | 7% | 25% | 30% | 15% |
σ: a stock's earnings-day stock-specific move divided by its typical daily stock-specific move over the past year. Each bar is cut at the same business day of the season; companies weighted by the square root of market cap.
Season to date: 31 of the 500 largest companies have reported (8% of market cap), on day 12 of the season.
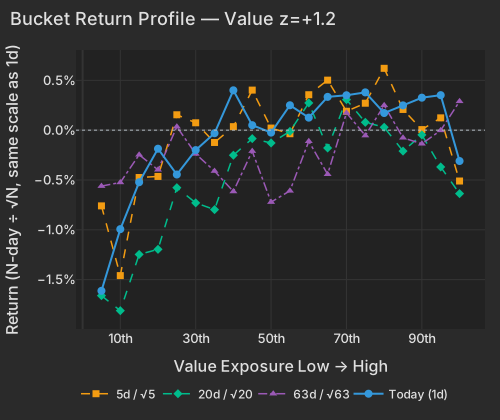
On the other side of the ledger, Value rose +0.29% (z=+1.2), bringing its five-day gain to 0.88% (z=+1.7) and its 60-day cumulative return to 0.75%. Unlike single-day factor snaps, Value's cross-horizon return profile shows positive monotonicity across 1-day (+0.65), 5-day (+0.46), 20-day (+0.63), and 63-day (+0.59) windows, driven today by investors selling the most expensive growth-priced bucket (-1.6%) while bidding up cheaper cyclicals and financials.
| Bucket | Ret 1D Pct | Ret 5D Norm Pct | Ret 20D Norm Pct | Ret 63D Norm Pct |
|---|---|---|---|---|
| 1 | -1.61 | -0.76 | -1.66 | -0.56 |
| 2 | -0.99 | -1.46 | -1.81 | -0.53 |
| 3 | -0.52 | -0.48 | -1.25 | -0.25 |
| 4 | -0.19 | -0.46 | -1.20 | -0.40 |
| 5 | -0.45 | 0.15 | -0.58 | 0.03 |
| 6 | -0.20 | 0.07 | -0.73 | -0.24 |
| 7 | -0.03 | -0.12 | -0.80 | -0.41 |
| 8 | 0.40 | 0.04 | -0.25 | -0.62 |
| 9 | 0.05 | 0.40 | -0.08 | -0.21 |
| 10 | -0.02 | 0.02 | -0.13 | -0.72 |
| 11 | 0.25 | -0.04 | -0.01 | -0.61 |
| 12 | 0.13 | 0.36 | 0.27 | -0.11 |
| 13 | 0.33 | 0.50 | -0.18 | -0.44 |
| 14 | 0.35 | 0.19 | 0.31 | 0.17 |
| 15 | 0.38 | 0.27 | 0.08 | -0.05 |
| 16 | 0.17 | 0.62 | 0.03 | 0.25 |
| 17 | 0.25 | 0.21 | -0.21 | -0.08 |
| 18 | 0.33 | 0.01 | -0.05 | -0.14 |
| 19 | 0.35 | 0.12 | -0.37 | -0.00 |
| 20 | -0.31 | -0.51 | -0.64 | 0.29 |
Materials (+1.5%) and Energy (+1.2%) led sector gains. Alcoa (AA) jumped 7.8% (+6.8% stock-specific) after reporting higher third-quarter net income and revenue on increased global production volumes and tight alumina supply, shrugging off stalled U.S.-Mexico trade talks over metal and auto tariffs WSJ. Financials also advanced (XLF +1.0%, KRE +1.3%), led by JPMorgan Chase (JPM +2.1%, adding $18.3B of market value) and regional lender Truist Financial (TFC +2.0%) following its morning earnings release. In India, HDFC Bank (HDB) rose 1.5% ahead of its post-close report, while analysts projected 15% to 21% year-on-year second-quarter profit growth for peer ICICI Bank alongside 20 bps of sequential margin compression Economic Times. Across the 41 third-quarter earnings reactions recorded so far this season (with 9 still intraday), only 10% of reporters have risen 2σ or more on a stock-specific basis compared with 35% at the same point across the past eight seasons.
| ETF | Theme | Today | 1d Ago | 5d Ago | 20d Ago | 63d Ago |
|---|---|---|---|---|---|---|
| ITA | Defense | +2.1% | +1.3% | +1.0% | -3.3% | -10.2% |
| GDX | Gold Miners | +2.1% | +4.3% | +0.4% | -9.3% | +22.0% |
| XLB | Materials | +1.5% | +1.8% | +2.6% | +0.2% | +0.5% |
| KRE | Regional Banking | +1.3% | +1.8% | +0.2% | -3.6% | -8.5% |
| XLE | Energy | +1.2% | -1.6% | +2.0% | +3.9% | +16.1% |
| XLP | Consumer Staples | +0.8% | +0.7% | +3.9% | +4.5% | +2.4% |
| SMH | Semiconductors | -0.9% | -1.0% | -8.0% | -0.3% | +0.4% |
| XBI | Biotech Growth | -2.0% | +2.1% | +0.3% | -5.4% | -2.9% |
| IGV | Software | -2.5% | +1.8% | +0.01% | +3.6% | +18.1% |
| WGMI | Crypto Miners | -3.8% | +2.7% | -13.7% | -24.9% | -27.0% |
Positioning and dispersion signals confirm that Friday's factor shift is occurring without an index-level shock or a short squeeze. Short Interest fell -0.23% (z=-1.4, -2.03% over 63 days at z=-1.5), meaning the most heavily shorted stocks continued to lag un-shorted peers, while stocks with heavier hedge-fund ownership lagged by 0.22% on a raw basis (z=-1.5) and 0.09% net of style tilts (z=-0.8). Meanwhile, 20-day realized pairwise correlation sits at 10.20% (10.0th percentile since 2020, 95.2nd percentile over the past three months) and implied 1-month correlation (Cboe COR1M) trades at 7.38 (1.0th percentile of its 20-year history), leaving implied dispersion (Cboe DSPX) elevated at 36.95 (95.8th percentile) as single-stock and style swings continue to dominate a flat index.
In fixed income and currencies, the Treasury curve twisted slightly steeper as front-end yields eased while long-end rates held firm: the 2-year yield fell 2.4 bps to 4.727% at 10:44 AM EDT, whereas the 10-year yield rose 0.7 bps to 5.094% and the 30-year added 0.5 bps to 5.433% CNBC. In Europe, Eurostat confirmed that eurozone annual inflation accelerated to 3.8% in September from 3.2% in August, with energy adding 1.71 percentage points and services 1.52 percentage points, lifting the Euro to 1.1255 Ec and sending the CurrencyShares Euro Trust (FXE) up 0.4% on 2.0× its typical session volume pace. Spot gold gained 0.5% to $4,190.14/oz at 10:44 AM EDT CNBC, lifting the VanEck Gold Miners ETF (GDX) 2.1%, while front-month WTI crude slipped 0.6% to $97.38/bbl at 10:35 AM EDT CNBC. Defense and Consumer Staples ETFs also drew bids, with iShares U.S. Aerospace & Defense (ITA) up 2.1% and Consumer Staples (XLP) rising 0.8% on 2.1× its typical volume pace to reach +8.6% month to date (its third-best month since its history starts in December 2018). Fifth Third Bancorp (FITB) is due to report third-quarter results before the open on October 19.
The New York Fed Staff Nowcast is due at 12:45 PM ET, with the fourth-quarter 2026 GDP growth tracker entering today's update at 2.8% following upward revisions from 2.5% on firm domestic demand bea.gov. Analysts expect the release to incorporate recent industrial production and import price figures, keeping the growth estimate above the FOMC's 2.0% long-run median projection while highlighting downside risks from cost-push inflation and trade policy uncertainty federalreserve.gov.
Variance decomposition: live intraday — 20261016 session, bracketed against its trailing-year range. Factor returns are trailing through last close. Total cross-sectional dispersion: 2.8%ile of the past year.
Variance mix — % of total, today vs 1d ago vs 1-yr avg
market 6.8%ile style 93.2%ile thematic 94.4%ile idiosyncratic 13%ile
Variance explained — today vs. factor's trailing-year range
Marker = the factor's share of today's total variance, placed in its own trailing-year range (box 25–75%ile, ticks 90%ile and max). Amber marker = unusually load-bearing today (≥90%ile of its own year). Factor name green = up today / red = down.
Correlation & dispersion — realized vs implied
Pairwise realized correlation (20d): 10.20% 10%ile since 2020 · 95.2%ile 3m
Top-500 pairwise: 11.89% 13%ile since 2020 · 82%ile 3m · implied (Cboe COR1M): 7.38 1.0%ile of its own history (gap +4.5pp)
Realized 20d vol (ann. pts): all stocks 37 vs VIXEQ 40 · index 10 vs VIX 16 · style factors 18 62%ile
20-day window (19 completed days + today); percentiles vs model history since 2020; '3m' tokens rank vs the trailing 63 trading days; definitions in Terms below. Implied prints (Cboe) are delayed ~15 min. as of 10:41 ET
Top 50 high-beta momentum names (eq-wt, since-2020 rank): -2.6% 15%ile · rest of market +0.4%
| Factor | Today | 1d | 5d | 20d | 60d |
|---|---|---|---|---|---|
| Style-Risk | |||||
| Residual Volatility | -0.96% z-1.9 | +0.26% | -1.42% | -0.43% | +3.98% |
| Beta | -0.90% z-0.9 | -0.48% | -6.39% | -5.34% | -4.86% |
| International | +0.18% z+0.6 | -0.04% | +0.41% | -0.21% | +0.61% |
| Style | |||||
| Value | +0.29% z+1.2 | -0.06% | +0.88% | +0.81% | +0.75% |
| Dividend Yield | +0.15% z+0.9 | -0.29% | -0.25% | -1.30% | -1.35% |
| Profitability | +0.16% z+0.8 | +0.20% | +1.02% | +1.84% | -0.11% |
| Leverage | +0.11% z+0.7 | -0.24% | -0.38% | -1.54% | -4.93% |
| Growth | -0.10% z-0.4 | +0.05% | -0.33% | +0.69% | +1.17% |
| Liquidity | -0.07% z-0.3 | +0.52% | +0.16% | -0.72% | +1.81% |
| Size | +0.05% z+0.1 | -0.85% | +0.08% | +1.77% | +3.58% |
| Style-Momentum | |||||
| Long-Term Momentum | -0.47% z-0.7 | -1.52% | -2.23% | -1.41% | -4.83% |
| Medium-Term Momentum | -0.15% z-0.5 | -0.59% | -0.69% | -0.95% | +1.53% |
| One-Day Momentum | -0.02% z-0.1 | +0.68% | +0.65% | +0.02% | -1.23% |
| Short-Term Momentum | +0.01% z+0.0 | +0.33% | +0.56% | +2.31% | -5.29% |
| Style-Positioning | |||||
| Short Interest | -0.23% z-1.4 | +0.14% | +0.00% | -0.43% | -1.25% |
| Hedge-Fund Ownership | -0.09% z-0.8 | +0.21% | -0.04% | -0.07% | -0.17% |
| Style-Flow | |||||
| Short-Sale Activity | +0.06% z+0.5 | +0.17% | +0.38% | -0.13% | +1.21% |
| Morning Activity | +0.01% z+0.1 | +0.05% | -0.12% | -0.92% | +1.53% |
| Thematic | |||||
| Bitcoin / Crypto | -0.68% z-2.2 | +0.40% | -0.42% | -0.99% | +1.96% |
| China | -0.56% z-1.4 | +0.35% | -0.72% | -0.38% | +0.68% |
| Gold | +0.21% z+0.7 | +0.44% | +0.39% | -1.11% | +2.78% |
| Semiconductors | -0.27% z-0.4 | -1.52% | -2.91% | -3.62% | -8.12% |
| Oil | +0.15% z+0.3 | -1.08% | -0.65% | -0.17% | +4.06% |
| Treasury (Duration) | -0.02% z-0.1 | +1.02% | +0.46% | -0.96% | -3.35% |
5/20/60d windows include today's session; 1d is the previous session.
Pairwise realized correlation. Index variance net of the weighted idiosyncratic diagonal, over the cross terms — the estimator used for implied-correlation indices. 20-day window unless noted; history since 2020.
Factor z-score. Today's factor return divided by its daily-return standard deviation over ~1,600 trading days.
Dispersion (realized). Total cross-sectional volatility net of the market component; high dispersion is the flip side of low correlation.
Stock-specific (idiosyncratic) return. The part of a stock's move not explained by the market, style or thematic (industry and theme) factors in the FactorPulse risk model.
VIXEQ / DSPX / COR1M. Cboe implied indices: single-stock volatility, dispersion, and 1-month implied correlation (top-50 S&P names). Quotes delayed ~15 minutes.
Data compiled by FactorPulse AI; edited and verified by Jeff Klein. For informational purposes only. Does not constitute financial advice, an investment recommendation, or an offer to buy or sell any securities. Always consult a qualified financial professional before making investment decisions.
For more on factor construction methodology, see www.factorpulse.com/glossary.