A week-long selloff in chipmakers and AI data-center builders spread Friday to the market's most volatile stocks. By midafternoon the software fund IGV was down about 5% as investors questioned who pays for the AI buildout behind software growth. The biotech fund XBI was down 3.5%. Data-analytics firm Palantir and cybersecurity company Palo Alto Networks each fell about 7%, and biotech Moderna dropped 10%. Microsoft slid 2.4%, erasing about $97 billion of market value. The semiconductor fund SMH fell nearly 3%, adding to an 8% loss over the five sessions through Thursday in what Bloomberg called the longest chip selloff since 2006.
The deepest losses came at companies that borrow to build AI data centers. AI cloud provider CoreWeave fell about 13%, and Reuters reported its shares and bonds were headed for steep weekly losses as hot inflation raised worries about borrowing costs. On Thursday one of its bonds traded near 78 cents on the dollar. Bitcoin miners that now rent out computing capacity for AI fell about 10%, while bitcoin itself dipped about 1% to roughly $81,000. The 50 hottest stocks most sensitive to market moves were down nearly 6%, against less than 1% for everything else, their third extreme drop this week after Monday and Wednesday. The broader market fell with them: the S&P 500 lost 1.2%, and the tech-heavy Nasdaq-100 lost 2.4%. Stocks are moving together more than at any point in three months. The VIX, Wall Street's fear gauge, jumped to nearly 22 from about 16.5, its highest since June 10.
Oil went the other way. U.S. crude rose about 3% to above $101 a barrel after NBC News reported renewed attacks on commercial shipping in the Strait of Hormuz, even as the International Energy Agency coordinated an emergency release of reserves. The energy fund XLE rose 2.3%, led by oil majors Shell and Chevron. The utilities fund XLU added 1.2%, and cheap stocks beat expensive ones for a fifth straight session. Investors did not buy Treasuries for safety: the 10-year yield edged up to 5.11%. Bank earnings split. Lender Truist rose 1.5% after its lending margin widened, while M&T fell 2% after saying its problem loans rose $90 million to $1.3 billion.
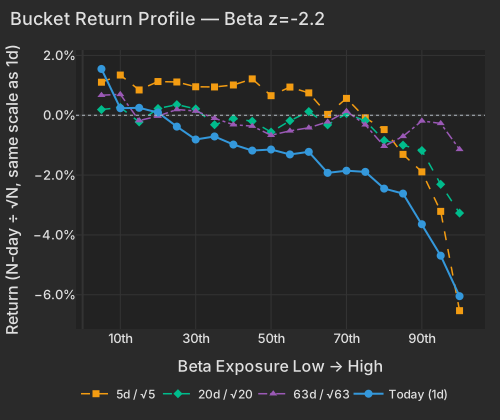
Style factors explained 50% of stock-level variance today, against a 23% one-year average, and most of that was a single trade. Beta lost 2.11% at z=-2.2 and Residual Volatility lost 1.17% at z=-2.4: the more market-sensitive or volatile the stock, the harder it fell. SPY is down 1.2% and QQQ 2.4%. Beta had already lost 7.60% over five sessions, so today extends the week's slide rather than starting a new one.
| Bucket | Ret 1D Pct | Ret 5D Norm Pct | Ret 20D Norm Pct | Ret 63D Norm Pct |
|---|---|---|---|---|
| 1 | 1.55 | 1.11 | 0.19 | 0.67 |
| 2 | 0.23 | 1.34 | 0.26 | 0.70 |
| 3 | 0.25 | 0.85 | -0.22 | -0.18 |
| 4 | 0.09 | 1.13 | 0.23 | -0.03 |
| 5 | -0.38 | 1.11 | 0.36 | 0.19 |
| 6 | -0.81 | 0.95 | 0.21 | 0.14 |
| 7 | -0.71 | 0.95 | -0.32 | -0.10 |
| 8 | -0.98 | 1.01 | -0.11 | -0.32 |
| 9 | -1.18 | 1.22 | -0.20 | -0.36 |
| 10 | -1.14 | 0.65 | -0.56 | -0.67 |
| 11 | -1.31 | 0.94 | -0.18 | -0.52 |
| 12 | -1.22 | 0.75 | 0.12 | -0.42 |
| 13 | -1.93 | 0.03 | -0.32 | -0.22 |
| 14 | -1.85 | 0.56 | 0.06 | 0.14 |
| 15 | -1.89 | -0.09 | -0.19 | -0.32 |
| 16 | -2.45 | -0.48 | -0.84 | -1.04 |
| 17 | -2.62 | -1.31 | -1.00 | -0.70 |
| 18 | -3.64 | -1.89 | -1.18 | -0.19 |
| 19 | -4.69 | -3.21 | -2.31 | -0.27 |
| 20 | -6.05 | -6.53 | -3.27 | -1.14 |
| Factor | Return | Z-Score | 5d Z | 20d Z | 63d Z | Category | Direction |
|---|---|---|---|---|---|---|---|
| Beta | -2.11% | -2.2 | -3.5 | -1.5 | -0.6 | Style-Risk | High-beta names lagged |
| Residual Volatility | -1.17% | -2.4 | -1.5 | -0.3 | +0.8 | Style-Risk | Volatile names lagged |
| Bitcoin / Crypto | -0.84% | -2.8 | -0.9 | -0.9 | +0.6 | Thematic | AI-hosting miners lagged |
| Value | +0.48% | +2.1 | +2.1 | +1.0 | +0.7 | Style | Cheap names outperformed |
| Short Interest | -0.29% | -1.7 | -0.2 | -0.7 | -1.6 | Style-Positioning | Most-shorted lagged |
| Hedge-Fund Ownership | -0.13% | -1.2 | -0.4 | -0.2 | -0.7 | Style-Positioning | HF-heavy names lagged |
| Oil | +0.46% | +1.0 | -0.3 | +0.1 | +1.2 | Thematic | Oil-exposed outperformed |
| Semiconductors | +0.11% | +0.2 | -1.9 | -1.2 | -1.0 | Thematic | Flat |
The Semiconductors factor is flat at +0.11% even though SMH is down 2.8%. In other words, chip stocks fell only as far as their beta implies. Before today, SMH had lost 8.0% in the five sessions to Thursday, in what Bloomberg called the longest chip selloff since 2006 Bloomberg.
The new losses were in software. IGV fell 4.9%, giving back part of an 18.1% three-month gain, as investors questioned who pays for the AI buildout behind software growth 24/7 Wall St.. At 1:43 PM ET, 43 of the 45 software stocks in a Yahoo Finance basket were lower Yahoo Finance. Palantir (PLTR) fell 7.0% and Palo Alto Networks (PANW) fell 7.2%; style exposures account for about 2.9% of each drop. Biotech followed the same pattern. Moderna (MRNA) dropped 10.0%: 6.0% came from its style exposures and 3.7% was specific to the stock. The megacaps fell less. Microsoft (MSFT) is down 2.4%, erasing $97.3B of market value, and only 0.8% of Meta's (META) 4.2% drop is specific to the company.
| ETF | Theme | Today | 1d Ago | 5d Ago | 20d Ago | 63d Ago |
|---|---|---|---|---|---|---|
| WGMI | crypto miners | -9.7% | +2.7% | -13.7% | -24.9% | -27.0% |
| IGV | software | -4.9% | +1.8% | +0.01% | +3.6% | +18.1% |
| XBI | biotech | -3.5% | +2.1% | +0.3% | -5.4% | -2.9% |
| SMH | semiconductors | -2.8% | -1.0% | -8.0% | -0.3% | +0.4% |
| QQQ | large cap growth | -2.4% | -0.1% | -2.6% | +1.7% | +4.8% |
| SPY | large cap | -1.2% | +0.3% | -0.3% | +1.5% | +4.1% |
| XLU | utilities | +1.2% | -0.2% | +1.4% | +0.6% | -7.1% |
| XLE | energy | +2.3% | -1.6% | +2.0% | +3.9% | +16.1% |
| USO | oil | +3.1% | +2.4% | +6.6% | +1.3% | +26.9% |
| VXX | volatility | +9.7% | -0.7% | -0.9% | -3.7% | -24.0% |
How earnings reactions split, day 12 of the seasonThe 1,000 largest US companies that have reported so far (33), vs the same day in the past eight seasons; 8 still trading intraday

| Season | ≤ −5σ | −5 to −2σ | −2 to 0σ | 0 to 2σ | 2 to 5σ | ≥ 5σ |
|---|---|---|---|---|---|---|
| This season | 7% | 29% | 23% | 32% | 6% | 3% |
| Past 8 seasons | 12% | 21% | 13% | 19% | 22% | 13% |
| Q2 2026 | 10% | 26% | 14% | 13% | 23% | 13% |
| Q1 2026 | 26% | 9% | 11% | 34% | 16% | 2% |
| Q4 2025 | 7% | 34% | 18% | 12% | 14% | 15% |
| Q3 2025 | 5% | 26% | 15% | 15% | 14% | 24% |
| Q2 2025 | 12% | 23% | 18% | 22% | 13% | 12% |
| Q1 2025 | 11% | 11% | 8% | 13% | 48% | 9% |
| Q4 2024 | 7% | 24% | 10% | 16% | 29% | 13% |
| Q3 2024 | 16% | 7% | 7% | 25% | 30% | 15% |
σ: a stock's earnings-day stock-specific move divided by its typical daily stock-specific move over the past year. Each bar is cut at the same business day of the season; companies weighted by the square root of market cap.
Of the 500 largest companies, 31 have reported (8% of market cap), on day 12 of the season.
The steepest losses were in companies that borrow to build AI data centers. CoreWeave (CRWV) fell 12.7% and Nebius (NBIS) fell 12.2%. Nebius was the largest U.S.-listed holding of Lone Pine Capital, whose long-short fund fell about 31% in the third quarter as AI stocks slid, according to an Institutional Investor report cited by Hedgeweek on October 9 Hedgeweek. Reuters reported that CoreWeave's shares and bonds were headed for steep weekly losses, as hot inflation raised worries about borrowing costs. On Thursday, its 9.625% bond due 2032 yielded more than 15.4% and traded near 78 cents on the dollar, as Benzinga reported. Its 2031 bond is set for a fifth straight weekly decline, as Quartz reported.
The bitcoin miners that now rent out data-center capacity for AI computing fell much further than crypto. Their median loss is 10.2%, against 5.1% for crypto exchanges and brokers such as Coinbase (COIN) and Robinhood (HOOD). Bitcoin was at $81,302 at 2:35 PM ET, down 1.3% CNBC. The Bitcoin / Crypto factor's -0.84% at z=-2.8 therefore reflects selling of AI infrastructure in companies that still trade like bitcoin miners. Most of the roughly 10% drops in Hut 8 (HUT) and Cipher (CIFR) came from their beta and volatility exposures. WGMI is down 30.1% month to date, its third-worst month since 2022.
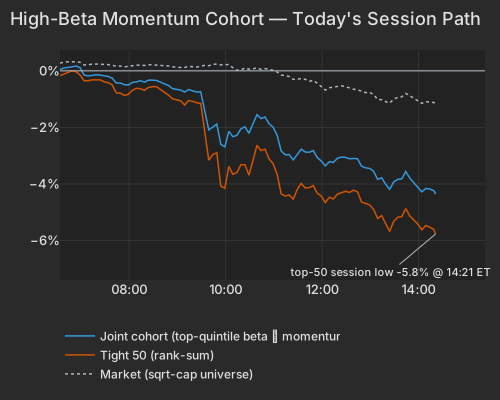
The top 50 high-beta momentum names are down 5.7%, the 56th-worst session of 1,706 since 2020, while stocks outside the group are off 0.6%. The broader high-beta momentum group is down 4.3%. Monday and Wednesday also ranked in the worst 5% of days since 2020, and at Thursday's close the broader group was 24.0% below its peak. Stocks with high Beta and Residual Volatility exposure overlap heavily with this group, so the two factor losses and the group's drop are the same trade. Stocks with heavy hedge-fund ownership lagged by 0.33% on a raw basis (z=-2.3). After netting out other styles, the gap is only 0.13% (z=-1.2), so those names fell mainly because of their beta and volatility. The funds themselves took losses too: stock-picking hedge funds lost 2.9% in the week to October 15, losing money every day, according to Goldman Sachs prime-brokerage data reported by Reuters Reuters. On October 15, stock pickers, systematic funds and multi-strategy funds all fell more than 0.8% on the same day, which Goldman said never happened from COVID through 2025 and has now happened three times this year.
| Series | Ret Pct |
|---|---|
| joint | -4.29 |
| tight50 | -5.66 |
| market | -1.13 |
| rest | -0.55 |
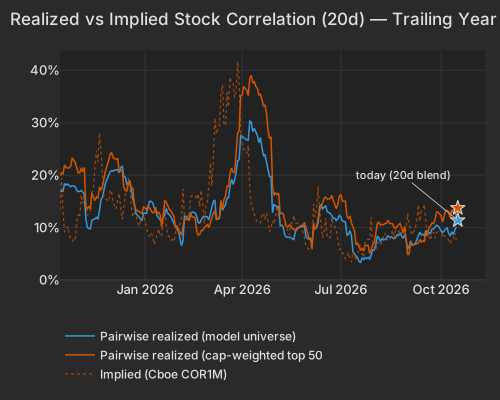
Realized 20-day correlation among stocks rose to 11.4%, above every close of the past three months. The level is still only in the 13.5th percentile since 2020: correlation has just turned up, from a low base. The 5-day measure, at 17.45%, is also above every close of the past three months. The index explained 17.9% of stock-level variance today, nearly double its 9.1% one-year average. After weeks in which single stocks moved on their own stories, the market as a whole is now moving them together.
Options prices moved the same way. The VIX rose to 21.86 from 16.46, its highest level since June 10. Implied single-stock correlation (Cboe COR1M) jumped to 12.56 from 7.65. That is still only the 7.9th percentile since 2006. It is also below the 21.1% realized 20-day correlation among the top 50 S&P 500 names, so options still price in less co-movement than the past month produced. Implied dispersion (Cboe DSPX) eased to 35.45 from 37.04. Treasuries saw no buying as the VIX jumped: the ten-year yield is up 2.3 bp at 5.11% CNBC, and TLT is down 0.1%.
| Series | Today Pct | Prev Close Pct |
|---|---|---|
| pairwise_model | 11.39 | 10.12 |
| pairwise_top500 | 13.73 | 11.56 |
| implied_cor1m |
Value gained 0.48% at z=+2.1, and its 5-day z is also +2.1. Cheap stocks have beaten expensive ones all week, against the model's multi-year pattern of cheap names lagging. Dividend Yield added 0.24% (z=+1.4). WTI crude is at $101.34 at 2:25 PM ET, up 3.4% on the day CNBC. NBC News reported renewed attacks on commercial shipping in the Strait of Hormuz NBC News. Those conflicts kept sellers away despite the IEA's coordinated emergency reserve release The Wall Street Journal. The Energy sector is up 1.6%, led by Shell (SHEL) and Chevron (CVX).
Bank earnings split. Truist (TFC) rose 1.5% after its net interest margin widened 2 bp to 3.00%. M&T (MTB) fell 2.0%. On its call, the bank said nonaccrual loans rose $90 million to $1.3 billion and that charge-offs were concentrated in leveraged and franchise lending, according to a call transcript published by the Motley Fool. Weighted by size, only 9% of this season's reporters have risen 2σ or more on their own news so far, against 35% at this point in the past eight seasons. Fifth Third (FITB) reports before the open on Monday.
The New York Fed Staff Nowcast, released at 12:45 PM ET, raised its Q3 GDP estimate to 2.7% from 2.6% and left Q4 unchanged at 2.8% bea.gov. It cited stronger September retail sales and producer-price data census.gov.
Variance decomposition: live intraday — 20261016 session, bracketed against its trailing-year range. Factor returns are trailing through last close. Total cross-sectional dispersion: 66%ile of the past year.
Variance mix — % of total, today vs 1d ago vs 1-yr avg
market 86%ile style 96.8%ile thematic 63%ile idiosyncratic 1.6%ile
Variance explained — today vs. factor's trailing-year range
Marker = the factor's share of today's total variance, placed in its own trailing-year range (box 25–75%ile, ticks 90%ile and max). Amber marker = unusually load-bearing today (≥90%ile of its own year). Factor name green = up today / red = down.
Correlation & dispersion — realized vs implied
Pairwise realized correlation (20d): 11.39% 14%ile since 2020 · 100.0%ile 3m
Top-500 pairwise: 13.73% 20%ile since 2020 · 98.4%ile 3m · implied (Cboe COR1M): 12.56 7.9%ile since 2006 (gap +1.2pp)
Realized 20d vol (ann. pts): all stocks 38 vs VIXEQ 42 · index 11 vs VIX 22 · style factors 19 67%ile
20-day window (19 completed days + today); percentiles vs model history since 2020; '3m' tokens rank vs the trailing 63 trading days; definitions in Terms below. Implied prints (Cboe) are delayed ~15 min. as of 14:21 ET
Top 50 high-beta momentum names (eq-wt, since-2020 rank): -5.7% 3.2%ile · rest of market -0.6%
| Factor | Today | 1d | 5d | 20d | 60d |
|---|---|---|---|---|---|
| Style-Risk | |||||
| Residual Volatility | -1.17% z-2.4 | +0.26% | -1.63% | -0.64% | +3.77% |
| Beta | -2.11% z-2.2 | -0.48% | -7.60% | -6.55% | -6.07% |
| International | +0.40% z+1.3 | -0.04% | +0.63% | +0.01% | +0.83% |
| Style | |||||
| Value | +0.48% z+2.1 | -0.06% | +1.07% | +1.01% | +0.94% |
| Dividend Yield | +0.24% z+1.4 | -0.29% | -0.16% | -1.21% | -1.26% |
| Profitability | +0.24% z+1.3 | +0.20% | +1.11% | +1.93% | -0.03% |
| Leverage | +0.19% z+1.1 | -0.24% | -0.30% | -1.47% | -4.86% |
| Size | +0.28% z+0.8 | -0.85% | +0.31% | +2.00% | +3.81% |
| Liquidity | -0.13% z-0.5 | +0.52% | +0.09% | -0.78% | +1.74% |
| Growth | -0.11% z-0.4 | +0.05% | -0.34% | +0.68% | +1.16% |
| Style-Momentum | |||||
| One-Day Momentum | -0.21% z-0.8 | +0.68% | +0.46% | -0.17% | -1.42% |
| Long-Term Momentum | -0.17% z-0.3 | -1.52% | -1.93% | -1.11% | -4.53% |
| Short-Term Momentum | -0.01% z-0.1 | +0.33% | +0.54% | +2.28% | -5.32% |
| Medium-Term Momentum | -0.00% z-0.0 | -0.59% | -0.54% | -0.80% | +1.68% |
| Style-Positioning | |||||
| Short Interest | -0.29% z-1.7 | +0.14% | -0.05% | -0.49% | -1.30% |
| Hedge-Fund Ownership | -0.13% z-1.2 | +0.21% | -0.09% | -0.11% | -0.21% |
| Style-Flow | |||||
| Morning Activity | -0.06% z-0.5 | +0.05% | -0.18% | -0.98% | +1.47% |
| Short-Sale Activity | +0.01% z+0.1 | +0.17% | +0.33% | -0.18% | +1.16% |
| Thematic | |||||
| Bitcoin / Crypto | -0.84% z-2.8 | +0.40% | -0.59% | -1.16% | +1.79% |
| China | -0.58% z-1.4 | +0.35% | -0.75% | -0.40% | +0.65% |
| Oil | +0.46% z+1.0 | -1.08% | -0.33% | +0.14% | +4.38% |
| Treasury (Duration) | -0.20% z-0.6 | +1.02% | +0.28% | -1.14% | -3.53% |
| Semiconductors | +0.11% z+0.2 | -1.52% | -2.54% | -3.25% | -7.74% |
| Gold | -0.05% z-0.1 | +0.44% | +0.13% | -1.37% | +2.52% |
5/20/60d windows include today's session; 1d is the previous session.
Pairwise realized correlation. Index variance net of the weighted idiosyncratic diagonal, over the cross terms — the estimator used for implied-correlation indices. 20-day window unless noted; history since 2020.
Market variance share. The fraction of cross-sectional variance explained by the market factor — the attribution companion to pairwise correlation, not a substitute for it.
Factor z-score. Today's factor return divided by its daily-return standard deviation over ~1,600 trading days.
Conditional importance. A factor's relative share of what a tree-based fit of today's stock returns explains; sums to 100% across factors.
High-beta momentum cohort. US names above $2B market cap in the top quintile of both raw beta and 12-month momentum; membership frozen at each month's first business day. “Top 50” = the 50 strongest by combined rank.
Dispersion (realized). Total cross-sectional volatility net of the market component; high dispersion is the flip side of low correlation.
Stock-specific (idiosyncratic) return. The part of a stock's move not explained by the market, style or thematic (industry and theme) factors in the FactorPulse risk model.
VIXEQ / DSPX / COR1M. Cboe implied indices: single-stock volatility, dispersion, and 1-month implied correlation (top-50 S&P names). Quotes delayed ~15 minutes.
Data compiled by FactorPulse AI; edited and verified by Jeff Klein. For informational purposes only. Does not constitute financial advice, an investment recommendation, or an offer to buy or sell any securities. Always consult a qualified financial professional before making investment decisions.
For more on factor construction methodology, see www.factorpulse.com/glossary.