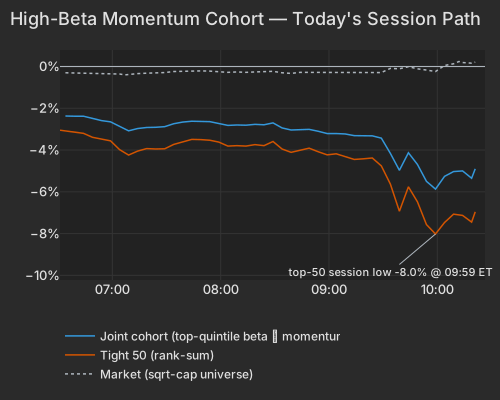
Investors kept selling the stocks that had ridden the AI boom on Thursday morning, and the selling swamped a record quarter from chipmaker Taiwan Semiconductor Manufacturing. Its profit jumped nearly 70% to a record of about $24 billion, and it raised its 2026 revenue growth forecast to roughly 44%. Its shares fell nearly 4%, erasing about $80 billion in market value. The 50 high-beta stocks that had been the market's biggest winners fell about 7%, their fourth steep drop in six sessions. The rest of the market rose more than 1.5%, leaving the S&P 500 fund SPY down 0.2%.
The damage spread across AI hardware. Chipmaker Nvidia fell 2.4%, losing about $125 billion in value, and the semiconductor fund SMH dropped more than 3%, bringing its five-day loss to nearly 10%. Server maker Dell sank about 9% after a Barclays downgrade over rising memory costs. The memory-chip fund DRAM lost 5%, and the South Korea fund EWY fell 4.5%, on oversupply warnings as a Chinese rival began mass production of advanced memory chips. Worries about the debt behind the data-center buildout added pressure: bonds of AI cloud provider CoreWeave traded at roughly 75 to 81 cents on the dollar, and lender Blue Owl declined to finance a $10 billion data-center project for Oracle and OpenAI. Investors moved money into steadier names. Software maker Intuit rose about 6%, and the health-care fund XLV gained more than 2%. Traders described the shift as a rotation, with no sign of hedge funds being forced to sell.
Bonds were the main beneficiary. A hotter-than-expected producer-price report showed wholesale prices up 6.3% from a year earlier, against forecasts of 5.5%. Even so, the flight to safety pushed the 10-year Treasury yield down 13 basis points to about 5.06%, and gold rose 1.3% to nearly $4,160 an ounce. Lower rates lifted the homebuilder fund ITB 4.5%. The consumer-staples fund XLP gained more than 2%, bringing its October gain to about 9%, on pace for its second-best month since 2018.
TSMC reported a 68.7% surge in third-quarter net income to a record NT$763.06 billion ($23.6 billion) and lifted its 2026 revenue growth outlook to roughly 44% as 2-nanometer wafer revenue scaled to 8% of total sales Bloomberg. Rather than halting the five-day, 6.93% slide in Beta, the print was swallowed by it: TSM fell 3.7%, erasing $79.9B of market value, with its style and thematic exposures accounting for -3.1% and -0.5% of the move and the stock's own residual sitting nearly flat at -0.3%. Nvidia (NVDA) showed the same pattern, falling 2.4% (erasing $124.5B) on a -2.2% style drag while its stock-specific return was +0.2%.
The selling extended an established de-risking run in the high-beta momentum cohort that already produced since-2020 extremes on October 8, October 12, and October 14. The top 50 high-beta momentum names are down 7.3% today (1.4th percentile since 2020), touching an intraday low of -8.0% at 09:59 ET, while the broader ~190-name high-beta momentum group — which entered the session in a 22.9% drawdown — fell 5.3% (2.1st percentile since 2020). Stocks outside both screens gained 1.6%, leaving the S&P 500 ETF (SPY) down just 0.2%.
| Series | Ret Pct |
|---|---|
| joint | -5.26 |
| tight50 | -7.28 |
| market | 0.18 |
| rest | 1.58 |
Style factors explained 59.6% of cross-sectional variance today against a 22.7% one-year average (100.0th percentile of the past year), led by Beta alone at 39.4% of total variance. In Wednesday's session, the top 50 high-beta momentum names moved together as one basket (98.3rd percentile of the past 60 days) on light volume at 0.63× the market's pace, and the retail-tilted group (+1.38σ on habitual morning activity) showed no easiest-to-sell-first liquidation pattern across liquidity tiers. Neither Hedge-Fund Ownership (+0.16%, z=+1.5; +0.02% on a raw basis) nor Short Interest (+0.27%, z=+1.6) points to hedge-fund forced selling today; instead, the most heavily shorted stocks outperformed and yesterday's most heavily short-sold names beat the barely-shorted decile by 0.13% (Short-Sale Activity z=+1.2, +0.64% on a raw basis at z=+3.4).
| Factor | Return | Z-Score | 5d Z | 20d Z | 63d Z | Category | Direction |
|---|---|---|---|---|---|---|---|
| One-Day Momentum | +0.94% | z=+3.4 | z=+1.5 | z=+0.1 | z=-0.5 | Style-Momentum | Yesterday's gainers beat losers |
| Semiconductors | -1.54% | z=-2.5 | z=-2.2 | z=-1.0 | z=-1.0 | Thematic | High-exposure chip names lagged |
| Beta | -2.30% | z=-2.4 | z=-3.2 | z=-1.2 | z=-0.5 | Style-Risk | Market-sensitive stocks sold off |
| Oil | -1.07% | z=-2.3 | z=-0.8 | z=-0.2 | z=+1.3 | Thematic | Oil-exposed equities underperformed |
| Treasury (Duration) | +0.67% | z=+2.1 | z=+0.2 | z=-1.1 | z=-1.2 | Thematic | Rate-sensitive duration outperformed |
| Profitability | +0.37% | z=+2.0 | z=+0.8 | z=+2.2 | z=+0.1 | Style | High-profitability names gained |
| Long-Term Momentum | -1.24% | z=-2.0 | z=-1.3 | z=-0.4 | z=-3.3 | Style-Momentum | 12-month winners lagged |
| Short Interest | +0.27% | z=+1.6 | z=+1.0 | z=-0.6 | z=-1.5 | Style-Positioning | Most-shorted names outperformed |
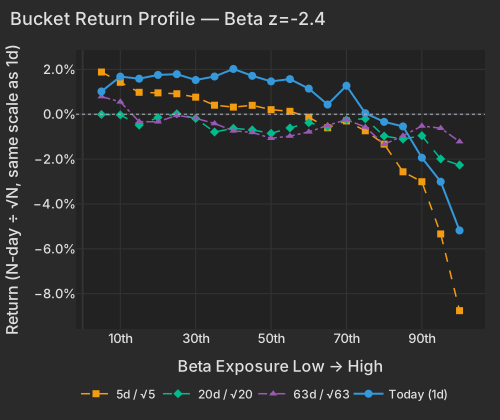
| Bucket | Ret 1D Pct | Ret 5D Norm Pct | Ret 20D Norm Pct | Ret 63D Norm Pct |
|---|---|---|---|---|
| 1 | 1.02 | 1.88 | -0.01 | 0.79 |
| 2 | 1.68 | 1.42 | -0.03 | 0.55 |
| 3 | 1.58 | 0.98 | -0.49 | -0.33 |
| 4 | 1.75 | 0.95 | -0.14 | -0.34 |
| 5 | 1.79 | 0.91 | 0.02 | -0.05 |
| 6 | 1.53 | 0.76 | -0.19 | -0.18 |
| 7 | 1.68 | 0.40 | -0.79 | -0.41 |
| 8 | 2.02 | 0.32 | -0.63 | -0.74 |
| 9 | 1.71 | 0.40 | -0.70 | -0.81 |
| 10 | 1.46 | 0.20 | -0.85 | -1.07 |
| 11 | 1.57 | 0.13 | -0.61 | -0.97 |
| 12 | 1.14 | -0.13 | -0.38 | -0.79 |
| 13 | 0.43 | -0.60 | -0.56 | -0.50 |
| 14 | 1.27 | -0.30 | -0.25 | -0.24 |
| 15 | 0.05 | -0.74 | -0.20 | -0.57 |
| 16 | -0.34 | -1.33 | -0.97 | -1.34 |
| 17 | -0.54 | -2.57 | -1.11 | -0.96 |
| 18 | -1.94 | -3.01 | -0.96 | -0.52 |
| 19 | -3.01 | -5.34 | -1.99 | -0.62 |
| 20 | -5.18 | -8.76 | -2.26 | -1.22 |
The AI trade reversed mostly overnight and at the open, pulling Beta (-2.30%, z=-2.4), 12-month momentum — Long-Term Momentum in the table — (-1.24%, z=-2.0), and yesterday's winners and losers (+0.94%, z=+3.4) in a single coordinated move. Because the high-beta momentum names fell hard on Wednesday, their exposure to yesterday's return is negatively correlated with Beta (-0.74 across the universe), making today's positive One-Day Momentum print a direct continuation of Wednesday's selloff rather than an independent signal. Within technology, hardware and optical names including Dell Technologies (DELL -8.7%), Lumentum (LITE -7.5%), Sandisk (SNDK -7.0%), Bloom Energy (BE -6.9%), and Western Digital (WDC -5.7%) fell alongside pure factor-driven declines in Vicor (VICR -12.4%), FormFactor (FORM -10.0%), and MaxLinear (MXL -8.4%), while software and defensive compounders Intuit (INTU +6.3%), Accenture (ACN +4.7%), and T-Mobile US (TMUS +3.0%) advanced.
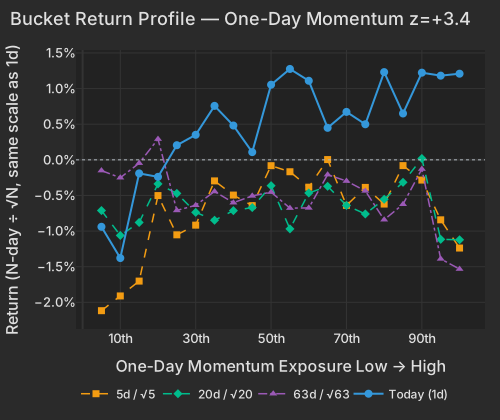
| Bucket | Ret 1D Pct | Ret 5D Norm Pct | Ret 20D Norm Pct | Ret 63D Norm Pct |
|---|---|---|---|---|
| 1 | -0.94 | -2.12 | -0.71 | -0.15 |
| 2 | -1.38 | -1.91 | -1.06 | -0.25 |
| 3 | -0.19 | -1.70 | -0.88 | -0.05 |
| 4 | -0.24 | -0.50 | -0.34 | 0.29 |
| 5 | 0.21 | -1.05 | -0.47 | -0.71 |
| 6 | 0.35 | -0.92 | -0.74 | -0.64 |
| 7 | 0.76 | -0.30 | -0.85 | -0.44 |
| 8 | 0.48 | -0.49 | -0.71 | -0.60 |
| 9 | 0.11 | -0.64 | -0.67 | -0.51 |
| 10 | 1.05 | -0.08 | -0.36 | -0.45 |
| 11 | 1.28 | -0.17 | -0.97 | -0.68 |
| 12 | 1.11 | -0.38 | -0.47 | -0.68 |
| 13 | 0.45 | 0.00 | -0.37 | -0.21 |
| 14 | 0.67 | -0.64 | -0.64 | -0.30 |
| 15 | 0.50 | -0.39 | -0.76 | -0.44 |
| 16 | 1.23 | -0.62 | -0.55 | -0.84 |
| 17 | 0.65 | -0.08 | -0.32 | -0.62 |
| 18 | 1.22 | -0.28 | 0.02 | -0.13 |
| 19 | 1.18 | -0.84 | -1.12 | -1.39 |
| 20 | 1.21 | -1.24 | -1.12 | -1.53 |
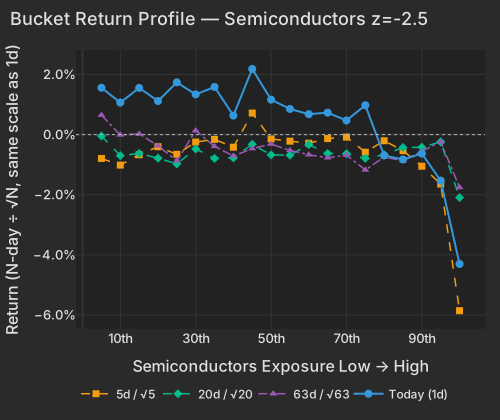
| Bucket | Ret 1D Pct | Ret 5D Norm Pct | Ret 20D Norm Pct | Ret 63D Norm Pct |
|---|---|---|---|---|
| 1 | 1.56 | -0.79 | -0.05 | 0.65 |
| 2 | 1.07 | -1.01 | -0.70 | -0.01 |
| 3 | 1.55 | -0.67 | -0.63 | 0.02 |
| 4 | 1.12 | -0.40 | -0.78 | -0.37 |
| 5 | 1.74 | -0.65 | -0.98 | -0.87 |
| 6 | 1.34 | -0.25 | -0.48 | 0.13 |
| 7 | 1.58 | -0.16 | -0.79 | -0.39 |
| 8 | 0.63 | -0.42 | -0.77 | -0.71 |
| 9 | 2.18 | 0.72 | -0.32 | -0.47 |
| 10 | 1.16 | -0.14 | -0.67 | -0.32 |
| 11 | 0.85 | -0.22 | -0.68 | -0.53 |
| 12 | 0.68 | -0.29 | -0.33 | -0.67 |
| 13 | 0.73 | -0.13 | -0.63 | -0.77 |
| 14 | 0.47 | -0.08 | -0.64 | -0.68 |
| 15 | 0.98 | -0.59 | -0.79 | -1.18 |
| 16 | -0.69 | -0.20 | -0.67 | -0.75 |
| 17 | -0.83 | -0.53 | -0.43 | -0.87 |
| 18 | -0.63 | -1.05 | -0.42 | -0.56 |
| 19 | -1.53 | -1.65 | -0.24 | -0.24 |
| 20 | -4.30 | -5.86 | -2.09 | -1.76 |
Despite a 1.3% monthly jump in the September Producer Price Index (6.3% year-over-year) bls.gov CNBC, the equity tech rout triggered a flight to sovereign debt CNBC that pulled the 10-year Treasury yield down 13.2 bps to 5.058% CNBC, the 30-year down 12.2 bps to 5.402% CNBC, and the 2-year down 8.9 bps to 4.713% at 10:27 AM ET CNBC. The US Dollar Index (DXY) softened 0.5% to 102.05 CNBC and spot gold rose 1.3% to $4,157.89/oz at 10:27 AM ET CNBC. Lower yields drove a 0.67% rebound in the Treasury (Duration) factor (z=+2.1) and lifted rate-sensitive homebuilders CNBC and real estate ETFs off their three-month lows, while Consumer Staples (XLP +2.4%) extended its month-to-date gain to 9.3%, ranking as its second-best month since its history starts in 2018. Meanwhile, the Oil factor fell 1.07% (z=-2.3) even as front-month WTI crude gained 1.7% to $96.74/bbl at 10:17 AM ET CNBC.
| ETF | Theme | Today | 1d Ago | 5d Ago | 20d Ago | 63d Ago |
|---|---|---|---|---|---|---|
| ITB | Homebuilders | +4.5% | -1.5% | -1.6% | -5.4% | -16.1% |
| XHB | Homebuilders | +3.1% | -1.9% | -2.2% | -3.6% | -15.8% |
| XLV | Healthcare | +2.4% | +2.5% | +3.1% | +4.1% | +7.9% |
| XLP | Consumer Staples | +2.4% | +2.2% | +5.3% | +4.0% | +1.0% |
| TLT | Long-Term Bonds | +2.0% | +0.7% | +2.3% | -2.1% | -5.2% |
| SMH | Semiconductors | -3.4% | -4.0% | -9.7% | +3.5% | -0.7% |
| AIPO | AI Power Infrastructure | -3.7% | -5.3% | -8.9% | -3.0% | -8.5% |
| EWY | South Korea | -4.5% | -4.0% | -13.0% | -9.0% | -2.2% |
| DRAM | Memory Chips & Storage | -5.3% | -5.1% | -16.5% | -9.4% | -4.2% |
| WGMI | Crypto Miners | -6.8% | -10.7% | -21.3% | -24.1% | -29.7% |
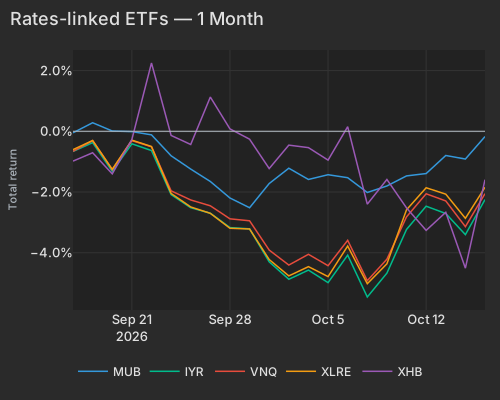
| T | Mub | Iyr | Vnq | Xlre | Xhb |
|---|---|---|---|---|---|
| 2026-09-16 | -0.05 | -0.66 | -0.66 | -0.60 | -0.98 |
| 2026-09-17 | 0.28 | -0.37 | -0.31 | -0.30 | -0.71 |
| 2026-09-18 | 0.01 | -1.32 | -1.26 | -1.25 | -1.40 |
| 2026-09-21 | -0.01 | -0.41 | -0.31 | -0.29 | -0.27 |
| 2026-09-22 | -0.12 | -0.63 | -0.51 | -0.50 | 2.25 |
| 2026-09-23 | -0.81 | -2.08 | -1.96 | -2.05 | -0.14 |
| 2026-09-24 | -1.24 | -2.52 | -2.26 | -2.49 | -0.43 |
| 2026-09-25 | -1.65 | -2.70 | -2.45 | -2.70 | 1.13 |
| 2026-09-28 | -2.20 | -3.17 | -2.88 | -3.19 | 0.08 |
| 2026-09-29 | -2.52 | -3.21 | -2.95 | -3.22 | -0.26 |
| 2026-09-30 | -1.72 | -4.30 | -3.91 | -4.22 | -1.23 |
| 2026-10-01 | -1.22 | -4.87 | -4.41 | -4.76 | -0.46 |
| 2026-10-02 | -1.59 | -4.57 | -4.05 | -4.46 | -0.54 |
| 2026-10-05 | -1.43 | -4.98 | -4.43 | -4.79 | -0.95 |
| 2026-10-06 | -1.53 | -4.08 | -3.59 | -3.78 | 0.15 |
| 2026-10-07 | -2.02 | -5.46 | -4.92 | -5.02 | -2.40 |
| 2026-10-08 | -1.80 | -4.67 | -4.21 | -4.36 | -1.59 |
| 2026-10-09 | -1.47 | -3.23 | -2.82 | -2.59 | -2.52 |
| 2026-10-12 | -1.39 | -2.47 | -2.06 | -1.86 | -3.26 |
| 2026-10-13 | -0.80 | -2.71 | -2.29 | -2.07 | -2.67 |
| 2026-10-14 | -0.91 | -3.40 | -3.14 | -2.87 | -4.51 |
| 2026-10-15 | -0.17 | -2.25 | -2.05 | -1.84 | -1.59 |
Outside the factor complex, FMC Corporation (FMC) tumbled 33.5% (-35.2% stock-specific) after slashing third-quarter revenue guidance to $65M–$125M from $840M–$900M and booking $625M–$675M in commercial restructuring charges across Latin America and North America FT. In earnings, ManpowerGroup (MAN) fell 14.9% (-17.7% stock-specific) after third-quarter gross margin compressed 74 bps to 15.9% FT, while Marsh (MRSH) gained 6.1% on 14% consulting revenue growth and Ericsson (ERIC) rose 9.0%.
Earnings reactions so far todayReporters worth over $100 billion, or moving more than 10% with a value above $5 billion
| Company | Move | Stock-specific | Market cap | Revenue YoY | Margin YoY | What drove it |
|---|---|---|---|---|---|---|
| Charles Schwab SCHW | -4.7% | -6.6% | $167B | — | — | Q3 revenue and net interest income missed estimates FT |
| Taiwan Semiconductor Manufacturing TSM | -3.7% | -0.3% | $2.2T | — | — | Beta factor selloff outweighed record Q3 profit beat Bloomberg |
| Prologis PLD | -1.3% | -1.4% | $124B | +8% | +1.3 pts operating | — |
Stock-specific: the part of the move left after the FactorPulse risk model removes the market, style-factor and industry effects.
Revenue and margin from the company's earnings release, year over year; margin change in percentage points; — where the release is not parsed or the figures failed checks.
Season to date: 24 of the top 500 have reported (7% of market cap), day 11 of the season; 16 of 35 reactions were positive on a stock-specific basis; at this point in the last 8 seasons that share ran from 41% to 62%.
Interactive Brokers (IBKR) reports after today's close, followed by Travelers (TRV), Truist Financial (TFC), M&T Bank (MTB), and Citizens Financial (CFG) before Friday's open.
The selloff is only partially a credit contagion story, confined to speculative-grade neocloud debt and project-financed data centers while investment-grade hyperscalers remain insulated. According to Business Insider and the Financial Times, CoreWeave's unsecured 2031 and 2032 notes fell to 75–81 cents on the dollar to yield 15%–16% as five-year credit default swaps topped 1,100 bps against $52 billion in debt and lease obligations. The Financial Times also reported that bonds backing Oracle's Michigan AI campus fell to 88 cents on the dollar, $18 billion in loans for Project Jupiter traded at a discount, and Blue Owl Capital declined to finance a $10 billion data-center project for Oracle and OpenAI. Goldman Sachs investment-grade bond trader Jeffrey Papai noted that $75 billion of AI debt issuance over the past month pushed the Goldman Sachs AI corporate bond basket spread 22 bps wider in a week, and power and optical suppliers such as Bloom Energy (BE -6.9%) and Lumentum (LITE -7.5%) sold off alongside the data-center developers. However, no credit rating downgrades or defaults have hit AA-rated primary hyperscalers.
Hardware and memory chip weakness reflects separate equity and supply catalysts rather than bond contagion. According to Barclays and regulatory filings, Dell Technologies (DELL -8.7%) fell after Barclays analyst Tim Long downgraded the stock to Equal Weight on server memory cost pass-throughs and $29.4 million in Silver Lake affiliate share sales, while South Korea's ETF (EWY -4.5%) and the memory chip ETF (DRAM -5.3%) dropped on oversupply warnings as China's CXMT began mass production of 5th-generation and 4F² DRAM architectures.
Broad high-yield credit spreads have widened by roughly 50 basis points since the September 16 FOMC hike, but stress is heavily concentrated in CCC-rated and leveraged AI or airline borrowers rather than the broader index federalreserve.gov FITCHRATINGS. According to ICE Data Indices and St. Louis Fed (FRED) data, the ICE BofA US High Yield Index Option-Adjusted Spread widened from 2.66% on September 21 to 3.16% as of October 13, kept relatively tight by institutional demand for BB-rated paper FITCHRATINGS. By contrast, Apollo analysts noted that CCC-rated spreads blew out to 12.52% over Treasuries (roughly 15% yields), with JetBlue Airways (JBLU) 9.875% 2031 loyalty notes sinking to 72 cents on the dollar (~19% yield) and CoreWeave CDS surging. In equities, that credit tiering maps onto our Leverage factor (-0.18% today, z=-1.1; -4.78% over 60 days) and Profitability (+0.37%, z=+2.0), though intraday TRACE composite transaction prints for single-name JBLU bonds were not yet available this morning.
Today's 0.94% jump in One-Day Momentum (z=+3.4) reflects an intra-equity rotation out of high-beta tech into quality and defensive laggards rather than a margin-driven hedge-fund liquidation. As noted by Goldman Sachs One-Delta trading desk head Rich Privorotsky on October 13, desks have seen a rotation into laggards rather than cash-raising liquidation, and Goldman Sachs Prime Brokerage data as of the week of October 12 showed fundamental long/short net exposure already sitting at 46.9% (2nd percentile of the past year) with gross leverage at the 53rd percentile. Citadel Securities Global Market Intelligence noted on October 14 that single-stock volatility has widened against index volatility as winners and losers rotate beneath the surface — consistent with our Cboe implied dispersion (DSPX) sitting at 37.95 (96.7th percentile of its history) while VIX sits at 17.47 (49th percentile). No prime-brokerage reports attribute today's momentum move to margin calls or credit-driven forced selling.
The Producer Price Index (PPI), released at 8:30 AM ET, rose 1.3% month-over-month and 6.3% year-over-year in September CNBC, topping the 5.5% annual consensus forecast on higher energy and services costs before safe-haven bond buying reversed the initial yield spike CNBC. Advance Retail Sales, released at 8:30 AM ET, increased 0.8% month-over-month in September versus the 0.3% consensus estimate, driven by a 6.4% jump in gasoline station receipts while sales excluding gas and autos rose 0.2% census.gov. The Philadelphia Fed Manufacturing Survey, released at 8:30 AM ET, fell to 20.9 in October from 37.8 in September (missing the 28.4 consensus) as new orders dropped to 4.3 from 29.2, while Initial Claims for the week ended October 10 edged up 1,000 to 199,000 against a 200,000 consensus forecast dol.gov.
Variance decomposition: live intraday — 20261015 session, bracketed against its trailing-year range. Factor returns are trailing through last close. Total cross-sectional dispersion: 69%ile of the past year.
Variance mix — % of total, today vs 1d ago vs 1-yr avg
market 18%ile style 100.0%ile thematic 94.0%ile idiosyncratic 2.0%ile
Variance explained — today vs. factor's trailing-year range
Marker = the factor's share of today's total variance, placed in its own trailing-year range (box 25–75%ile, ticks 90%ile and max). Amber marker = unusually load-bearing today (≥90%ile of its own year). Factor name green = up today / red = down.
Correlation & dispersion — realized vs implied
Pairwise realized correlation (20d): 8.45% 4.9%ile since 2020 · 54%ile 3m most extreme since 2026-09-09
Top-500 pairwise: 11.17% 11%ile since 2020 · 78%ile 3m · implied (Cboe COR1M): 9.38 3.4%ile of its own history (gap +1.8pp)
Realized 20d vol (ann. pts): all stocks 37 vs VIXEQ 42 · index 10 vs VIX 17 · style factors 19 66%ile
20-day window (19 completed days + today); percentiles vs model history since 2020; '3m' tokens rank vs the trailing 63 trading days; definitions in Terms below. Implied prints (Cboe) are delayed ~15 min. as of 10:21 ET
Top 50 high-beta momentum names (eq-wt, since-2020 rank): -7.3% 1.4%ile worst since 2026-08-18 · rest of market +1.6%
| Factor | Today | 1d | 5d | 20d | 60d |
|---|---|---|---|---|---|
| Style-Risk | |||||
| Beta | -2.30% z-2.4 | -2.81% | -6.93% | -5.30% | -6.32% |
| International | +0.05% z+0.2 | +0.04% | +0.41% | -0.41% | +0.39% |
| Residual Volatility | -0.08% z-0.2 | -0.22% | -0.37% | +0.07% | +4.47% |
| Style | |||||
| Profitability | +0.37% z+2.0 | +0.34% | +0.80% | +2.20% | +0.11% |
| Size | -0.40% z-1.2 | +0.46% | +0.52% | +2.50% | +3.71% |
| Leverage | -0.18% z-1.1 | -0.27% | -0.59% | -1.73% | -4.78% |
| Dividend Yield | -0.18% z-1.0 | -0.11% | -0.58% | -1.20% | -1.46% |
| Growth | -0.10% z-0.4 | -0.35% | -0.31% | +0.70% | +1.44% |
| Value | -0.07% z-0.3 | -0.06% | +0.10% | +0.50% | +0.48% |
| Liquidity | +0.06% z+0.2 | -0.32% | -0.74% | -0.73% | +1.23% |
| Style-Momentum | |||||
| One-Day Momentum | +0.94% z+3.4 | -0.20% | +0.94% | +0.06% | -0.84% |
| Medium-Term Momentum | -0.55% z-1.9 | -0.24% | -0.10% | -0.78% | +1.17% |
| Long-Term Momentum | -1.24% z-1.9 | -0.04% | -1.31% | -0.40% | -3.32% |
| Short-Term Momentum | +0.14% z+0.5 | +0.11% | +0.67% | +1.60% | -5.33% |
| Style-Positioning | |||||
| Short Interest | +0.27% z+1.6 | +0.09% | +0.38% | -0.47% | -1.09% |
| Hedge-Fund Ownership | +0.16% z+1.5 | -0.10% | +0.17% | +0.13% | -0.15% |
| Style-Flow | |||||
| Short-Sale Activity | +0.13% z+1.2 | -0.12% | +0.10% | -0.21% | +0.90% |
| Morning Activity | +0.13% z+1.0 | -0.09% | -0.04% | -1.11% | +1.42% |
| Thematic | |||||
| Semiconductors | -1.54% z-2.5 | -0.55% | -2.93% | -2.58% | -7.06% |
| Oil | -1.07% z-2.3 | -0.11% | -0.87% | -0.36% | +3.85% |
| Treasury (Duration) | +0.67% z+2.1 | -0.27% | +0.13% | -1.53% | -3.44% |
| China | +0.22% z+0.5 | +0.01% | +0.05% | +0.44% | +0.50% |
| Gold | +0.06% z+0.2 | +0.01% | +0.24% | -1.53% | +2.22% |
| Bitcoin / Crypto | +0.01% z+0.0 | -0.18% | +0.15% | -0.35% | +1.93% |
5/20/60d windows include today's session; 1d is the previous session.
Market variance share. The fraction of cross-sectional variance explained by the market factor — the attribution companion to pairwise correlation, not a substitute for it.
Factor z-score. Today's factor return divided by its daily-return standard deviation over ~1,600 trading days.
High-beta momentum cohort. US names above $2B market cap in the top quintile of both raw beta and 12-month momentum; membership frozen at each month's first business day. “Top 50” = the 50 strongest by combined rank.
Dispersion (realized). Total cross-sectional volatility net of the market component; high dispersion is the flip side of low correlation.
Stock-specific (idiosyncratic) return. The part of a stock's move not explained by market, style, or thematic factors in our decomposition.
VIXEQ / DSPX / COR1M. Cboe implied indices: single-stock volatility, dispersion, and 1-month implied correlation (top-50 S&P names). Quotes delayed ~15 minutes.
Data compiled by FactorPulse AI; edited and verified by Jeff Klein. For informational purposes only. Does not constitute financial advice, an investment recommendation, or an offer to buy or sell any securities. Always consult a qualified financial professional before making investment decisions.
For more on factor construction methodology, see www.factorpulse.com/glossary.