Nvidia CEO Jensen Huang, speaking in Stockholm, rejected calls for the chip giant to financially backstop partner CoreWeave, saying the AI-infrastructure company's business is strengthening and needs no debt rescue. The cost of insuring CoreWeave's debt against default still hit a record, implying better than 60% odds of default, and its bonds due 2032 fell to about 77 cents on the dollar, yielding near 16%. Yet CoreWeave shares staged a sharp reversal, recovering from an early 9.5% drop to close up nearly 6%, a swing of about 15 points. Chip stocks still fell for a fifth straight day. Nvidia lost 1.8%, about $85 billion in market value, and the semiconductor fund SMH slid 1%. Chipmaker Taiwan Semiconductor fell 1.9% even after posting its sixth straight record quarterly profit, up 69% from a year earlier. The strain also showed at Oracle, whose own default-insurance cost hit a record as $18 billion in construction loans for its giant AI project in New Mexico traded below 90 cents on the dollar.
Investors piled into Treasuries even though September wholesale prices jumped 1.3%, the biggest monthly rise since 2022, putting producer inflation at 6.3% over the past year. The 10-year yield fell about a tenth of a percentage point to 5.09%. A Philadelphia Fed factory gauge dropped sharply, with its new-orders reading sliding to about 4 from 29, as markets looked ahead to the Fed's Oct. 27–28 meeting. Lower rates sent the homebuilder fund ITB up 4% and the small-cap fund IWM up 1.4%, as money moved out of the largest companies into smaller ones. Gold climbed 1.6% to about $4,170 an ounce, the gold-miner fund GDX jumped 4.4%, and the dollar slipped 0.5%. Crude rose 2.7% to about $98 a barrel after a weekly inventory draw, yet the oil-and-gas producer fund XOP fell 1.5%.
The selling of last year's biggest winners hit hardware maker Dell, which fell 7% after an 11% slide Wednesday that followed a Barclays downgrade arguing that corporate AI spending hasn't picked up. Seoul's stock market halted trading after an 8% drop in the KOSPI, driven by hot U.S. inflation and Chinese memory-chip maker ChangXin's unveiling of next-generation server memory, and the South Korea fund EWY fell 2.2%. On the earnings front, network-gear maker Ericsson rose nearly 12% on better-than-expected sales, while staffing firm ManpowerGroup sank 16% on shrinking margins and a CEO change. Auto retailer Penske Automotive gained 9% after agreeing to be taken private in an all-cash deal by its controlling shareholders, Penske Corp. and Mitsui.
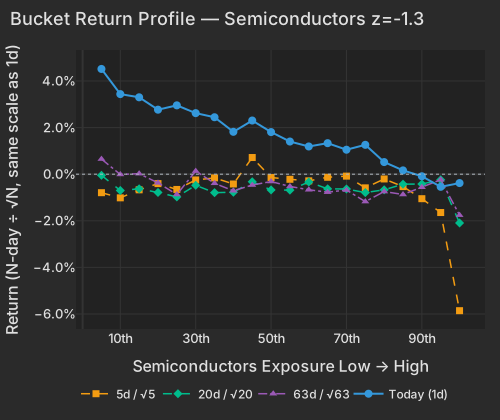
Speaking in Stockholm, Nvidia CEO Jensen Huang stated that key partner CoreWeave's operational health is strengthening and needs no debt rescue package, even as CoreWeave's 9.625% senior notes due 2032 fell to 76.5 cents on the dollar to yield near 16% Bloomberg. CoreWeave's 5-year credit default swaps widened by up to 74.5 basis points intraday to 1,194.5 basis points, pricing in more than a 60% probability of default Bloomberg. CoreWeave shares reversed an early 9.5% loss to close up 5.9%, a roughly 15-point swing on a day its bonds and credit default swaps weakened. The financing anxiety still weighed on the Semiconductors factor, which fell 0.81% (z=-1.3) for its fifth consecutive daily decline and a -2.21% five-day loss Bloomberg.
| Factor | Return | Z-Score | 5d Z | 20d Z | 63d Z | Category | Direction |
|---|---|---|---|---|---|---|---|
| Size | -0.69% | z=-2.0 | +0.3 | +1.4 | +1.3 | Style | Small caps led mega caps |
| Short-Sale Activity | +0.18% | z=+1.7 | +0.6 | -0.3 | +1.0 | Style-Flow | Heavily short-sold names outperformed |
| Treasury (Duration) | +0.54% | z=+1.7 | -0.0 | -1.2 | -1.2 | Thematic | Duration-sensitive equities rallied |
| One-Day Momentum | +0.42% | z=+1.5 | +0.7 | -0.4 | -0.7 | Style-Momentum | Yesterday's gainers continued higher |
| Oil | -0.71% | z=-1.5 | -0.4 | -0.0 | +1.8 | Thematic | Energy equities lagged crude futures |
| Long-Term Momentum | -0.86% | z=-1.3 | -0.7 | -0.0 | -0.2 | Style-Momentum | 12-month winners underperformed laggards |
| Semiconductors | -0.81% | z=-1.3 | -1.6 | -0.7 | -0.9 | Thematic | Chip names underperformed |
| Hedge-Fund Ownership | +0.14% | z=+1.3 | +0.6 | +0.2 | -0.6 | Style-Positioning | Hedge-fund-owned stocks outperformed |
The semiconductor weakness completely overshadowed fundamental earnings beats in the hardware supply chain. Taiwan Semiconductor Manufacturing (TSM) reported a sixth consecutive record quarterly profit of NT$763.1 billion (up 68.7% year-over-year) on $46.72 billion in revenue and a 66.4% gross margin CNBC. Yet TSM closed the regular session down 1.9% (erasing $33.2B of market value) with a virtually flat -0.03% stock-specific return, as style tilts (-2.2%) and thematic exposures (-0.5%) accounted for the entire decline. Nvidia (NVDA) similarly closed the regular session down 1.8% (erasing $85.1B) on a -1.4% style drag.
| Bucket | Ret 1D Pct | Ret 5D Norm Pct | Ret 20D Norm Pct | Ret 63D Norm Pct |
|---|---|---|---|---|
| 1 | 4.52 | -0.79 | -0.05 | 0.65 |
| 2 | 3.44 | -1.01 | -0.70 | -0.01 |
| 3 | 3.30 | -0.67 | -0.63 | 0.02 |
| 4 | 2.77 | -0.40 | -0.78 | -0.37 |
| 5 | 2.95 | -0.65 | -0.98 | -0.87 |
| 6 | 2.62 | -0.25 | -0.48 | 0.13 |
| 7 | 2.44 | -0.16 | -0.79 | -0.39 |
| 8 | 1.82 | -0.42 | -0.77 | -0.71 |
| 9 | 2.30 | 0.72 | -0.32 | -0.47 |
| 10 | 1.81 | -0.14 | -0.67 | -0.32 |
| 11 | 1.40 | -0.22 | -0.68 | -0.53 |
| 12 | 1.19 | -0.29 | -0.33 | -0.67 |
| 13 | 1.33 | -0.13 | -0.63 | -0.77 |
| 14 | 1.05 | -0.08 | -0.64 | -0.68 |
| 15 | 1.26 | -0.59 | -0.79 | -1.18 |
| 16 | 0.52 | -0.20 | -0.67 | -0.75 |
| 17 | 0.16 | -0.53 | -0.43 | -0.87 |
| 18 | -0.09 | -1.05 | -0.42 | -0.56 |
| 19 | -0.54 | -1.65 | -0.24 | -0.24 |
| 20 | -0.38 | -5.86 | -2.09 | -1.76 |
While the Beta factor stabilized today (-0.26% at z=-0.3 after a -4.89% five-day slide), the selling shifted directly into 12-month momentum — Long-Term Momentum in the table — and mega-cap size. Style factors explained 29.9% of cross-sectional variance today against a 22.7% one-year average (83.3rd percentile), with 12-month momentum (-0.86%, z=-1.3) alone accounting for 13.6% of total market variance and Size (-0.69%, z=-2.0) accounting for another 5.8%.
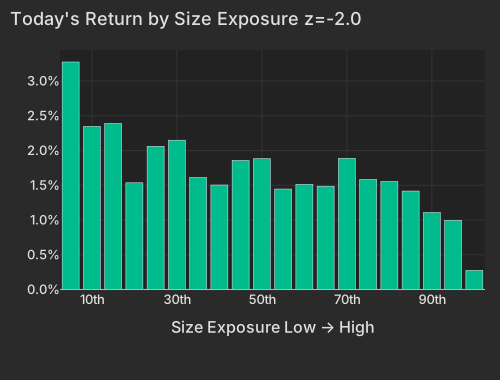
| Bucket | Avg Ret Pct |
|---|---|
| 1 | 3.27 |
| 2 | 2.35 |
| 3 | 2.39 |
| 4 | 1.54 |
| 5 | 2.06 |
| 6 | 2.15 |
| 7 | 1.61 |
| 8 | 1.50 |
| 9 | 1.86 |
| 10 | 1.88 |
| 11 | 1.45 |
| 12 | 1.51 |
| 13 | 1.49 |
| 14 | 1.89 |
| 15 | 1.58 |
| 16 | 1.55 |
| 17 | 1.42 |
| 18 | 1.11 |
| 19 | 1.00 |
| 20 | 0.28 |
Return decomposition confirms that several of the session's sharpest hardware drops were factor-carried rather than company-specific. Dell Technologies (DELL) closed the regular session down 7.3% (before ticking up 0.6% after hours to a -6.7% combined mark), with style factors driving -5.5% of the loss — led by a -3.7% drag from its 3.6-sigma exposure to 12-month momentum — and only -1.8% coming from its own residual move. Optical and component suppliers Viavi Solutions (VIAV, -4.5% with a -7.4% factor drag) and Vicor (VICR, -10.5% with a -7.1% factor drag) were similarly pulled lower by their momentum exposures. Meanwhile, yesterday's winners and losers — One-Day Momentum in the table — rose 0.42% (z=+1.5) alongside Short-Sale Activity (+0.18%, z=+1.7; +0.49% at z=+2.6 on a raw basis), as yesterday's defensive and small-cap gainers extended their advance while heavily short-sold names squeezed higher.
The rotation out of technology hardware fueled a safe-haven bid across the U.S. Treasury curve, brushing aside a 1.3% monthly surge in September Producer Price Index (6.3% year-over-year) BLS CNBC. The 10-year Treasury yield dropped 9.9 basis points to 5.091%, the 7-year yield fell 10.0 basis points to 4.99%, and the 30-year yield slid 9.4 basis points to 5.43%, while the U.S. Dollar Index (DXY) retreated 0.5% to 102.017 as of 4:06 PM EDT CNBC CNBC. Lower yields and a softer dollar lifted spot gold 1.6% to $4,172.34/oz at 4:06 PM EDT (pushing the Gold factor up 0.34% at z=+1.1) and boosted the Treasury (Duration) factor 0.54% (z=+1.7), reversing a multi-month headwind (-3.57% over 60 days, z=-1.2 over 63 days) CNBC.
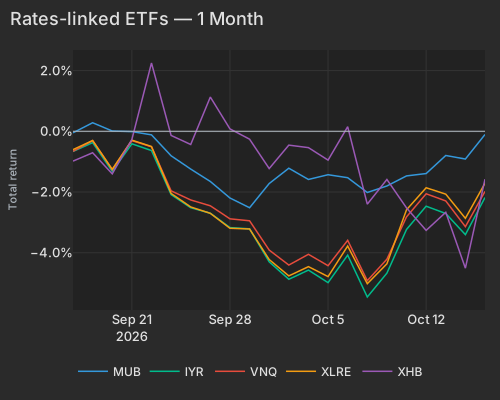
| T | Mub | Iyr | Vnq | Xlre | Xhb |
|---|---|---|---|---|---|
| 2026-09-16 | -0.05 | -0.66 | -0.66 | -0.60 | -0.98 |
| 2026-09-17 | 0.28 | -0.37 | -0.31 | -0.30 | -0.71 |
| 2026-09-18 | 0.01 | -1.32 | -1.26 | -1.25 | -1.40 |
| 2026-09-21 | -0.01 | -0.41 | -0.31 | -0.29 | -0.27 |
| 2026-09-22 | -0.12 | -0.63 | -0.51 | -0.50 | 2.25 |
| 2026-09-23 | -0.81 | -2.08 | -1.96 | -2.05 | -0.14 |
| 2026-09-24 | -1.24 | -2.52 | -2.26 | -2.49 | -0.43 |
| 2026-09-25 | -1.65 | -2.70 | -2.45 | -2.70 | 1.13 |
| 2026-09-28 | -2.20 | -3.17 | -2.88 | -3.19 | 0.08 |
| 2026-09-29 | -2.52 | -3.21 | -2.95 | -3.22 | -0.26 |
| 2026-09-30 | -1.72 | -4.30 | -3.91 | -4.22 | -1.23 |
| 2026-10-01 | -1.22 | -4.87 | -4.41 | -4.76 | -0.46 |
| 2026-10-02 | -1.59 | -4.57 | -4.05 | -4.46 | -0.54 |
| 2026-10-05 | -1.43 | -4.98 | -4.43 | -4.79 | -0.95 |
| 2026-10-06 | -1.53 | -4.08 | -3.59 | -3.78 | 0.15 |
| 2026-10-07 | -2.02 | -5.46 | -4.92 | -5.02 | -2.40 |
| 2026-10-08 | -1.80 | -4.67 | -4.21 | -4.36 | -1.59 |
| 2026-10-09 | -1.47 | -3.23 | -2.82 | -2.59 | -2.52 |
| 2026-10-12 | -1.39 | -2.47 | -2.06 | -1.86 | -3.26 |
| 2026-10-13 | -0.80 | -2.71 | -2.29 | -2.07 | -2.67 |
| 2026-10-14 | -0.91 | -3.40 | -3.14 | -2.87 | -4.51 |
| 2026-10-15 | -0.10 | -2.18 | -1.98 | -1.71 | -1.58 |
Rate-sensitive and defensive ETFs led the cross-asset tape, while energy equities decoupled sharply from crude futures. Front-month WTI crude gained 2.7% to $97.69/bbl at 3:56 PM EDT following an EIA-reported weekly inventory draw and easing tanker logistics, yet the Oil factor fell 0.71% (z=-1.5) as energy equities lagged the commodity eia.gov CNBC The Wall Street Journal. In digital assets, spot bitcoin edged up 0.7% to $82,266.09 at 4:06 PM EDT while the CoinShares Bitcoin Mining ETF (WGMI) rose 2.6% in the regular session on 1.8× typical session pace CNBC Bloomberg.
| ETF | Theme | Today | 1d Ago | 5d Ago | 20d Ago | 63d Ago |
|---|---|---|---|---|---|---|
| GDX | Gold miners | +4.4% | -4.4% | -2.4% | -10.1% | +16.8% |
| ITB | Homebuilders | +4.0% | -1.5% | -1.6% | -5.4% | -16.1% |
| XHB | Homebuilders | +3.1% | -1.9% | -2.2% | -3.6% | -15.8% |
| USO | Oil futures | +2.4% | +0.3% | +6.7% | -1.7% | +28.7% |
| TLT | 20+ Year Treasuries | +1.4% | +0.7% | +2.3% | -2.1% | -5.2% |
| IWM | Small cap | +1.4% | -1.9% | -2.3% | -4.4% | -8.0% |
| SMH | Semiconductors | -1.0% | -4.0% | -9.7% | +3.5% | -0.7% |
| XOP | Oil & Gas E&P | -1.5% | -1.0% | +5.1% | +3.6% | +19.4% |
| DRAM | Memory chips & storage | -1.5% | -5.1% | -16.5% | -9.4% | -4.2% |
| EWY | South Korea | -2.2% | -4.0% | -13.0% | -9.0% | -2.2% |
Idiosyncratic variance accounted for 46.7% of the cross-section (10.4th percentile of the past year), with single-stock shocks dominated by corporate restructuring, M&A, and third-quarter earnings. FMC Corporation (FMC) closed the regular session down 30.4% (and fell another 0.6% post-close) with a -35.2% stock-specific return after cutting its third-quarter outlook and announcing a $675 million commercial restructuring plan Financial Times. Conversely, Penske Automotive Group (PAG) surged 8.9% (+8.0% stock-specific, 100th percentile of its trailing year) after entering a definitive agreement to be taken private by controlling shareholders Penske Corp. and Mitsui & Co. in an all-cash deal The Wall Street Journal.
Earnings reactions in the regular sessionReporters worth over $100 billion, or moving more than 10% with a value above $5 billion
| Company | Move | Stock-specific | Market cap | What drove it |
|---|---|---|---|---|
| Charles Schwab SCHW | -2.5% | -4.2% | $167B | Q3 revenue and net interest income missed consensus Financial Times |
| Taiwan Semiconductor Manufacturing TSM | -1.9% | -0.0% | $2.2T | Factor drag offset record Q3 profit and margins CNBC |
| Ericsson American Depositary Shares ERIC | +11.7% | +8.4% | $31B | Strong Q3 network gear sales beat expectations The Wall Street Journal |
Stock-specific: the part of a stock's move not explained by the market, style or thematic (industry and theme) factors in the FactorPulse risk model.
Season to date: 24 of the 500 largest companies have reported (7% of market cap), on day 11 of the season. Of the 32 stocks with a confirmed earnings reaction, smaller and foreign reporters included, 14 (44%) rose on a stock-specific basis, within the 41%–62% range at this point in the last 8 seasons.
Outside the large-cap earnings panel, staffing firm ManpowerGroup (MAN) closed down 15.8% (-17.8% stock-specific) after reporting 74 basis points of third-quarter gross margin compression to 15.9% and a CEO transition. Attention now turns to Interactive Brokers Group (IBKR), due to report after the close today, followed by regional and insurance reporters Truist Financial (TFC), Travelers Companies (TRV), M&T Bank (MTB), and Citizens Financial (CFG) before the open on October 16.
The AI-infrastructure selloff is a segmented rout rather than uniform credit contagion: acute debt distress is confined to leveraged neoclouds and bespoke project-finance vehicles, whereas hardware and Korean memory declines reflect enterprise-demand and supply concerns Financial Times. Alongside CoreWeave's distressed notes, the Financial Times and Bloomberg reported Thursday that Oracle's (ORCL) 5-year credit default swap spread hit a record 288 basis points while $18 billion in bank construction loans for its 2.45-gigawatt Project Jupiter site in New Mexico traded below 90 cents on the dollar following a September 24 force majeure notice to developer Blue Owl Capital (OWL) over pipeline permitting delays. Gartner also warned on Thursday that over $3.5 trillion in cumulative AI infrastructure spending faces write-down risk by 2030, projecting 80% of neocloud providers will cease independent operations under elevated borrowing costs Bloomberg.
Outside of project debt, the selling has non-credit drivers. Dell's 7.3% regular-session drop followed Wednesday's 11.3% slide after Barclays analyst Tim Long downgraded the stock to Equal Weight, noting enterprise AI spending has not inflected and server revenue gains reflect memory cost pass-throughs, according to CNBC and MarketWatch. Meanwhile, the 2.2% regular-session drop in South Korea's ETF (EWY) and 1.5% fall in the Roundhill Memory ETF (DRAM) followed an 8% KOSPI circuit-breaker halt driven by hot U.S. inflation and China's ChangXin Memory Technologies (CXMT) unveiling next-generation 4F² DRAM server modules, according to Business Insider and the Financial Times Financial Times. There is no reporting of credit spread blowouts among primary hyperscalers (Microsoft, Meta, Alphabet, Amazon) or linking nuclear, uranium, or optical component drops to bond market stress.
Broad U.S. high-yield credit spreads have widened modestly since the September 16 rate hike, masking severe decompression in the lowest-rated tiers and debt-dependent borrowers FITCHRATINGS. According to Federal Reserve Bank of St. Louis (FRED) data updated Thursday, the ICE BofA US High Yield Index Option-Adjusted Spread closed at 3.25% on October 14, widening 59 basis points from its September 21 post-hike trough of 2.66%, while the CCC & Lower Option-Adjusted Spread reached 12.67% as of October 13. Fitch Ratings noted on October 6 that institutional demand for BB-rated debt has kept headline high-yield spreads relatively contained — corroborated today by the iShares High Yield Corporate Bond ETF (HYG) rising 0.4% (-2.3% over 63 days) — even as lower-tier borrowers face acute stress FITCHRATINGS.
That stress is concentrated in highly indebted issuers and reflected in our Leverage factor, which fell 0.21% today (z=-1.3) and is down 4.82% over the past 60 sessions. S&P Global reported on October 13 that elevated sovereign yields have widened an "AI divide" in corporate credit, while Bloomberg Law reported that JetBlue Airways' (JBLU) $2 billion of 9.875% senior secured notes due 2031 sank to 72 cents on the dollar in mid-October, pushing yields toward 19% and option-adjusted spreads past 1,000 basis points over Treasuries. No real-time TRACE composite intraday tape for secondary trading in JetBlue bonds was available as of Thursday afternoon.
Desk and prime-brokerage evidence indicates that today's +0.42% (z=+1.5) rise in One-Day Momentum reflects an internal factor shift out of mega-cap winners into cyclical and defensive laggards, rather than forced deleveraging or credit liquidation. According to Goldman Sachs Prime Brokerage data reported by Tickmill on October 13, U.S. Fundamental Long/Short hedge fund net leverage entered the week at 46.9% (2nd percentile on a one-year lookback) with gross leverage at 213.0% (53rd percentile), while separate Goldman Sachs Prime Brokerage reporting showed broader net leverage at a one-year low of 71.3% (10th percentile) against 5-year-high gross exposure of 313.7% and 98th-percentile net exposure to Information Technology. Goldman Sachs EMEA Delta-One trading desk head Rich Privorotsky similarly characterized the recent momentum selling on October 13 as a shift into laggards rather than a liquidation, as reported by Crypto Briefing, and our Hedge-Fund Ownership factor rose 0.14% today (z=+1.3; +0.04% on a raw basis).
Primary debt markets also remain open for leveraged corporate issuers rather than signaling a systemic credit freeze, with no prime-broker commentary attributing today's factor moves to margin calls. PR Newswire reported Thursday that Calumet issued a redemption notice to call $150 million of its 9.75% senior notes due 2028, while The RealReal secured a new $150 million senior secured term loan from Fortress Investment Group and a $25 million revolving facility to redeem its 2029 notes at par.
Four major U.S. releases printed at 8:30 AM ET, pairing hotter wholesale inflation with moderating regional manufacturing CNBC. The September Producer Price Index (PPI) for final demand surged 1.3% month-over-month (6.3% year-over-year, above the 5.5% forecast), marking the largest monthly jump since 2022 on higher energy and services costs, while September Advance Retail Sales rose 0.8% month-over-month (beating the 0.3% consensus) largely on a 6.4% jump in gasoline station receipts, with sales ex-gas and autos up 0.2% census.gov CNBC. Offsetting the inflation pressure, the October Philadelphia Fed Manufacturing Index dropped to 20.9 from 37.8 (missing the 28.4 consensus) as new orders fell from 29.2 to 4.3, and initial jobless claims for the week ended October 10 edged up by 1,000 to 199,000 (versus 200,000 expected), allowing Treasury yields to rally across the curve as markets looked past the inflation print toward the October 27–28 FOMC meeting Labor Department Federal Reserve CNBC.
Variance decomposition: live intraday — 20261015 session, bracketed against its trailing-year range. Factor returns are trailing through last close. Total cross-sectional dispersion: 65%ile of the past year.
Variance mix — % of total, today vs 1d ago vs 1-yr avg
market 85%ile style 83%ile thematic 94.8%ile idiosyncratic 10%ile
Variance explained — today vs. factor's trailing-year range
Marker = the factor's share of today's total variance, placed in its own trailing-year range (box 25–75%ile, ticks 90%ile and max). Amber marker = unusually load-bearing today (≥90%ile of its own year). Factor name green = up today / red = down.
Correlation & dispersion — realized vs implied
Pairwise realized correlation (20d): 10.01% 9.5%ile since 2020 · 95.2%ile 3m
Top-500 pairwise: 11.57% 12%ile since 2020 · 81%ile 3m · implied (Cboe COR1M): 7.63 1.3%ile of its own history (gap +3.9pp)
Realized 20d vol (ann. pts): all stocks 37 vs VIXEQ 41 · index 10 vs VIX 16 · style factors 18 62%ile
20-day window (19 completed days + today); percentiles vs model history since 2020; '3m' tokens rank vs the trailing 63 trading days; definitions in Terms below. Implied prints (Cboe) are delayed ~15 min. as of 15:58 ET
Top 50 high-beta momentum names (eq-wt, since-2020 rank): -2.5% 16%ile · rest of market +1.9%
| Factor | Today | 1d | 5d | 20d | 60d |
|---|---|---|---|---|---|
| Style-Risk | |||||
| Beta | -0.26% z-0.3 | -2.81% | -4.89% | -3.26% | -4.28% |
| International | +0.03% z+0.1 | +0.04% | +0.39% | -0.44% | +0.37% |
| Residual Volatility | +0.04% z+0.1 | -0.22% | -0.24% | +0.19% | +4.60% |
| Style | |||||
| Size | -0.69% z-2.0 | +0.46% | +0.22% | +2.20% | +3.42% |
| Leverage | -0.21% z-1.3 | -0.27% | -0.62% | -1.76% | -4.82% |
| Liquidity | +0.22% z+0.8 | -0.32% | -0.58% | -0.57% | +1.39% |
| Dividend Yield | -0.14% z-0.8 | -0.11% | -0.54% | -1.16% | -1.42% |
| Profitability | +0.08% z+0.4 | +0.34% | +0.51% | +1.92% | -0.18% |
| Growth | -0.03% z-0.1 | -0.35% | -0.24% | +0.77% | +1.51% |
| Value | +0.01% z+0.0 | -0.06% | +0.18% | +0.58% | +0.56% |
| Style-Momentum | |||||
| One-Day Momentum | +0.42% z+1.5 | -0.20% | +0.42% | -0.47% | -1.36% |
| Long-Term Momentum | -0.86% z-1.3 | -0.04% | -0.92% | -0.01% | -2.93% |
| Medium-Term Momentum | -0.28% z-1.0 | -0.24% | +0.17% | -0.51% | +1.44% |
| Short-Term Momentum | +0.12% z+0.4 | +0.11% | +0.65% | +1.58% | -5.35% |
| Style-Positioning | |||||
| Hedge-Fund Ownership | +0.14% z+1.3 | -0.10% | +0.16% | +0.11% | -0.17% |
| Short Interest | +0.15% z+0.9 | +0.09% | +0.26% | -0.59% | -1.21% |
| Style-Flow | |||||
| Short-Sale Activity | +0.18% z+1.7 | -0.12% | +0.15% | -0.16% | +0.95% |
| Morning Activity | -0.01% z-0.1 | -0.09% | -0.18% | -1.25% | +1.28% |
| Thematic | |||||
| Treasury (Duration) | +0.54% z+1.7 | -0.27% | -0.00% | -1.67% | -3.57% |
| Oil | -0.71% z-1.5 | -0.11% | -0.51% | -0.00% | +4.21% |
| Semiconductors | -0.81% z-1.3 | -0.55% | -2.21% | -1.85% | -6.34% |
| Gold | +0.34% z+1.1 | +0.01% | +0.52% | -1.25% | +2.51% |
| Bitcoin / Crypto | +0.27% z+0.9 | -0.18% | +0.41% | -0.08% | +2.20% |
| China | +0.15% z+0.4 | +0.01% | -0.01% | +0.38% | +0.43% |
5/20/60d windows include today's session; 1d is the previous session.
Pairwise realized correlation. Index variance net of the weighted idiosyncratic diagonal, over the cross terms — the estimator used for implied-correlation indices. 20-day window unless noted; history since 2020.
Market variance share. The fraction of cross-sectional variance explained by the market factor — the attribution companion to pairwise correlation, not a substitute for it.
Factor z-score. Today's factor return divided by its daily-return standard deviation over ~1,600 trading days.
Conditional importance. A factor's relative share of what a tree-based fit of today's stock returns explains; sums to 100% across factors.
High-beta momentum cohort. US names above $2B market cap in the top quintile of both raw beta and 12-month momentum; membership frozen at each month's first business day. “Top 50” = the 50 strongest by combined rank.
Dispersion (realized). Total cross-sectional volatility net of the market component; high dispersion is the flip side of low correlation.
Stock-specific (idiosyncratic) return. The part of a stock's move not explained by the market, style or thematic (industry and theme) factors in the FactorPulse risk model.
VIXEQ / DSPX / COR1M. Cboe implied indices: single-stock volatility, dispersion, and 1-month implied correlation (top-50 S&P names). Quotes delayed ~15 minutes.
Data compiled by FactorPulse AI; edited and verified by Jeff Klein. For informational purposes only. Does not constitute financial advice, an investment recommendation, or an offer to buy or sell any securities. Always consult a qualified financial professional before making investment decisions.
For more on factor construction methodology, see www.factorpulse.com/glossary.