A 9% jump in gasoline prices pushed September consumer inflation to 3.7%, a tick above the 3.6% forecasts, and sent bond yields higher Wednesday morning. The two-year Treasury yield rose to nearly 4.9% and the 10-year to about 5.25%, as traders shifted bets toward a Federal Reserve rate hike at its October 27–28 meeting. The dollar gained 0.7%. Oil rose about 1% to roughly $95 a barrel after an overnight attack on a Saudi Aramco building in Dhahran.
High-beta stocks fell hardest, extending a five-day slide. The crypto-miner fund WGMI fell about 9% as bitcoin slipped to roughly $82,000. Power-equipment maker GE Vernova lost 7%, or about $19 billion in market value, amid warnings about debt-fueled AI infrastructure spending, and the AI power fund AIPO fell more than 4%. AI cloud provider CoreWeave dropped about 15% as its bonds fell into distressed territory, where they yield more than 15%. The semiconductor fund SMH dropped 3%, with Nvidia down 2% and AMD down 4%. Chipmaker GlobalFoundries rose 4% after securing up to $21 billion in U.S.-Japan funding to run two new plants in Malta, New York. With mortgage rates at 7.5%, the homebuilder fund ITB fell nearly 3%, and the small-cap fund IWM lost about 1.5%. The biggest names gained: Apple rose 1%, and Eli Lilly climbed 4% after Walmart expanded zero-cost coverage of GLP-1 weight-loss drugs for its 1.6 million U.S. employees. The healthcare fund XLV rose about 2%.
Bank earnings added to the pressure. Bank of America fell 7%, erasing about $26 billion in value, after a 17% profit decline, a revenue miss and a $1.2 billion regulatory penalty for anti-money-laundering and sanctions violations. Insurer Progressive also dropped 7% after its quarterly earnings and premiums came in below estimates, and custody bank State Street slid 7% on a profit miss. Morgan Stanley fell 3% even after beating estimates on nearly $6 billion in stock-trading revenue. More bank results arrive before Thursday's opening bell from Charles Schwab, BNY, U.S. Bancorp and PNC, along with warehouse owner Prologis.
The Bureau of Labor Statistics reported that headline September CPI rose 0.6% month-over-month and 3.7% annually, topping the 3.6% consensus on a 9.1% monthly jump in gasoline prices, while core CPI rose 0.3% on the month and 2.6% year-over-year BLS. Before the 8:30 AM ET release, fed funds futures priced roughly a 22% probability of a rate hike at the October 28 FOMC decision federalreserve.gov Morningstar; after the print, bond traders shifted bets toward tightening. The 2-year Treasury yield climbed 6.8 bps to 4.861% CNBC and the 10-year yield rose 3.2 bps to 5.249% CNBC, lifting the U.S. Dollar Index 0.7% to 102.888 at 11:32 AM EDT CNBC.
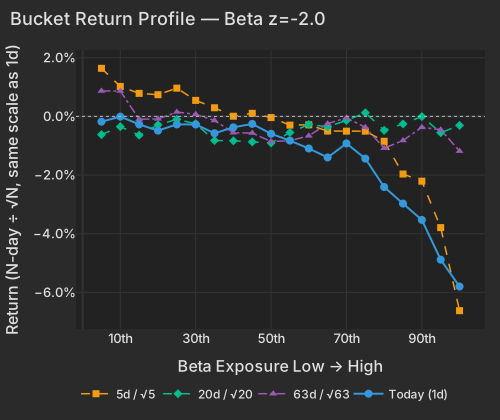
Higher yields extended a five-day slide in high-beta stocks. Beta fell 1.92% (z=-2.0) and generated 29.9% of all cross-sectional variance today, bringing its five-day cumulative decline to 5.73% (z=-2.7) with four down sessions in five. The top 50 high-beta momentum names dropped 4.6% on an equal-weighted basis (5.3rd percentile since 2020) while the ~190-name high-beta momentum cohort fell 3.8% and the rest of the universe lost just 0.7%. In yesterday's session, volume in the top 50 group ran below the market's pace at 0.51× and the easiest-to-sell names were not sold first (-0.8% in the highest-liquidity tier versus -2.4% in the lowest), a sign of thin participation heading into today's inflation print.
| Factor | Return | Z-Score | 5d Z | 20d Z | 63d Z | Category | Direction |
|---|---|---|---|---|---|---|---|
| Beta | -1.92% | z=-2.0 | z=-2.7 | z=-0.1 | z=-0.1 | Style-Risk | Low-beta outperformed |
| Size | +0.47% | z=+1.4 | z=+0.9 | z=+2.0 | z=+1.5 | Style | Large-cap outperformed |
| Treasury (Duration) | -0.37% | z=-1.2 | z=-0.4 | z=-1.5 | z=-1.4 | Thematic | Rate-sensitive lagged |
| Leverage | -0.19% | z=-1.1 | z=-1.8 | z=-2.0 | z=-3.2 | Style | Low-leverage outperformed |
| Profitability | +0.20% | z=+1.1 | z=+0.9 | z=+1.5 | z=-0.2 | Style | High-profitability led |
| Value | -0.24% | z=-1.1 | z=+0.5 | z=+0.3 | z=+0.3 | Style | Expensive outperformed cheap |
| Liquidity | -0.27% | z=-1.0 | z=-1.3 | z=-0.6 | z=+1.4 | Style | Low-turnover outperformed |
| Short-Sale Activity | -0.11% | z=-1.0 | z=-0.2 | z=-0.7 | z=+0.7 | Style-Flow | Barely-shorted led T+1 |
| Bucket | Ret 1D Pct | Ret 5D Norm Pct | Ret 20D Norm Pct | Ret 63D Norm Pct |
|---|---|---|---|---|
| 1 | -0.18 | 1.64 | -0.62 | 0.87 |
| 2 | -0.01 | 1.02 | -0.35 | 0.87 |
| 3 | -0.27 | 0.78 | -0.64 | -0.10 |
| 4 | -0.48 | 0.74 | -0.29 | -0.09 |
| 5 | -0.27 | 0.96 | -0.10 | 0.15 |
| 6 | -0.27 | 0.55 | -0.25 | 0.07 |
| 7 | -0.58 | 0.29 | -0.82 | -0.14 |
| 8 | -0.37 | 0.01 | -0.83 | -0.56 |
| 9 | -0.26 | 0.10 | -0.87 | -0.57 |
| 10 | -0.59 | -0.04 | -0.91 | -0.86 |
| 11 | -0.82 | -0.30 | -0.55 | -0.83 |
| 12 | -1.09 | -0.29 | -0.27 | -0.66 |
| 13 | -1.40 | -0.50 | -0.35 | -0.25 |
| 14 | -0.92 | -0.50 | -0.14 | -0.05 |
| 15 | -1.44 | -0.50 | 0.12 | -0.37 |
| 16 | -2.41 | -0.85 | -0.47 | -1.08 |
| 17 | -2.97 | -1.96 | -0.26 | -0.82 |
| 18 | -3.53 | -2.21 | -0.01 | -0.37 |
| 19 | -4.88 | -3.79 | -0.55 | -0.45 |
| 20 | -5.80 | -6.62 | -0.31 | -1.18 |
Heavily indebted companies kept lagging. Leverage fell 0.19% (z=-1.1) today, extending a 20-day loss of 1.46% (z=-2.0) and a 60-day slide of 4.09% (63-day z=-3.2). Over the 63 sessions through Tuesday it lost about as much on days Treasury yields fell as on days they rose, so rates alone do not explain the slide. Treasury (Duration) dropped 0.37% (z=-1.2), bringing its 60-day return to -3.52% (63-day z=-1.4) as 30-year fixed U.S. mortgage rates reached 7.5% and pushed national home-purchase activity into a sixth straight weekly decline Bloomberg.
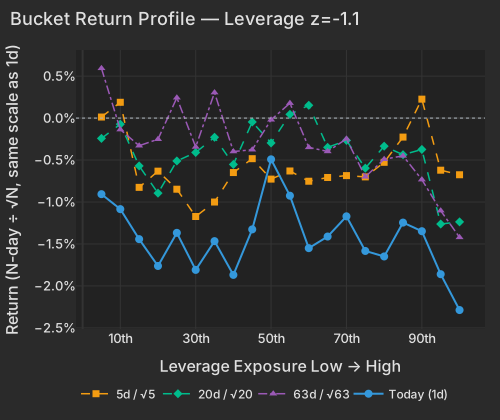
| Bucket | Ret 1D Pct | Ret 5D Norm Pct | Ret 20D Norm Pct | Ret 63D Norm Pct |
|---|---|---|---|---|
| 1 | -0.91 | 0.01 | -0.24 | 0.59 |
| 2 | -1.08 | 0.19 | -0.07 | -0.14 |
| 3 | -1.44 | -0.83 | -0.57 | -0.33 |
| 4 | -1.76 | -0.63 | -0.89 | -0.25 |
| 5 | -1.37 | -0.85 | -0.51 | 0.24 |
| 6 | -1.81 | -1.17 | -0.41 | -0.34 |
| 7 | -1.47 | -1.00 | -0.23 | 0.30 |
| 8 | -1.87 | -0.65 | -0.55 | -0.40 |
| 9 | -1.33 | -0.48 | -0.05 | -0.38 |
| 10 | -0.49 | -0.73 | -0.30 | -0.02 |
| 11 | -0.92 | -0.63 | 0.04 | 0.18 |
| 12 | -1.55 | -0.75 | 0.15 | -0.35 |
| 13 | -1.41 | -0.71 | -0.35 | -0.40 |
| 14 | -1.17 | -0.69 | -0.27 | -0.25 |
| 15 | -1.58 | -0.70 | -0.60 | -0.70 |
| 16 | -1.65 | -0.53 | -0.33 | -0.49 |
| 17 | -1.25 | -0.23 | -0.44 | -0.45 |
| 18 | -1.35 | 0.23 | -0.37 | -0.73 |
| 19 | -1.86 | -0.62 | -1.26 | -1.10 |
| 20 | -2.29 | -0.68 | -1.24 | -1.42 |
Warnings about debt-fueled AI infrastructure spending and over-reserved data-center grid capacity pushed GE Vernova down 7.2%, erasing $19.3B of market value; 4.7 points of the drop were specific to the stock Bloomberg. Concern about debt-funded AI capacity also hit AI cloud provider CoreWeave, which fell 14.8%, erasing about $6B of market value, after its bonds tumbled into distressed territory, drawing a "yikes" from Elon Musk. At their current price the bonds yield more than 15%, a figure investor Chamath Palihapitiya pointed out Bloomberg; 7.6 points of the drop were specific to the stock and most of the rest came from its high-beta exposure. The company is seeking investment-grade ratings for chip-backed debt so it can borrow from insurers, the FT reported FT. Spot bitcoin slipped 1.6% to $81,784.50 at 11:32 AM EDT CNBC, and bitcoin miners IREN and Applied Digital fell 9.3% and 7.9%, almost entirely through their factor exposures. Spot gold fell 1.5% to $4,092.92 an ounce at 11:31 AM EDT CNBC WSJ. An overnight attack on a Saudi Aramco building in Dhahran lifted WTI crude 0.9% to $94.98 a barrel at 11:22 AM EDT CNBC CNBC.
Defense funds are posting some of their weakest three-month returns since 2018. Over the 63 sessions through Tuesday, XAR fell 16.3% (4.4th percentile of its history) and ITA 13.6% (3.7th percentile); the two sit 25.2% and 19.1% below the peaks they set on August 14.
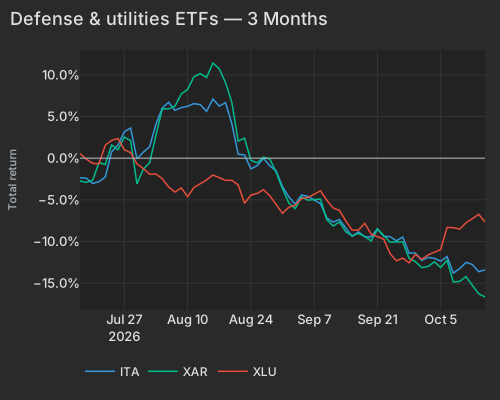
| T | Ita | Xar | Xlu |
|---|---|---|---|
| 2026-07-16 | -2.34 | -2.73 | 0.55 |
| 2026-07-17 | -2.41 | -2.91 | -0.11 |
| 2026-07-20 | -3.02 | -2.63 | -0.62 |
| 2026-07-21 | -2.83 | -0.53 | -0.66 |
| 2026-07-22 | -2.25 | -0.76 | 1.57 |
| 2026-07-23 | 0.77 | 1.58 | 2.15 |
| 2026-07-24 | 1.57 | 1.01 | 2.37 |
| 2026-07-27 | 3.17 | 2.53 | 1.02 |
| 2026-07-28 | 3.62 | 2.10 | 0.66 |
| 2026-07-29 | -0.07 | -3.08 | -0.69 |
| 2026-07-30 | 0.72 | -1.31 | -1.24 |
| 2026-07-31 | 1.37 | -0.55 | -1.92 |
| 2026-08-03 | 4.09 | 2.74 | -1.90 |
| 2026-08-04 | 6.02 | 5.92 | -2.45 |
| 2026-08-05 | 6.71 | 5.92 | -3.45 |
| 2026-08-07 | 6.06 | 7.70 | -3.56 |
| 2026-08-10 | 6.22 | 8.25 | -4.62 |
| 2026-08-11 | 6.55 | 9.77 | -3.52 |
| 2026-08-12 | 6.43 | 10.15 | -3.05 |
| 2026-08-13 | 5.61 | 9.68 | -2.61 |
| 2026-08-14 | 7.10 | 11.42 | -2.01 |
| 2026-08-17 | 6.25 | 10.72 | -2.30 |
| 2026-08-18 | 6.66 | 9.05 | -2.65 |
| 2026-08-19 | 4.12 | 6.68 | -2.65 |
| 2026-08-20 | 0.48 | 2.05 | -3.21 |
| 2026-08-21 | 0.39 | 2.41 | -5.42 |
| 2026-08-24 | -1.28 | -0.27 | -4.42 |
| 2026-08-25 | -0.90 | -0.55 | -4.22 |
| 2026-08-26 | -0.02 | 0.12 | -3.78 |
| 2026-08-27 | -0.91 | -0.10 | -4.51 |
| 2026-08-31 | -3.41 | -3.68 | -6.61 |
| 2026-09-01 | -4.64 | -5.36 | -5.88 |
| 2026-09-02 | -5.52 | -6.05 | -5.64 |
| 2026-09-03 | -4.42 | -4.65 | -4.84 |
| 2026-09-04 | -4.57 | -5.03 | -4.73 |
| 2026-09-08 | -5.45 | -4.90 | -3.91 |
| 2026-09-09 | -7.18 | -7.37 | -5.04 |
| 2026-09-10 | -7.66 | -8.13 | -5.97 |
| 2026-09-11 | -7.36 | -7.64 | -6.26 |
| 2026-09-14 | -8.31 | -8.82 | -7.52 |
| 2026-09-15 | -9.38 | -9.31 | -8.62 |
| 2026-09-16 | -8.84 | -9.02 | -8.62 |
| 2026-09-17 | -9.43 | -9.39 | -7.81 |
| 2026-09-18 | -9.44 | -9.94 | -9.11 |
| 2026-09-21 | -8.47 | -8.50 | -9.42 |
| 2026-09-23 | -9.41 | -10.07 | -11.45 |
| 2026-09-24 | -9.90 | -10.04 | -12.32 |
| 2026-09-25 | -9.46 | -10.04 | -11.98 |
| 2026-09-28 | -11.38 | -12.02 | -12.56 |
| 2026-09-29 | -11.37 | -12.40 | -11.54 |
| 2026-09-30 | -12.27 | -13.12 | -12.14 |
| 2026-10-01 | -11.90 | -12.99 | -11.60 |
| 2026-10-02 | -12.01 | -12.43 | -11.27 |
| 2026-10-05 | -12.35 | -13.11 | -10.96 |
| 2026-10-06 | -11.81 | -12.23 | -8.31 |
| 2026-10-07 | -13.78 | -14.85 | -8.33 |
| 2026-10-08 | -13.24 | -14.77 | -8.51 |
| 2026-10-09 | -12.49 | -14.21 | -7.75 |
| 2026-10-12 | -12.75 | -15.25 | -7.26 |
| 2026-10-13 | -13.61 | -16.27 | -6.72 |
| 2026-10-14 | -13.40 | -16.65 | -7.64 |
| ETF | Theme | Today | 1d Ago | 5d Ago | 20d Ago | 63d Ago |
|---|---|---|---|---|---|---|
| WGMI | Crypto miners | -8.7% | -3.1% | -15.7% | -12.1% | -28.6% |
| SLV | Silver (2.6× vol pace) | -5.5% | -1.6% | -3.5% | -7.0% | +2.5% |
| AIPO | AI power infrastructure | -4.5% | -0.1% | -5.9% | +3.7% | -7.4% |
| URA | Uranium | -4.4% | -0.9% | -10.6% | -10.5% | -8.6% |
| DRAM | Memory chips & storage | -3.4% | -3.4% | -11.2% | -3.9% | -7.9% |
| SMH | Semiconductors | -2.9% | -0.5% | -7.0% | +8.5% | -0.5% |
| ITB | Homebuilders | -2.6% | +0.8% | -2.7% | -5.0% | -12.9% |
| IWM | Small cap | -1.6% | -0.4% | -1.7% | -3.0% | -6.2% |
| XLP | Consumer staples | +1.3% | -0.3% | +2.9% | +1.2% | +1.5% |
| XLV | Healthcare | +1.9% | -1.4% | +1.5% | +1.6% | +7.6% |
Chip funds fell sharply, while the Semiconductors factor slipped just 0.25% (z=-0.4), so the chip losses came through Beta and Size exposures. Nvidia fell 2.4%, erasing $135.4B of market value, Taiwan Semiconductor lost 2.3% and Wolfspeed dropped 11.8%, nearly all of it through market and factor exposures. Company news lifted two chipmakers against the tide. GlobalFoundries rose 4.0%, a 7.6% stock-specific gain, after securing up to $21 billion in U.S.-Japan funding to operate two new fabs in Malta, New York Bloomberg, and ASML slipped only 0.6% after projecting that AI-driven EUV lithography demand will exceed production capacity through 2028 FT.
Size gained 0.47% (z=+1.4), extending its 20-day advance to 3.03% (z=+2.0) and 60-day run to 4.31% as mega-cap balance sheets buffered the index. Apple rose 1.3%, adding $66.9B of market value with +2.2% contributed by its style tilts (99th percentile of its trailing year), while Eli Lilly gained 4.1% (adding $41.7B, +3.1% stock-specific) after Walmart expanded zero-cost GLP-1 coverage for its 1.6 million U.S. employees and manufacturing partner Lonza raised its medium-term biologics profitability outlook WSJ. In smaller health-care names, Liquidia surged 25.9% (+26.8% stock-specific) and Halozyme climbed 7.9% (+8.5% stock-specific).
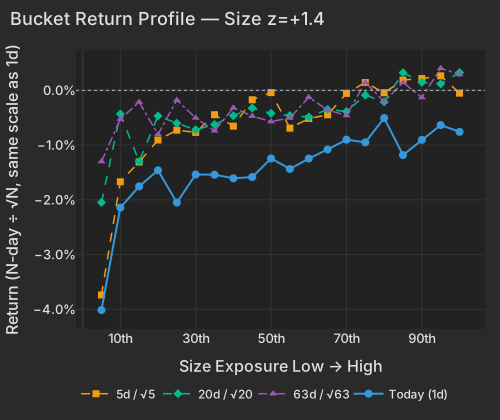
| Bucket | Ret 1D Pct | Ret 5D Norm Pct | Ret 20D Norm Pct | Ret 63D Norm Pct |
|---|---|---|---|---|
| 1 | -4.01 | -3.74 | -2.05 | -1.30 |
| 2 | -2.14 | -1.67 | -0.43 | -0.53 |
| 3 | -1.75 | -1.31 | -1.30 | -0.21 |
| 4 | -1.46 | -0.91 | -0.47 | -0.80 |
| 5 | -2.05 | -0.73 | -0.60 | -0.18 |
| 6 | -1.54 | -0.77 | -0.72 | -0.50 |
| 7 | -1.54 | -0.45 | -0.62 | -0.74 |
| 8 | -1.61 | -0.65 | -0.46 | -0.32 |
| 9 | -1.58 | -0.17 | -0.32 | -0.47 |
| 10 | -1.24 | -0.04 | -0.42 | -0.57 |
| 11 | -1.44 | -0.69 | -0.46 | -0.50 |
| 12 | -1.24 | -0.51 | -0.49 | -0.13 |
| 13 | -1.08 | -0.45 | -0.35 | -0.36 |
| 14 | -0.90 | -0.06 | -0.39 | -0.46 |
| 15 | -0.95 | 0.14 | -0.09 | 0.15 |
| 16 | -0.51 | -0.04 | -0.21 | -0.21 |
| 17 | -1.18 | 0.19 | 0.32 | 0.14 |
| 18 | -0.90 | 0.22 | 0.15 | -0.13 |
| 19 | -0.63 | 0.27 | 0.12 | 0.40 |
| 20 | -0.76 | -0.05 | 0.33 | 0.29 |
Bank of America dropped 6.9%, erasing $25.6B of market value, after third-quarter profit fell 17% to $0.91 a share and revenue of $30.12 billion missed estimates; a $1.2 billion penalty from the OCC and FinCEN over anti-money-laundering and sanctions violations weighed on the results CNBC Bloomberg. The financials fund XLF fell 1.0%.
Earnings reactions so far todayReporters worth over $100 billion, or moving more than 10% with a value above $5 billion
| Company | Move | Market cap | Revenue YoY | Margin YoY | What drove it |
|---|---|---|---|---|---|
| Progressive PGR | -6.9% | $129B | — | — | Q3 EPS and net premiums written missed estimates WSJ |
| Bank of America BAC | -6.9% | $377B | +3%† | -5.9 pts† pre-tax | Revenue miss and $1.2B Treasury AML penalty CNBC |
| Morgan Stanley MS | -3.4% | $293B | +12% | -1.2 pts pre-tax | Sequential decline overshadowed Q3 equities trading beat Bloomberg |
| ASML ASML | -0.6% | $660B | — | — | Slight Q3 sales miss offset strong 2027-2028 outlook FT |
| BlackRock BLK | +0.1% | $165B | +19% | +2.7 pts adj. operating | Reported Q3 results with 19% YoY revenue growth |
Revenue and margin from the company's earnings release, year over year; margin change in percentage points; — where the release is not parsed or the figures failed checks.
† The company's year-ago figure differs from the one originally filed, usually a restatement; growth is on its current basis.
Season to date: 18 of the top 500 have reported (7% of market cap), day 10 of the season; 12 of 24 reactions were positive on a stock-specific basis; at this point in the last 8 seasons that share ran from 40% to 65%.
Across the broader universe, 20-day pairwise realized correlation sits at 9.92% (9.0th percentile since 2020, 93.7th percentile of the past three months) while implied 1-month single-stock correlation (Cboe COR1M) trades at 8.42 (2.2nd percentile of its 20-year history) and implied dispersion (Cboe DSPX) stands at 36.29 (95.1st percentile). That wide single-stock dispersion faces its next test before tomorrow's open on October 15, when Charles Schwab (SCHW), Prologis (PLD), BNY (BNY), U.S. Bancorp (USB), and PNC (PNC) are scheduled to report results.
The Consumer Price Index, released at 8:30 AM ET, showed headline inflation rising 0.6% month-over-month and 3.7% year-over-year in September, topping consensus estimates of 3.6%, while core CPI rose 0.3% on the month and 2.6% annually bls.gov BLS. A 9.1% monthly surge in gasoline prices and a 0.4% increase in shelter costs drove the beat, lifting Treasury yields across the curve and prompting fixed-income traders to price higher odds of a Federal Reserve rate hike at the October 27–28 FOMC meeting BLS Morningstar.
Variance decomposition: live intraday — 20261014 session, bracketed against its trailing-year range. Factor returns are trailing through last close. Total cross-sectional dispersion: 60%ile of the past year.
Variance mix — % of total, today vs 1d ago vs 1-yr avg
market 85%ile style 88%ile thematic 15%ile idiosyncratic 11%ile
Variance explained — today vs. factor's trailing-year range
Marker = the factor's share of today's total variance, placed in its own trailing-year range (box 25–75%ile, ticks 90%ile and max). Amber marker = unusually load-bearing today (≥90%ile of its own year). Factor name green = up today / red = down.
Correlation & dispersion — realized vs implied
Pairwise realized correlation (20d): 9.92% 9.0%ile since 2020 · 93.7%ile 3m
Top-500 pairwise: 13.76% 20%ile since 2020 · 100.0%ile 3m · implied (Cboe COR1M): 8.42 2.2%ile of its own history (gap +5.3pp)
Realized 20d vol (ann. pts): all stocks 36 vs VIXEQ 40 · index 10 vs VIX 16 · style factors 16 52%ile
20-day window (19 completed days + today); percentiles vs model history since 2020; '3m' tokens rank vs the trailing 63 trading days; definitions in Terms below. Implied prints (Cboe) are delayed ~15 min. as of 11:21 ET
Top 50 high-beta momentum names (eq-wt, since-2020 rank): -4.6% 5.3%ile · rest of market -0.7%
| Factor | Today | 1d | 5d | 20d | 60d |
|---|---|---|---|---|---|
| Style-Risk | |||||
| Beta | -1.92% z-2.0 | -0.54% | -5.73% | -0.59% | -3.27% |
| International | +0.06% z+0.2 | +0.14% | +0.22% | -0.24% | +0.56% |
| Residual Volatility | -0.03% z-0.1 | -0.13% | -0.12% | +0.65% | +4.03% |
| Style | |||||
| Size | +0.47% z+1.4 | +0.06% | +0.66% | +3.03% | +4.31% |
| Leverage | -0.19% z-1.1 | +0.05% | -0.66% | -1.46% | -4.09% |
| Profitability | +0.20% z+1.1 | +0.28% | +0.49% | +1.53% | -0.32% |
| Value | -0.24% z-1.1 | +0.51% | +0.24% | +0.26% | +0.70% |
| Liquidity | -0.27% z-1.0 | +0.10% | -0.79% | -0.70% | +1.25% |
| Growth | -0.16% z-0.7 | +0.08% | -0.09% | +0.80% | +1.54% |
| Dividend Yield | -0.11% z-0.7 | -0.01% | -0.28% | -0.75% | -1.11% |
| Style-Momentum | |||||
| One-Day Momentum | -0.18% z-0.6 | +0.20% | +0.08% | -0.79% | -1.50% |
| Medium-Term Momentum | -0.12% z-0.4 | +0.21% | +0.47% | +0.18% | +1.16% |
| Long-Term Momentum | +0.24% z+0.4 | +0.03% | -0.09% | +1.71% | -1.52% |
| Short-Term Momentum | -0.04% z-0.1 | -0.08% | +0.27% | +1.25% | -6.01% |
| Style-Positioning | |||||
| Hedge-Fund Ownership | -0.10% z-0.9 | -0.06% | -0.04% | -0.12% | -0.52% |
| Short Interest | +0.13% z+0.8 | -0.06% | +0.14% | -0.70% | -1.71% |
| Style-Flow | |||||
| Short-Sale Activity | -0.11% z-1.0 | +0.14% | -0.04% | -0.32% | +0.85% |
| Morning Activity | +0.01% z+0.1 | -0.06% | -0.03% | -0.91% | +1.34% |
| Thematic | |||||
| Treasury (Duration) | -0.37% z-1.2 | -0.13% | -0.28% | -2.13% | -3.52% |
| China | +0.17% z+0.4 | -0.22% | -0.14% | +0.24% | +0.83% |
| Semiconductors | -0.25% z-0.4 | -0.11% | -1.97% | -0.55% | -4.61% |
| Oil | +0.07% z+0.1 | +0.37% | +0.53% | +1.27% | +4.98% |
| Bitcoin / Crypto | -0.02% z-0.1 | -0.09% | +0.26% | -0.26% | +1.80% |
| Gold | -0.02% z-0.1 | -0.30% | +0.12% | -1.18% | +2.66% |
5/20/60d windows include today's session; 1d is the previous session.
Pairwise realized correlation. Index variance net of the weighted idiosyncratic diagonal, over the cross terms — the estimator used for implied-correlation indices. 20-day window unless noted; history since 2020.
Factor z-score. Today's factor return divided by its daily-return standard deviation over ~1,600 trading days.
High-beta momentum cohort. US names above $2B market cap in the top quintile of both raw beta and 12-month momentum; membership frozen at each month's first business day. “Top 50” = the 50 strongest by combined rank.
Dispersion (realized). Total cross-sectional volatility net of the market component; high dispersion is the flip side of low correlation.
Stock-specific (idiosyncratic) return. The part of a stock's move not explained by market, style, or thematic factors in our decomposition.
VIXEQ / DSPX / COR1M. Cboe implied indices: single-stock volatility, dispersion, and 1-month implied correlation (top-50 S&P names). Quotes delayed ~15 minutes.
Data compiled by FactorPulse AI; edited and verified by Jeff Klein. For informational purposes only. Does not constitute financial advice, an investment recommendation, or an offer to buy or sell any securities. Always consult a qualified financial professional before making investment decisions.
For more on factor construction methodology, see www.factorpulse.com/glossary.