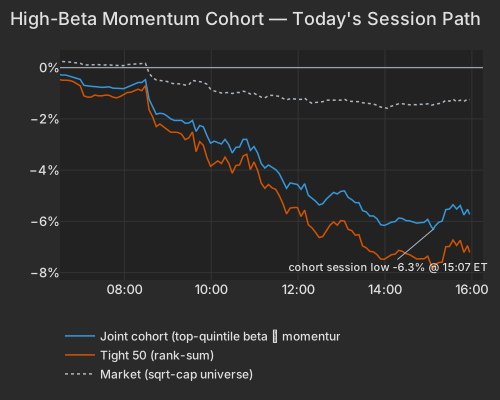
A hotter-than-expected September inflation report and a debt scare at AI cloud provider CoreWeave sent the stocks most sensitive to market moves down nearly 6% on Wednesday, their third severe drop in five sessions. The rest of the market slipped about half a percent, and the S&P 500 fund SPY lost 1.2%. Consumer prices rose 3.7% from a year earlier, above the 3.6% forecast, and a 9% monthly jump in gasoline accounted for more than half the increase. Before the report, traders put the odds of a Fed rate hike at the October 28 meeting at about 22%. The odds jumped to about 40% after it, then eased to about one in three as Treasuries rallied in the afternoon. The 2-year Treasury yield ended only slightly higher after a sharp morning jump, the 30-year yield fell to about 5.5%, and the long-term Treasury fund TLT gained 0.6%.
CoreWeave's shares fell 15%, erasing about $6 billion of market value, as its bonds slid into distressed territory, with yields above 15% and its 2032 notes trading below 80 cents on the dollar. The worry spread to the companies building out AI. Cloud and software company Oracle fell 9%, erasing about $40 billion in market value, as the cost of insuring its debt hit an 18-year high after an S&P downgrade. Computer maker Dell fell 11%, losing about $42 billion, after Barclays downgraded the stock, citing no meaningful AI pickup in business demand. Chipmaker Nvidia fell 3%, the semiconductor fund SMH 4% and the crypto-miner fund WGMI 11%. Investors moved into safer corners: the healthcare fund XLV rose 2.5%, the consumer staples fund XLP 2%, and retailer Walmart 3.5%. Drugmaker Eli Lilly gained nearly 4% after Walmart said it would cover some GLP-1 drugs at no cost for its U.S. employees.
Bank earnings added to the pain. Bank of America fell nearly 5% after missing on revenue and taking a $1.2 billion penalty for lax money-laundering oversight, and Wall Street firm Morgan Stanley fell 2.6% even though its equities trading beat estimates. Insurer Progressive dropped 4.5% after missing on earnings and premiums. Oil rose 1% to about $95 a barrel after Saudi officials said an Aramco building in Dhahran was attacked. Gold fell 1.4% to about $4,100 an ounce and the silver fund SLV dropped 6%, as rising Fed hike odds and a dollar that touched a one-year high weighed on metals. Financial firms Charles Schwab, PNC, U.S. Bancorp and BNY report before Thursday's open.
The Bureau of Labor Statistics said consumer prices rose 3.7% from a year earlier in September, above the 3.6% consensus. Gasoline's 9.1% monthly jump accounted for more than half of the increase BLS. Before the release, fed funds futures priced only about a 22% chance of a hike at the October 28 decision Morningstar. The odds rose to about 40% after the print, then fell back to about 33% by late afternoon as Treasuries rallied and Fed officials signaled no rush to raise rates again Investing.com. Pricing for a December hike firmed over the same stretch Investing.com. The 2-year yield peaked at 4.952%, 15.9 bp above Tuesday's close, and ended up 2.1 bp at 4.814% CNBC. The 10-year reversed from a 5.329% high to close 1.9 bp lower at 5.198% CNBC. The 30-year fell 3.3 bp to 5.53% CNBC. That rules out a long-duration selloff: TLT gained 0.6% and the Treasury (Duration) factor slipped only -0.26% at z=-0.8.
The Beta factor fell -2.77% at z=-2.9, bringing its five-day loss to -6.58%. The high-beta momentum cohort was down 5.6% late in the session. Its last two extreme days were October 8 and October 12. The group was already 18.3% below its peak at Tuesday's close. The top 50 names fell 7.0%, and the losses were spread across the group in their usual proportion. The low came at 3:07 pm, with no meaningful late bounce.
| Series | Ret Pct |
|---|---|
| joint | -5.55 |
| tight50 | -6.98 |
| market | -1.21 |
| rest | -0.52 |
The biggest losers were mostly moving on their beta exposure, not their own news. Applied Optoelectronics (AAOI) fell 11.8% and Ouster (OUST) 9.6%, and both had stock-specific components near zero. Wolfspeed (WOLF) lost 14.1%, of which just 1.3% was its own move. Nvidia (NVDA) closed down 3.2%, with style exposures accounting for 1.9%.
| Factor | Return | Z-Score | 5d Z | 20d Z | 63d Z | Category | Direction |
|---|---|---|---|---|---|---|---|
| Beta | -2.77% | -2.9 | -3.1 | -0.3 | -0.3 | Style-Risk | High-beta lagged |
| Profitability | +0.32% | +1.7 | +1.4 | +2.0 | -0.3 | Style | Profitable led |
| Leverage | -0.25% | -1.5 | -1.9 | -2.0 | -3.2 | Style | Levered lagged |
| Growth | -0.33% | -1.4 | -0.5 | +0.6 | +0.7 | Style | Fast growers lagged |
| Size | +0.42% | +1.2 | +0.8 | +1.9 | +1.5 | Style | Large caps led |
| Hedge-Fund Ownership | -0.09% | -0.9 | -0.1 | -0.2 | -0.9 | Style-Positioning | Flat |
| Semiconductors | -0.52% | -0.9 | -1.7 | -0.3 | -0.6 | Thematic | Mild drag |
| Long-Term Momentum | -0.05% | -0.1 | -0.3 | +0.5 | +0.1 | Style-Momentum | Flat |
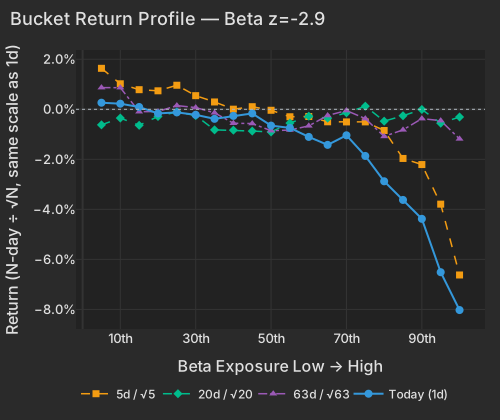
| Bucket | Ret 1D Pct | Ret 5D Norm Pct | Ret 20D Norm Pct | Ret 63D Norm Pct |
|---|---|---|---|---|
| 1 | 0.26 | 1.64 | -0.62 | 0.87 |
| 2 | 0.22 | 1.02 | -0.35 | 0.87 |
| 3 | 0.09 | 0.78 | -0.64 | -0.10 |
| 4 | -0.16 | 0.74 | -0.29 | -0.09 |
| 5 | -0.12 | 0.96 | -0.10 | 0.15 |
| 6 | -0.22 | 0.55 | -0.25 | 0.07 |
| 7 | -0.38 | 0.29 | -0.82 | -0.14 |
| 8 | -0.26 | 0.01 | -0.83 | -0.56 |
| 9 | -0.16 | 0.10 | -0.87 | -0.57 |
| 10 | -0.65 | -0.04 | -0.91 | -0.86 |
| 11 | -0.74 | -0.30 | -0.55 | -0.83 |
| 12 | -1.10 | -0.29 | -0.27 | -0.66 |
| 13 | -1.42 | -0.50 | -0.35 | -0.25 |
| 14 | -1.04 | -0.50 | -0.14 | -0.05 |
| 15 | -1.86 | -0.50 | 0.12 | -0.37 |
| 16 | -2.88 | -0.85 | -0.47 | -1.08 |
| 17 | -3.62 | -1.96 | -0.26 | -0.82 |
| 18 | -4.38 | -2.21 | -0.01 | -0.37 |
| 19 | -6.51 | -3.79 | -0.55 | -0.45 |
| 20 | -8.03 | -6.62 | -0.31 | -1.18 |
CoreWeave's bonds fell into distressed territory at yields above 15% Bloomberg. Its shares fell 15.4%, erasing about $6.4B of market value. About 6.5 points of the drop were specific to the stock, and most of the rest came from its high-beta exposure. Oracle's loss erased about $40B of market value. About 4.4% of it was stock-specific. The Financial Times put Oracle's five-year credit default swaps near 203 bp, an 18-year high, following an S&P downgrade to BBB- FT. Dell's loss erased about $42B, with 6.1% of the drop stock-specific, after Barclays cut the stock to Equal Weight Economic Times. GE Vernova (GEV) lost 6.4% as concern about debt-funded data-center demand reached the AI power names Bloomberg. The table shows the split: AI power, uranium and memory-chip funds fell 5–11%, while defensive sector funds and long Treasuries rose.
| ETF | Theme | Today | 1d Ago | 5d Ago | 20d Ago | 63d Ago |
|---|---|---|---|---|---|---|
| XLV | healthcare | +2.5% | -1.4% | +1.5% | +1.6% | +7.6% |
| XLP | consumer staples | +2.2% | -0.3% | +2.9% | +1.2% | +1.5% |
| TLT | long-term bonds | +0.6% | +0.4% | +1.4% | -2.5% | -5.9% |
| SPY | large cap | -1.2% | -0.01% | -0.1% | +3.0% | +3.3% |
| SMH | semiconductors | -3.9% | -0.5% | -7.0% | +8.5% | -0.4% |
| URA | uranium | -5.1% | -0.9% | -10.6% | -10.5% | -8.6% |
| DRAM | memory chips & storage | -5.1% | -3.4% | -11.2% | -3.9% | -7.9% |
| AIPO | AI power infrastructure | -5.3% | -0.1% | -5.9% | +3.7% | -7.4% |
| SLV | silver | -6.1% | -1.6% | -3.5% | -7.0% | +2.5% |
| WGMI | crypto miners | -10.7% | -3.1% | -15.7% | -12.1% | -28.6% |
Stocks that qualify only as high-beta fell 5.0%. Stocks that qualify only on 12-month momentum fell just 0.7%. The Semiconductors factor slipped only -0.52% at z=-0.9 while SMH dropped 3.9%, so chip stocks fell because they are high-beta, not because they make chips. Style factors explained 46% of stock-level variance against a 23% one-year norm, and Beta alone accounted for about 42%. Large, profitable, low-beta names held up. Profitability rose +0.32% at z=+1.7, and Walmart (WMT) gained 3.5%, most of it from that profile. Eli Lilly (LLY) rose 3.8% after Walmart said it would cover some GLP-1 drugs at no cost for its U.S. employees WSJ.
Nothing in today's data points to hedge funds as the sellers. The Hedge-Fund Ownership factor slipped just -0.09% at z=-0.9, so the stocks hedge funds own most did about as well as everything else. The high-beta group is not unusually hedge-fund-owned either; its holders lean toward retail investors, judging by how much of its trading usually happens in the morning.
Investors have also been marking down leveraged balance sheets for three months. The Leverage factor fell -0.25% at z=-1.5 today, continuing a run with a 63-day z of -3.2. Its loss over that period is -4.15%. The most-levered names, led by KKR, Annaly (NLY) and UWM (UWMC), fell an average 2.7%. The CoreWeave and Oracle credit stories sit on top of that three-month trend.
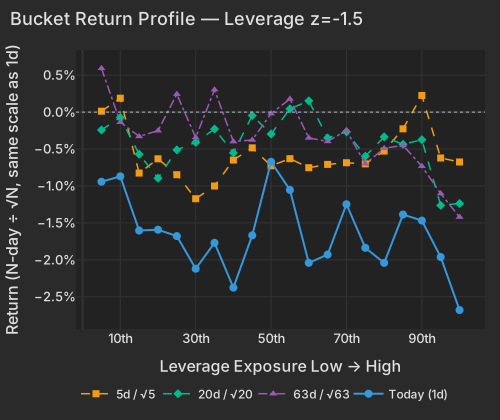
| Bucket | Ret 1D Pct | Ret 5D Norm Pct | Ret 20D Norm Pct | Ret 63D Norm Pct |
|---|---|---|---|---|
| 1 | -0.94 | 0.01 | -0.24 | 0.59 |
| 2 | -0.87 | 0.19 | -0.07 | -0.14 |
| 3 | -1.60 | -0.83 | -0.57 | -0.33 |
| 4 | -1.59 | -0.63 | -0.89 | -0.25 |
| 5 | -1.68 | -0.85 | -0.51 | 0.24 |
| 6 | -2.12 | -1.17 | -0.41 | -0.34 |
| 7 | -1.77 | -1.00 | -0.23 | 0.30 |
| 8 | -2.38 | -0.65 | -0.55 | -0.40 |
| 9 | -1.67 | -0.48 | -0.05 | -0.38 |
| 10 | -0.67 | -0.73 | -0.30 | -0.02 |
| 11 | -1.05 | -0.63 | 0.04 | 0.18 |
| 12 | -2.04 | -0.75 | 0.15 | -0.35 |
| 13 | -1.93 | -0.71 | -0.35 | -0.40 |
| 14 | -1.25 | -0.69 | -0.27 | -0.25 |
| 15 | -1.84 | -0.70 | -0.60 | -0.70 |
| 16 | -2.04 | -0.53 | -0.33 | -0.49 |
| 17 | -1.39 | -0.23 | -0.44 | -0.45 |
| 18 | -1.47 | 0.23 | -0.37 | -0.73 |
| 19 | -1.96 | -0.62 | -1.26 | -1.10 |
| 20 | -2.68 | -0.68 | -1.24 | -1.42 |
Bank of America (BAC) closed down 4.7% after a revenue miss and a $1.2 billion penalty for lax money-laundering oversight NYT. Morgan Stanley (MS) lost 2.6% even though equities trading beat estimates Bloomberg. Progressive (PGR) fell 4.5% after missing on earnings and premiums written WSJ.
Earnings reactions in the regular sessionReporters worth over $100 billion, or moving more than 10% with a value above $5 billion
| Company | Move | Stock-specific | Market cap | Revenue YoY | Margin YoY | What drove it |
|---|---|---|---|---|---|---|
| Bank of America BAC | -4.7% | -4.8% | $377B | +3%† | -5.9 pts† pre-tax | Revenue miss, $1.2 billion regulatory fine NYT |
| Progressive PGR | -4.5% | -5.7% | $129B | — | — | EPS and premiums written missed estimates WSJ |
| ASML ASML | -3.4% | -0.9% | $660B | — | — | Narrow revenue miss despite raised guidance |
| Morgan Stanley MS | -2.6% | -0.9% | $293B | +12% | -1.2 pts pre-tax | Equities beat; fixed income, banking soft Bloomberg |
| BlackRock BLK | +0.8% | +1.5% | $165B | +19% | +2.7 pts adj. operating | Record assets under management |
Stock-specific: the part of the move left after the FactorPulse risk model removes the market, style-factor and industry effects.
Revenue and margin from the company's earnings release, year over year; margin change in percentage points; — where the release is not parsed or the figures failed checks.
† The company's year-ago figure differs from the one originally filed, usually a restatement; growth is on its current basis.
Season to date: 18 of the top 500 have reported (7% of market cap), day 10 of the season; 11 of 24 reactions were positive on a stock-specific basis; at this point in the last 8 seasons that share ran from 40% to 65%.
Charles Schwab, PNC, U.S. Bancorp and BNY report before Thursday's open.
Only partly. Credit stress explains CoreWeave and Oracle, but most of the wider damage spread through beta exposure rather than through balance sheets. Oracle's data-center build is largely debt-funded, a risk Axios flagged in September Axios. CoreWeave's 2032 notes traded below 80 cents on the dollar. Investment-grade spreads on megacap hyperscaler bonds have widened toward 80 bp from about 50 bp FT. Dell fell after Barclays cut it to Equal Weight and lowered its price target to $574 24/7 Wall St.. The optical and sensor names, such as AAOI and OUST, fell almost entirely on their factor exposures. Memory chips and Korea have their own story. The Financial Times reported that CXMT announced advances in DRAM and that the buyback programs at Samsung Electronics and SK Hynix have ended. There is no evidence yet that lenders have pulled existing credit lines from the neocloud operators beyond the drop in their bond prices.
Higher Fed hike odds and a stronger dollar after CPI outweighed the oil shock. Odds of an October hike, about 22% before the report, rose above 40% after it, and gold slumped as those bets built Mining.com. Spot gold was $4,099.79 at 4:14 pm, down 1.4% CNBC. SLV fell 6.1% on 1.8× its typical session volume. The dollar index was 102.553 at 4:14 pm after touching a one-year high of 102.95 during the session CNBC. WTI crude was $95.09 at 4:04 pm, up 1.0% CNBC, after Saudi officials said an Aramco building in Dhahran was attacked CNBC. Higher oil adds to inflation, which pushes hike odds up, which hurts metals that pay no yield. Central banks were not reported among the sellers: China's central bank added gold for a 23rd straight month in September Mining.com. No desk data on systematic selling in metals is available yet.
The Consumer Price Index, released at 8:30 AM ET, showed headline prices up 0.6% on the month bls.gov. Core prices rose 0.3% on the month and 2.6% from a year earlier, both above forecasts BLS. Front-end yields spiked after the release and gave back most of the rise by the close, while longer yields ended lower, leaving the October 28 FOMC decision as the next test of hike pricing federalreserve.gov.
Variance decomposition: live intraday — 20261014 session, bracketed against its trailing-year range. Factor returns are trailing through last close. Total cross-sectional dispersion: 85%ile of the past year.
Variance mix — % of total, today vs 1d ago vs 1-yr avg
market 82%ile style 96.4%ile thematic 12%ile idiosyncratic 2.8%ile
Variance explained — today vs. factor's trailing-year range
Marker = the factor's share of today's total variance, placed in its own trailing-year range (box 25–75%ile, ticks 90%ile and max). Amber marker = unusually load-bearing today (≥90%ile of its own year). Factor name green = up today / red = down.
Correlation & dispersion — realized vs implied
Pairwise realized correlation (20d): 9.99% 9.4%ile since 2020 · 95.2%ile 3m
Top-500 pairwise: 14.24% 21%ile since 2020 · 100.0%ile 3m · implied (Cboe COR1M): 9.06 3.0%ile of its own history (gap +5.2pp)
Realized 20d vol (ann. pts): all stocks 37 vs VIXEQ 40 · index 10 vs VIX 17 · style factors 18 61%ile
20-day window (19 completed days + today); percentiles vs model history since 2020; '3m' tokens rank vs the trailing 63 trading days; definitions in Terms below. Implied prints (Cboe) are delayed ~15 min. as of 15:58 ET
High-beta momentum cohort (eq-wt, since-2020 rank): -5.5% 1.5%ile worst since 2026-08-18 · rest of market -0.5%
| Factor | Today | 1d | 5d | 20d | 60d |
|---|---|---|---|---|---|
| Style-Risk | |||||
| Beta | -2.77% z-2.9 | -0.54% | -6.58% | -1.43% | -4.11% |
| Residual Volatility | -0.23% z-0.5 | -0.13% | -0.32% | +0.46% | +3.84% |
| International | +0.08% z+0.3 | +0.14% | +0.24% | -0.22% | +0.58% |
| Style | |||||
| Profitability | +0.32% z+1.7 | +0.28% | +0.61% | +1.65% | -0.20% |
| Leverage | -0.25% z-1.5 | +0.05% | -0.71% | -1.52% | -4.15% |
| Growth | -0.33% z-1.4 | +0.08% | -0.26% | +0.63% | +1.38% |
| Liquidity | -0.33% z-1.2 | +0.10% | -0.85% | -0.76% | +1.19% |
| Size | +0.42% z+1.2 | +0.06% | +0.61% | +2.99% | +4.26% |
| Dividend Yield | -0.10% z-0.6 | -0.01% | -0.27% | -0.73% | -1.10% |
| Value | -0.07% z-0.3 | +0.51% | +0.41% | +0.44% | +0.88% |
| Style-Momentum | |||||
| Medium-Term Momentum | -0.24% z-0.9 | +0.21% | +0.35% | +0.06% | +1.04% |
| One-Day Momentum | -0.20% z-0.7 | +0.20% | +0.06% | -0.81% | -1.52% |
| Short-Term Momentum | +0.09% z+0.3 | -0.08% | +0.40% | +1.38% | -5.88% |
| Long-Term Momentum | -0.05% z-0.1 | +0.03% | -0.37% | +1.42% | -1.80% |
| Style-Positioning | |||||
| Hedge-Fund Ownership | -0.09% z-0.9 | -0.06% | -0.04% | -0.11% | -0.51% |
| Short Interest | +0.04% z+0.2 | -0.06% | +0.05% | -0.79% | -1.80% |
| Style-Flow | |||||
| Short-Sale Activity | -0.12% z-1.1 | +0.14% | -0.05% | -0.33% | +0.84% |
| Morning Activity | -0.04% z-0.3 | -0.06% | -0.08% | -0.96% | +1.29% |
| Thematic | |||||
| Semiconductors | -0.52% z-0.9 | -0.11% | -2.25% | -0.83% | -4.89% |
| Treasury (Duration) | -0.26% z-0.8 | -0.13% | -0.16% | -2.01% | -3.40% |
| Bitcoin / Crypto | -0.19% z-0.6 | -0.09% | +0.10% | -0.43% | +1.63% |
| Oil | -0.08% z-0.2 | +0.37% | +0.38% | +1.12% | +4.83% |
| Gold | +0.04% z+0.1 | -0.30% | +0.18% | -1.13% | +2.72% |
| China | +0.03% z+0.1 | -0.22% | -0.28% | +0.10% | +0.69% |
5/20/60d windows include today's session; 1d is the previous session.
Factor z-score. Today's factor return divided by its daily-return standard deviation over ~1,600 trading days.
High-beta momentum cohort. US names above $2B market cap in the top quintile of both raw beta and 12-month momentum; membership frozen at each month's first business day. “Top 50” = the 50 strongest by combined rank.
Stock-specific (idiosyncratic) return. The part of a stock's move not explained by market, style, or thematic factors in our decomposition.
Data compiled by FactorPulse AI; edited and verified by Jeff Klein. For informational purposes only. Does not constitute financial advice, an investment recommendation, or an offer to buy or sell any securities. Always consult a qualified financial professional before making investment decisions.
For more on factor construction methodology, see www.factorpulse.com/glossary.