A 9% jump in gasoline prices pushed September consumer-price inflation to 3.7% from a year earlier, above the 3.6% forecasters expected, and sent Treasury yields sharply higher. The two-year yield rose about 0.14 percentage point to roughly 4.93%, the 10-year yield climbed to about 5.31%, and the dollar rose 0.5% to just below its high of the past year ahead of the Federal Reserve's Oct. 27–28 meeting. Traders raised the odds of an October rate hike to about 40%, from about 22% before the report. In early trading, the highest-beta quarter of stocks fell about 1.6% on average while the steadiest quarter gained 0.2%. These stocks, the ones most sensitive to market moves, have now dropped in four of the past five sessions. Chip stocks were hit hardest. Chip-industry heavyweight ASML fell 1.6%, erasing about $10 billion in market value, after third-quarter sales came in slightly below estimates, even though it raised its sales forecast and said AI demand will outstrip its supply for two more years. Chipmaker SK hynix fell nearly 4%, and the semiconductor fund SMH fell almost 2%.
Bank of America fell 6.6% after its third-quarter profit dropped 17% to 91 cents a share, short of the $1.10 analysts expected. The decline erased about $25 billion in market value. A $1.2 billion regulatory penalty over anti-money-laundering and sanctions violations weighed on the results, along with a 17% drop in bond-trading revenue, which outweighed a 10% gain in stock trading. The bigger worry was that regulators said the bank had failed to fix problems flagged under a 2024 cease-and-desist order. Morgan Stanley beat expectations, with stock-trading revenue about $900 million above estimates, and its shares fell 2.6%. Among other early reports, the bank State Street fell 8% and the insurer Progressive fell 5.5%.
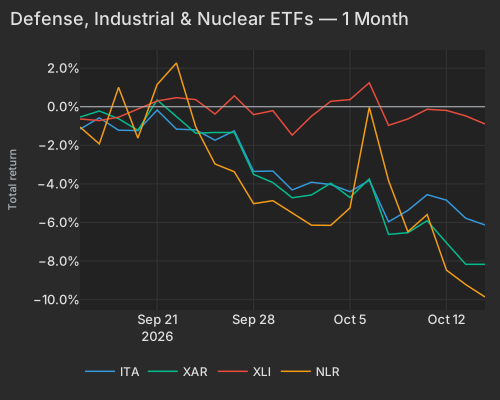
Oil rose 1.7% to about $96 a barrel after Saudi Arabia's energy ministry confirmed an overnight attack on a Saudi Aramco building in Dhahran. The attack followed Houthi strikes on Riyadh and an International Energy Agency warning that supply buffers are tightening. The energy fund XLE rose 0.7%. Gold fell 1.3% to about $4,100 an ounce as higher yields and a stronger dollar weighed on it, and the silver fund SLV fell nearly 4%. Defense stocks kept sliding. The aerospace and defense fund ITA fell 0.6% and is down about 14% over three months, roughly 20% below its Aug. 14 peak, while the uranium and nuclear fund NLR is down about 10% over the past month. Shares of heavily indebted companies have also lagged steadily for three months.
The hotter CPI print hit the front end hardest. The 2-year Treasury yield rose 13.6 bps to 4.929% at 8:55 AM ET, and the 10-year rose 9.1 bps to 5.308% CNBC CNBC. The U.S. Dollar Index (DXY) rose 0.5% to 102.687 at 8:56 AM ET, just below its 52-week high of 102.72 CNBC. Before the report, futures priced about a 22% chance of an October rate hike Morningstar; afterward, traders raised it to around 40%.
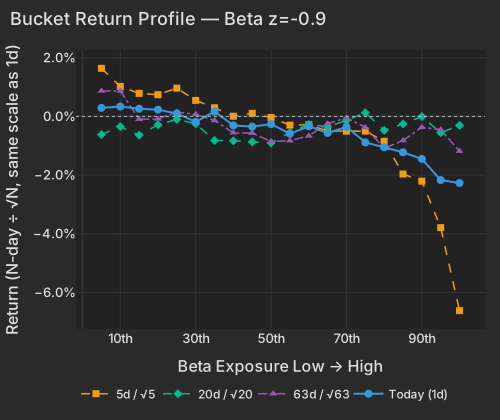
Higher yields extended the selloff in high-beta stocks to a fourth session in five. Beta fell 0.87% at z=-0.9 and explained 27.1% of cross-sectional variance. In early trading, the highest-beta tenth of stocks lost 2.2% on average, while the lowest-beta tenth gained 0.3%. ASML Holding (ASML) slipped 1.6%, erasing $10.4B of market value, after third-quarter revenue came in slightly below estimates GuruFocus, even though it raised its sales forecast and said AI demand will exceed its supply for two more years Bloomberg. SK hynix (SKHY) and Dell Technologies (DELL) each fell 3.7%. Common exposures also dragged down AXT (AXTI), Wolfspeed (WOLF) and MaxLinear (MXL), which fell 3.6%, 3.3% and 3.0%. GlobalFoundries (GFS) rose 6.0% after it was selected to operate two new chip plants in Malta, New York, under a U.S.-Japan initiative in which Japan will fund up to $21 billion GlobeNewswire. The Commerce Department will take a roughly 4% equity stake in the company as part of the deal. The broad market and its factor exposures cost it 1.9% in all, so the stock-specific gain was 7.9%.
| Factor | Return | Z-Score | 5d Z | 20d Z | 63d Z | Category | Direction |
|---|---|---|---|---|---|---|---|
| Beta | -0.87% | -0.9 | -2.2 | +0.1 | -0.0 | Style-Risk | High-beta lagged |
| Leverage | -0.08% | -0.5 | -1.5 | -1.8 | -3.1 | Style | High-leverage lagged |
| Gold | -0.15% | -0.5 | -0.0 | -0.8 | +0.9 | Thematic | Gold-exposed lagged |
| Short Interest | +0.07% | +0.4 | +0.2 | -1.0 | -1.7 | Style-Positioning | Most-shorted led |
| Profitability | +0.07% | +0.4 | +0.6 | +1.2 | -0.2 | Style | Profitable names led |
| Semiconductors | -0.20% | -0.3 | -1.4 | -0.2 | -0.5 | Thematic | Semis lagged |
| Short-Term Momentum | +0.09% | +0.3 | +0.6 | +1.0 | -2.7 | Style-Momentum | Prior-week winners led |
| Bucket | Ret 1D Pct | Ret 5D Norm Pct | Ret 20D Norm Pct | Ret 63D Norm Pct |
|---|---|---|---|---|
| 1 | 0.29 | 1.64 | -0.62 | 0.87 |
| 2 | 0.34 | 1.02 | -0.35 | 0.87 |
| 3 | 0.26 | 0.78 | -0.64 | -0.10 |
| 4 | 0.23 | 0.74 | -0.29 | -0.09 |
| 5 | 0.10 | 0.96 | -0.10 | 0.15 |
| 6 | -0.19 | 0.55 | -0.25 | 0.07 |
| 7 | 0.17 | 0.29 | -0.82 | -0.14 |
| 8 | -0.31 | 0.01 | -0.83 | -0.56 |
| 9 | -0.35 | 0.10 | -0.87 | -0.57 |
| 10 | -0.26 | -0.04 | -0.91 | -0.86 |
| 11 | -0.59 | -0.30 | -0.55 | -0.83 |
| 12 | -0.34 | -0.29 | -0.27 | -0.66 |
| 13 | -0.57 | -0.50 | -0.35 | -0.25 |
| 14 | -0.36 | -0.50 | -0.14 | -0.05 |
| 15 | -0.89 | -0.50 | 0.12 | -0.37 |
| 16 | -1.05 | -0.85 | -0.47 | -1.08 |
| 17 | -1.22 | -1.96 | -0.26 | -0.82 |
| 18 | -1.45 | -2.21 | -0.01 | -0.37 |
| 19 | -2.17 | -3.79 | -0.55 | -0.45 |
| 20 | -2.27 | -6.62 | -0.31 | -1.18 |
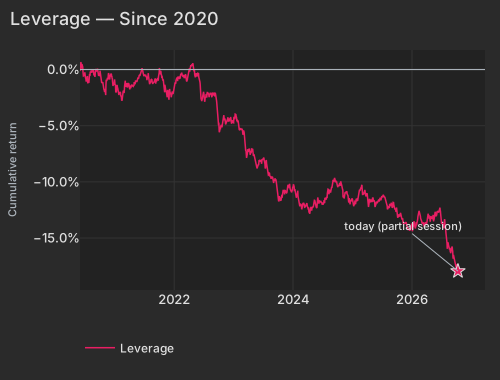
Beta's drop is a five-day event: its 20-day return is still up 0.46% (z=+0.1). Leverage is the longer trend. It fell 0.08% today (z=-0.5) and 4.09% over the 63 days through Tuesday's close (z=-3.1), the 0.7th percentile of all 63-day stretches since 2020. Over those 63 sessions it lost about as much on days Treasury yields fell as on days they rose, so rates alone do not explain the slide. Short-Term Momentum, the 5-day trend factor, rose 0.09% (z=+0.3) and is up 1.38% over 20 sessions (z=+1.0), after falling 5.89% over 60 days (z=-2.7). Its exposures currently run opposite to Beta's (correlation -0.63), so today's gain came from last week's defensive winners extending their lead over last week's high-beta losers. Short Interest rose 0.07% (z=+0.4) as the most heavily shorted names edged ahead, against a 60-day loss of 1.76% (z=-1.7).
| Date | Cumret Pct |
|---|---|
| 2020-06-02 | -0.13 |
| 2020-06-24 | -0.41 |
| 2020-07-17 | -0.63 |
| 2020-08-10 | -0.07 |
| 2020-09-01 | -0.60 |
| 2020-09-24 | -0.57 |
| 2020-10-16 | -1.17 |
| 2020-11-09 | -1.39 |
| 2020-12-02 | -0.80 |
| 2020-12-24 | -1.28 |
| 2021-01-20 | -1.68 |
| 2021-02-11 | -2.64 |
| 2021-03-08 | -0.99 |
| 2021-03-30 | -1.24 |
| 2021-04-22 | -1.48 |
| 2021-05-14 | -0.99 |
| 2021-06-08 | -0.42 |
| 2021-06-30 | -0.59 |
| 2021-07-23 | -0.79 |
| 2021-08-16 | -0.97 |
| 2021-09-08 | -0.79 |
| 2021-09-30 | -0.58 |
| 2021-10-22 | -0.83 |
| 2021-11-15 | -1.87 |
| 2021-12-08 | -2.04 |
| 2021-12-31 | -2.04 |
| 2022-01-25 | -0.62 |
| 2022-02-16 | -0.39 |
| 2022-03-11 | -0.43 |
| 2022-04-04 | -0.06 |
| 2022-04-27 | 0.56 |
| 2022-05-19 | -0.48 |
| 2022-06-13 | -1.89 |
| 2022-07-07 | -2.74 |
| 2022-07-29 | -2.17 |
| 2022-08-22 | -2.41 |
| 2022-09-14 | -2.23 |
| 2022-10-06 | -5.58 |
| 2022-10-28 | -4.30 |
| 2022-11-21 | -4.57 |
| 2022-12-14 | -4.34 |
| 2023-01-09 | -4.34 |
| 2023-02-01 | -4.73 |
| 2023-02-24 | -5.33 |
| 2023-03-20 | -7.17 |
| 2023-04-12 | -7.21 |
| 2023-05-04 | -7.70 |
| 2023-05-26 | -8.80 |
| 2023-06-21 | -8.04 |
| 2023-07-14 | -8.42 |
| 2023-08-07 | -9.39 |
| 2023-08-29 | -9.53 |
| 2023-09-21 | -9.95 |
| 2023-10-13 | -11.48 |
| 2023-11-06 | -10.85 |
| 2023-11-29 | -10.75 |
| 2023-12-21 | -10.74 |
| 2024-01-17 | -10.84 |
| 2024-02-08 | -11.92 |
| 2024-03-04 | -12.06 |
| 2024-03-26 | -12.06 |
| 2024-04-18 | -12.52 |
| 2024-05-10 | -11.78 |
| 2024-06-04 | -11.39 |
| 2024-06-27 | -11.85 |
| 2024-07-22 | -11.58 |
| 2024-08-13 | -10.96 |
| 2024-09-05 | -9.82 |
| 2024-09-27 | -9.97 |
| 2024-10-21 | -10.36 |
| 2024-11-12 | -11.46 |
| 2024-12-05 | -11.11 |
| 2024-12-30 | -11.57 |
| 2025-01-24 | -11.67 |
| 2025-02-18 | -10.72 |
| 2025-03-12 | -11.08 |
| 2025-04-03 | -11.02 |
| 2025-04-28 | -11.58 |
| 2025-05-20 | -11.82 |
| 2025-06-12 | -11.60 |
| 2025-07-08 | -11.28 |
| 2025-07-30 | -11.77 |
| 2025-08-21 | -12.14 |
| 2025-09-15 | -12.03 |
| 2025-10-07 | -12.79 |
| 2025-10-29 | -13.04 |
| 2025-11-20 | -13.64 |
| 2025-12-15 | -14.20 |
| 2026-01-08 | -14.20 |
| 2026-02-02 | -13.87 |
| 2026-02-25 | -13.06 |
| 2026-03-19 | -13.65 |
| 2026-04-13 | -12.98 |
| 2026-05-05 | -13.23 |
| 2026-05-28 | -12.73 |
| 2026-06-22 | -12.67 |
| 2026-07-15 | -13.88 |
| 2026-08-06 | -15.18 |
| 2026-08-28 | -16.21 |
| 2026-09-22 | -16.77 |
| 2026-10-14 | -17.95 |
Front-month WTI crude rose 1.7% to $95.72 per barrel at 8:45 AM ET CNBC. Saudi Arabia's energy ministry confirmed an overnight attack on a Saudi Aramco building in Dhahran, following Houthi strikes on Riyadh, and the International Energy Agency warned that supply buffers are tightening CNBC. Spot gold fell 1.3% to $4,102.77 per ounce at 8:55 AM ET CNBC as higher yields and a firmer dollar weighed on non-yielding metals WSJ, and by early trading the gold fund GLD was down 1.8%. Defense funds extended a weak quarter. Over the 63 days through Tuesday, iShares U.S. Aerospace & Defense (ITA) fell 13.6% and SPDR S&P Aerospace & Defense (XAR) 16.3%, returns in the bottom 5% of all 63-day windows since 2018. The two funds sit 19.6% and 24.9% below the peaks they set on August 14.
| ETF | Theme | Today | 1d Ago | 5d Ago | 20d Ago | 63d Ago |
|---|---|---|---|---|---|---|
| XLE | Energy | +0.7% | +1.8% | +5.4% | +2.6% | +19.7% |
| USO | Oil | +0.7% | +1.4% | +5.6% | -5.4% | +26.1% |
| XLP | Consumer Staples | +0.6% | -0.3% | +2.9% | +1.2% | +1.5% |
| ITA | Defense | -0.6% | -1.0% | -2.1% | -4.7% | -13.6% |
| TLT | Long-Term Bonds | -0.8% | +0.4% | +1.4% | -2.5% | -5.9% |
| XLF | Financials | -0.9% | -0.4% | +1.5% | -3.2% | -2.7% |
| SMH | Semiconductors | -1.8% | -0.5% | -7.0% | +8.5% | -0.5% |
| GLD | Gold | -1.8% | -0.1% | -0.2% | -3.2% | +2.5% |
| DRAM | Memory Chips & Storage | -3.3% | -3.4% | -11.2% | -3.9% | -7.9% |
| SLV | Silver | -3.7% | -1.6% | -3.5% | -7.0% | +2.5% |
| WGMI | Crypto Miners | -3.9% | -3.1% | -15.7% | -12.1% | -28.6% |
| T | Ita | Xar | Xli | Nlr |
|---|---|---|---|---|
| 2026-09-15 | -1.16 | -0.54 | -0.64 | -1.05 |
| 2026-09-16 | -0.58 | -0.22 | -0.72 | -1.93 |
| 2026-09-17 | -1.22 | -0.62 | -0.54 | 1.00 |
| 2026-09-18 | -1.24 | -1.22 | -0.11 | -1.63 |
| 2026-09-21 | -0.17 | 0.35 | 0.30 | 1.15 |
| 2026-09-22 | -1.16 | -0.49 | 0.47 | 2.27 |
| 2026-09-23 | -1.20 | -1.37 | 0.37 | -1.04 |
| 2026-09-24 | -1.73 | -1.34 | -0.38 | -2.97 |
| 2026-09-25 | -1.25 | -1.34 | 0.56 | -3.37 |
| 2026-09-28 | -3.35 | -3.51 | -0.41 | -5.02 |
| 2026-09-29 | -3.33 | -3.93 | -0.20 | -4.87 |
| 2026-09-30 | -4.31 | -4.72 | -1.47 | -5.49 |
| 2026-10-01 | -3.91 | -4.57 | -0.49 | -6.14 |
| 2026-10-02 | -4.03 | -3.96 | 0.28 | -6.15 |
| 2026-10-05 | -4.40 | -4.71 | 0.37 | -5.24 |
| 2026-10-06 | -3.81 | -3.74 | 1.24 | -0.04 |
| 2026-10-07 | -5.97 | -6.62 | -0.97 | -3.84 |
| 2026-10-08 | -5.37 | -6.53 | -0.64 | -6.48 |
| 2026-10-09 | -4.56 | -5.91 | -0.13 | -5.59 |
| 2026-10-12 | -4.84 | -7.05 | -0.19 | -8.47 |
| 2026-10-13 | -5.78 | -8.17 | -0.48 | -9.22 |
| 2026-10-14 | -6.13 | -8.17 | -0.90 | -9.86 |
Financial stocks fell 0.6% as banks and insurers reported third-quarter results. Bank of America (BAC) dropped 6.6%, erasing $24.5B of market value, after third-quarter profit fell 17% to $0.91 a share against a $1.10 consensus estimate CNBC. A $1.2 billion penalty from the OCC and FinCEN over anti-money-laundering and sanctions violations weighed on the results. The larger concern is that regulators said the bank had failed to fix problems flagged under a 2024 cease-and-desist order. Fixed-income trading revenue fell 17% to $2.55 billion, more than offsetting a 10% gain in equities trading to $2.51 billion, while net interest income rose 7.9% to $16.6 billion Bloomberg CNBC. Morgan Stanley (MS) beat third-quarter expectations, with equities trading revenue $909 million above estimates according to CNBC Bloomberg, but its shares slipped 2.6%. Among other early reporters, State Street (STT) fell 8.3%, Fastenal (FAST) 6.3% and Progressive (PGR) 5.5%, while BlackRock (BLK) rose 1.7%.
Liquidia (LQDA) rose 37.4%, the day's largest stock-specific gain. According to GlobeNewswire, the company reached a $380.7 million global settlement with United Therapeutics that resolves six patent and trade-secret lawsuits and secures continued sales of Yutrepia, its inhaled treatment for pulmonary arterial hypertension. It also reported preliminary third-quarter net product sales of $222.7 million. In real estate, Curbline Properties (CURB) rose 10.2%, and defense contractor Elbit Systems (ESLT) rose 7.0%; both moves were almost entirely stock-specific.
The Consumer Price Index, released at 8:30 AM ET, showed headline inflation rising 0.6% month-over-month and 3.7% year-over-year in September, topping the 3.6% annual consensus as gasoline prices surged 9.1% and shelter rose 0.4% BLS. Core CPI rose 0.3% on the month and 2.6% year-over-year, ahead of the Fed's October 27–28 meeting federalreserve.gov BLS.
Variance decomposition: live intraday — 20261014 session, bracketed against its trailing-year range. Factor returns are trailing through last close. Total cross-sectional dispersion: 2.0%ile of the past year.
Variance mix — % of total, today vs 1d ago vs 1-yr avg
market 73%ile style 81%ile thematic 17%ile idiosyncratic 24%ile
Variance explained — today vs. factor's trailing-year range
Marker = the factor's share of today's total variance, placed in its own trailing-year range (box 25–75%ile, ticks 90%ile and max). Amber marker = unusually load-bearing today (≥90%ile of its own year). Factor name green = up today / red = down.
Correlation & dispersion — realized vs implied
Pairwise realized correlation (20d): 9.37% 7.1%ile since 2020 · 82%ile 3m
Top-500 pairwise: 13.93% 20%ile since 2020 · 100.0%ile 3m · implied (Cboe COR1M): 7.57 1.2%ile of its own history (gap +6.4pp)
Realized 20d vol (ann. pts): all stocks 35 vs VIXEQ 40 · index 9 vs VIX 15 · style factors 16 46%ile
20-day window (19 completed days + today); percentiles vs model history since 2020; '3m' tokens rank vs the trailing 63 trading days; definitions in Terms below. Implied prints (Cboe) are delayed ~15 min. as of 08:41 ET
Top 50 high-beta momentum names (eq-wt, since-2020 rank): -2.0% 20%ile · rest of market -0.1%
| Factor | Today | 1d | 5d | 20d | 60d |
|---|---|---|---|---|---|
| Style-Risk | |||||
| Beta | -0.87% z-0.9 | -0.54% | -4.68% | +0.46% | -2.21% |
| International | +0.03% z+0.1 | +0.14% | +0.20% | -0.26% | +0.54% |
| Residual Volatility | -0.03% z-0.1 | -0.13% | -0.12% | +0.65% | +4.04% |
| Style | |||||
| Leverage | -0.08% z-0.5 | +0.05% | -0.55% | -1.35% | -3.98% |
| Profitability | +0.07% z+0.4 | +0.28% | +0.36% | +1.40% | -0.45% |
| Liquidity | -0.07% z-0.3 | +0.10% | -0.59% | -0.49% | +1.46% |
| Size | +0.07% z+0.2 | +0.06% | +0.25% | +2.63% | +3.90% |
| Dividend Yield | -0.02% z-0.1 | -0.01% | -0.19% | -0.66% | -1.02% |
| Growth | +0.03% z+0.1 | +0.08% | +0.10% | +0.99% | +1.74% |
| Value | -0.02% z-0.1 | +0.51% | +0.46% | +0.48% | +0.92% |
| Style-Momentum | |||||
| Short-Term Momentum | +0.09% z+0.3 | -0.08% | +0.39% | +1.38% | -5.89% |
| One-Day Momentum | +0.03% z+0.1 | +0.20% | +0.29% | -0.59% | -1.29% |
| Medium-Term Momentum | -0.02% z-0.1 | +0.21% | +0.57% | +0.28% | +1.26% |
| Long-Term Momentum | -0.01% z-0.0 | +0.03% | -0.33% | +1.47% | -1.76% |
| Style-Positioning | |||||
| Short Interest | +0.07% z+0.4 | -0.06% | +0.09% | -0.75% | -1.76% |
| Hedge-Fund Ownership | +0.02% z+0.2 | -0.06% | +0.08% | +0.00% | -0.39% |
| Style-Flow | |||||
| Morning Activity | +0.00% z+0.0 | -0.06% | -0.04% | -0.91% | +1.33% |
| Short-Sale Activity | +0.00% z+0.0 | +0.14% | +0.07% | -0.21% | +0.96% |
| Thematic | |||||
| Gold | -0.15% z-0.5 | -0.30% | -0.01% | -1.31% | +2.53% |
| Semiconductors | -0.20% z-0.3 | -0.11% | -1.92% | -0.50% | -4.56% |
| China | +0.11% z+0.3 | -0.22% | -0.20% | +0.18% | +0.77% |
| Oil | +0.07% z+0.1 | +0.37% | +0.54% | +1.28% | +4.99% |
| Treasury (Duration) | -0.03% z-0.1 | -0.13% | +0.06% | -1.79% | -3.18% |
| Bitcoin / Crypto | -0.01% z-0.1 | -0.09% | +0.27% | -0.26% | +1.81% |
5/20/60d windows include today's session; 1d is the previous session.
Factor z-score. Today's factor return divided by its daily-return standard deviation over ~1,600 trading days.
Dispersion (realized). Total cross-sectional volatility net of the market component; high dispersion is the flip side of low correlation.
Stock-specific (idiosyncratic) return. The part of a stock's move not explained by market, style, or thematic factors in our decomposition.
Data compiled by FactorPulse AI; edited and verified by Jeff Klein. For informational purposes only. Does not constitute financial advice, an investment recommendation, or an offer to buy or sell any securities. Always consult a qualified financial professional before making investment decisions.
For more on factor construction methodology, see www.factorpulse.com/glossary.