Chinese memory maker CXMT's plan to ship a denser, server-grade memory chip by the end of 2026 set off a "Black Tuesday" in Seoul. CXMT President Cao Kanyu said the company had made "key progress" on a design that shrinks each memory cell by about a third. South Korean memory maker SK hynix fell 10% and Samsung Electronics dropped more than 7%. The Kospi closed down about 5.5% after a five-minute halt on program trading. Broadcom CEO Hock Tan added to the gloom by likening many AI investors to casino gamblers. Japan's Nikkei slid 2.6% and Taiwan's benchmark lost 2%.
Before the opening bell in New York, SK hynix's U.S. shares were down nearly 7%, erasing about $73 billion in market value, and more than half of that drop was specific to the company itself. Chipmaker Micron fell about 5%, wiping out roughly $56 billion, but nearly all of its slide tracks a week-long selloff in high-flying, high-beta chip stocks rather than a judgment about the CXMT threat. The memory-chip fund DRAM and the Korea fund EWY are each down more than 11% over five sessions, while the broad S&P 500 is roughly flat. Research firm SemiAnalysis noted that CXMT's production costs are still more than 30% above those of established rivals. CXMT also still has to win over server customers and ramp up to volume production.
Bank earnings offered a brighter story. Investment bank Goldman Sachs rose 3.5% after earning about $17 a share versus roughly $13 expected, as stock-trading revenue jumped 72% to about $6.4 billion. Lender Wells Fargo fell nearly 3% after its revenue missed forecasts. JPMorgan edged up 1% despite missing estimates, after it raised its outlook for interest income. Health insurer UnitedHealth climbed 4% on a beat and a higher full-year forecast, while Johnson & Johnson slipped 2% on a $5.5 billion charge tied to talc litigation and acquisitions. In bonds, the ten-year Treasury yield eased to about 5.2%, well below last week's 24-year high near 5.37%, and BlackRock upgraded Treasuries after six years of underweighting them. Defensive stocks absorbed some of the money leaving chips, with Walmart and Coca-Cola each up about 1%.
CXMT President Cao Kanyu said the company has made "key progress" on 4F² DRAM, a layout that shrinks each memory cell by about a third. He said the first product will be a server DDR5 module due by the end of 2026 Bloomberg. Korea JoongAng Daily reported that SK hynix fell -10.09% in Seoul on what it called "Black Tuesday", with Samsung Electronics down -7.39%. The Kospi closed -5.46% after a five-minute halt on program trading, the paper reported. The Economic Times said Broadcom CEO Hock Tan's comparison of many AI investors to casino gamblers added to the pressure. Japan's Nikkei fell -2.6% and Taiwan's benchmark -2% Economic Times.
In New York, SK hynix's U.S. shares (SKHY) are down -6.57%, erasing $72.8B of market value. Micron (MU) is down -5.18%, erasing $55.7B, and ASML is off -2.78%. The Roundhill Memory ETF (DRAM) and the Korea ETF (EWY) are now down more than 11% over five sessions. The S&P 500 ETF is roughly flat.
| ETF | Theme | Today | 1d Ago | 5d Ago | 20d Ago | 63d Ago |
|---|---|---|---|---|---|---|
| DRAM | memory chips & storage | -5.78% | -4.32% | -11.27% | -0.15% | -10.63% |
| EWY | south korea | -4.02% | -4.02% | -11.15% | -3.47% | -3.88% |
| SMH | semiconductors | -2.01% | -2.05% | -6.77% | +9.14% | -1.55% |
| MTUM | momentum | -1.20% | -1.53% | -2.49% | +5.35% | -1.26% |
| XLK | technology | -1.04% | -1.22% | -2.27% | +6.68% | +7.06% |
| TLT | long-term bonds | +0.52% | +0.09% | +1.22% | -3.17% | -6.07% |
| XLV | healthcare | +0.70% | +0.69% | +2.76% | +2.92% | +9.07% |
| XLRE | real estate | +0.80% | +0.75% | +3.07% | -1.97% | -4.97% |
| XLP | consumer staples | +1.04% | +1.17% | +4.16% | +0.65% | +1.85% |
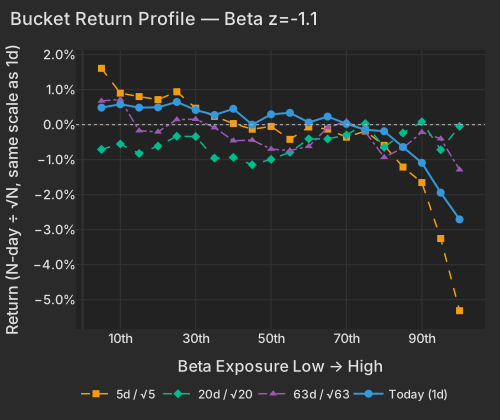
Our factor model attributes most of the move to Beta, which is down -1.06% at z=-1.1. Beta alone accounts for about 41% of the differences in stock returns so far, a top-decile share for the past year. Today makes three down days in five for Beta, and the five-session loss is -5.12% (z=-2.4 on that window). Over the last 20 sessions Beta is still up +1.60%. So far the drop has given back a recent gain rather than broken a long trend. The Semiconductors factor is down -0.55% and has fallen five sessions in a row, losing -2.39% over the stretch.
| Factor | Return | Z-Score | 5d Z | 20d Z | 63d Z | Category | Direction |
|---|---|---|---|---|---|---|---|
| Beta | -1.06% | -1.1 | -2.38 | +0.37 | -0.36 | Style-Risk | Most market-sensitive names lagging |
| Semiconductors | -0.55% | -0.91 | -1.76 | -0.12 | -0.73 | Thematic | Chip exposure lagging |
| Morning Activity | +0.13% | +1.07 | +0.87 | -1.34 | +1.33 | Style-Flow | Names that usually trade heavily in the morning are ahead |
| Medium-Term Momentum | -0.25% | -0.86 | +0.25 | -0.44 | +0.11 | Style-Momentum | Past month's winners giving back |
| Long-Term Momentum | -0.42% | -0.66 | -0.4 | +0.4 | -0.2 | Style-Momentum | 12-month winners lagging |
| Hedge-Fund Ownership | +0.09% | +0.78 | +1.50 | +0.06 | -0.63 | Style-Positioning | Hedge-fund-owned names slightly ahead |
| Short Interest | -0.06% | -0.34 | +0.45 | -1.25 | -1.49 | Style-Positioning | Most-shorted names lagging |
| Bucket | Ret 1D Pct | Ret 5D Norm Pct | Ret 20D Norm Pct | Ret 63D Norm Pct |
|---|---|---|---|---|
| 1 | 0.49 | 1.61 | -0.71 | 0.68 |
| 2 | 0.58 | 0.90 | -0.55 | 0.72 |
| 3 | 0.49 | 0.80 | -0.82 | -0.17 |
| 4 | 0.49 | 0.72 | -0.61 | -0.21 |
| 5 | 0.65 | 0.94 | -0.33 | 0.15 |
| 6 | 0.42 | 0.47 | -0.34 | 0.15 |
| 7 | 0.28 | 0.24 | -0.96 | -0.08 |
| 8 | 0.45 | 0.03 | -0.93 | -0.46 |
| 9 | -0.00 | -0.13 | -1.15 | -0.44 |
| 10 | 0.29 | -0.05 | -0.99 | -0.70 |
| 11 | 0.34 | -0.42 | -0.79 | -0.74 |
| 12 | 0.06 | -0.07 | -0.41 | -0.62 |
| 13 | 0.23 | -0.13 | -0.41 | -0.09 |
| 14 | 0.02 | -0.36 | -0.30 | 0.09 |
| 15 | -0.14 | -0.18 | 0.03 | -0.21 |
| 16 | -0.19 | -0.59 | -0.65 | -0.93 |
| 17 | -0.64 | -1.21 | -0.24 | -0.67 |
| 18 | -1.09 | -1.65 | 0.08 | -0.22 |
| 19 | -1.94 | -3.25 | -0.72 | -0.40 |
| 20 | -2.71 | -5.31 | -0.05 | -1.29 |
20-day momentum (Medium-Term Momentum in the table) is down -0.25% as last month's winners give some back. Its exposures overlap heavily with the high-beta momentum stocks, so it reflects the same selling rather than a separate signal. The top 50 high-beta momentum names are down -2.61% while the rest of the market is up +0.40%. That is milder than their since-2020 extremes on October 8 and 12. The losses have built steadily through the pre-market rather than arriving as a single gap at the start.
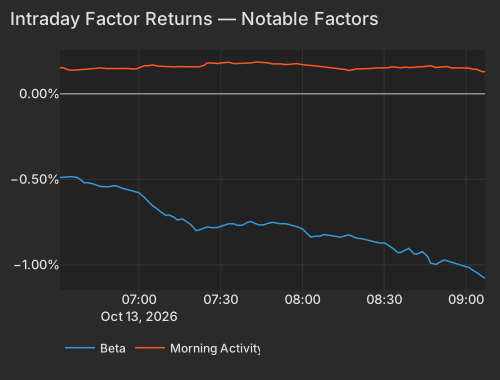
| Time | Beta | Morning Activity |
|---|---|---|
| 2026-10-13T06:31:01 | -0.49 | 0.15 |
| 2026-10-13T06:32:01 | -0.49 | 0.15 |
| 2026-10-13T06:34:01 | -0.48 | 0.14 |
| 2026-10-13T06:35:01 | -0.48 | 0.14 |
| 2026-10-13T06:37:01 | -0.49 | 0.14 |
| 2026-10-13T06:38:01 | -0.50 | 0.14 |
| 2026-10-13T06:40:01 | -0.52 | 0.15 |
| 2026-10-13T06:41:01 | -0.52 | 0.15 |
| 2026-10-13T06:43:01 | -0.53 | 0.15 |
| 2026-10-13T06:45:01 | -0.54 | 0.15 |
| 2026-10-13T06:46:01 | -0.54 | 0.15 |
| 2026-10-13T06:48:01 | -0.54 | 0.15 |
| 2026-10-13T06:49:01 | -0.54 | 0.15 |
| 2026-10-13T06:51:01 | -0.54 | 0.15 |
| 2026-10-13T06:52:01 | -0.54 | 0.15 |
| 2026-10-13T06:54:01 | -0.55 | 0.15 |
| 2026-10-13T06:56:01 | -0.56 | 0.15 |
| 2026-10-13T06:57:01 | -0.57 | 0.15 |
| 2026-10-13T06:59:01 | -0.58 | 0.15 |
| 2026-10-13T07:00:01 | -0.58 | 0.15 |
| 2026-10-13T07:02:01 | -0.61 | 0.16 |
| 2026-10-13T07:03:01 | -0.62 | 0.16 |
| 2026-10-13T07:05:01 | -0.66 | 0.17 |
| 2026-10-13T07:07:01 | -0.68 | 0.16 |
| 2026-10-13T07:08:01 | -0.69 | 0.16 |
| 2026-10-13T07:10:01 | -0.71 | 0.16 |
| 2026-10-13T07:11:01 | -0.71 | 0.16 |
| 2026-10-13T07:13:01 | -0.72 | 0.16 |
| 2026-10-13T07:14:01 | -0.74 | 0.16 |
| 2026-10-13T07:16:01 | -0.73 | 0.16 |
| 2026-10-13T07:18:01 | -0.75 | 0.16 |
| 2026-10-13T07:19:01 | -0.76 | 0.16 |
| 2026-10-13T07:21:01 | -0.80 | 0.15 |
| 2026-10-13T07:22:01 | -0.80 | 0.16 |
| 2026-10-13T07:24:01 | -0.78 | 0.17 |
| 2026-10-13T07:25:01 | -0.78 | 0.18 |
| 2026-10-13T07:27:01 | -0.78 | 0.18 |
| 2026-10-13T07:29:01 | -0.78 | 0.18 |
| 2026-10-13T07:30:01 | -0.78 | 0.18 |
| 2026-10-13T07:32:01 | -0.77 | 0.18 |
| 2026-10-13T07:33:01 | -0.76 | 0.18 |
| 2026-10-13T07:35:01 | -0.76 | 0.18 |
| 2026-10-13T07:36:01 | -0.77 | 0.18 |
| 2026-10-13T07:38:01 | -0.77 | 0.18 |
| 2026-10-13T07:40:02 | -0.75 | 0.18 |
| 2026-10-13T07:41:01 | -0.75 | 0.18 |
| 2026-10-13T07:43:01 | -0.76 | 0.19 |
| 2026-10-13T07:44:01 | -0.77 | 0.18 |
| 2026-10-13T07:46:01 | -0.77 | 0.18 |
| 2026-10-13T07:47:01 | -0.76 | 0.18 |
| 2026-10-13T07:49:01 | -0.75 | 0.18 |
| 2026-10-13T07:51:01 | -0.76 | 0.18 |
| 2026-10-13T07:52:01 | -0.76 | 0.17 |
| 2026-10-13T07:54:01 | -0.76 | 0.17 |
| 2026-10-13T07:55:01 | -0.76 | 0.17 |
| 2026-10-13T07:57:01 | -0.77 | 0.18 |
| 2026-10-13T07:58:01 | -0.78 | 0.18 |
| 2026-10-13T08:00:01 | -0.79 | 0.17 |
| 2026-10-13T08:02:01 | -0.82 | 0.17 |
| 2026-10-13T08:03:01 | -0.84 | 0.17 |
| 2026-10-13T08:05:01 | -0.83 | 0.16 |
| 2026-10-13T08:06:01 | -0.83 | 0.16 |
| 2026-10-13T08:08:01 | -0.82 | 0.16 |
| 2026-10-13T08:09:01 | -0.83 | 0.16 |
| 2026-10-13T08:11:01 | -0.83 | 0.15 |
| 2026-10-13T08:13:01 | -0.84 | 0.15 |
| 2026-10-13T08:14:01 | -0.84 | 0.14 |
| 2026-10-13T08:16:01 | -0.83 | 0.14 |
| 2026-10-13T08:17:01 | -0.82 | 0.14 |
| 2026-10-13T08:19:01 | -0.84 | 0.14 |
| 2026-10-13T08:20:01 | -0.84 | 0.15 |
| 2026-10-13T08:22:01 | -0.85 | 0.15 |
| 2026-10-13T08:24:01 | -0.86 | 0.14 |
| 2026-10-13T08:25:01 | -0.86 | 0.15 |
| 2026-10-13T08:27:01 | -0.87 | 0.15 |
| 2026-10-13T08:28:01 | -0.87 | 0.15 |
| 2026-10-13T08:30:01 | -0.87 | 0.15 |
| 2026-10-13T08:31:01 | -0.88 | 0.15 |
| 2026-10-13T08:33:01 | -0.90 | 0.16 |
| 2026-10-13T08:35:01 | -0.93 | 0.15 |
| 2026-10-13T08:36:01 | -0.93 | 0.15 |
| 2026-10-13T08:38:01 | -0.91 | 0.16 |
| 2026-10-13T08:39:01 | -0.90 | 0.15 |
| 2026-10-13T08:41:01 | -0.94 | 0.15 |
| 2026-10-13T08:42:01 | -0.94 | 0.16 |
| 2026-10-13T08:44:01 | -0.92 | 0.16 |
| 2026-10-13T08:46:01 | -0.95 | 0.16 |
| 2026-10-13T08:47:01 | -0.99 | 0.16 |
| 2026-10-13T08:49:01 | -1.00 | 0.15 |
| 2026-10-13T08:50:02 | -0.99 | 0.16 |
| 2026-10-13T08:52:01 | -0.97 | 0.16 |
| 2026-10-13T08:53:01 | -0.98 | 0.16 |
| 2026-10-13T08:55:01 | -0.99 | 0.15 |
| 2026-10-13T08:57:01 | -1.00 | 0.15 |
| 2026-10-13T08:58:01 | -1.00 | 0.15 |
| 2026-10-13T09:00:01 | -1.01 | 0.15 |
| 2026-10-13T09:01:01 | -1.01 | 0.15 |
| 2026-10-13T09:03:01 | -1.04 | 0.14 |
| 2026-10-13T09:04:01 | -1.05 | 0.14 |
| 2026-10-13T09:06:01 | -1.07 | 0.13 |
| 2026-10-13T09:07:01 | -1.08 | 0.13 |
Micron's -5.18% breaks down into -4.04% from its style exposures and just -0.81% that is specific to the company. That is how a high-beta stock with strong 12-month gains trades when that whole group is being sold. SK hynix's U.S. shares show the opposite split: -3.47% of the -6.57% is the stock's own move. That company-specific piece is where the market is pricing CXMT as a direct threat to the Korean DRAM incumbents.
Sandisk (SNDK) is down -4.73%, but its company-specific component is slightly positive, so the factor exposures explain more than the whole drop. MaxLinear (MXL) -4.23%, Astera Labs (ALAB) -3.33% and Wolfspeed (WOLF) -3.64% show the same split. In the U.S., investors are selling exposure; they are not yet marking down American memory-chip profits on CXMT's news. SemiAnalysis cautioned that CXMT's DDR5 production costs per bit are still more than 30% above incumbents'. That leaves qualifying with server customers and reaching volume production as the hurdles CXMT still has to clear.
Hedge-fund-owned stocks are slightly ahead (+0.09%, z=+0.78) and flat on a raw basis. Neither measure points to hedge funds as the sellers. Implied index volatility (Cboe VIX) is 15.29, while implied single-stock volatility (Cboe VIXEQ) is 39.08, in the 83.6th percentile of its history. Options are pricing big moves in individual stocks under a quiet index. The open question is whether Micron's company-specific share starts to look like SK hynix's.
Goldman Sachs (GS) is up +3.54%, adding $9.2B, after equities revenue jumped 72% to $6.44B on demand for prime-brokerage financing. Fixed-income trading slipped 1% Bloomberg. Wells Fargo (WFC) is down -2.87%, erasing $7.2B, after revenue of $21.87B missed a $22.3B estimate. Its corporate and investment bank fell short of forecasts. The rest of the morning's reporters:
| Company | Today | Market Value | The Print |
|---|---|---|---|
| UnitedHealth (UNH) | +4.40% | +$14.9B | EPS $4.69 vs $4.12; full-year guide raised to at least $20.50 WSJ |
| JPMorgan (JPM) | +1.02% | +$9.0B | Missed on EPS and revenue; full-year net interest income guide raised to about $106.2B |
| Citigroup (C) | +0.36% | +$0.8B | Reported before the open |
| Johnson & Johnson (JNJ) | -2.11% | -$13.5B | $5.5B talc and M&A charge outweighed a narrow adjusted beat; reportedly leaning toward spinning out hips-and-knees WSJ |
| Domino's Pizza (DPZ) | -5.92% | -$0.6B | Reported before the open; no detail in coverage yet |
Prosperity Bancshares (PB) is up +10.22% without a report, almost all of it company-specific. The market is moving the stock on its own, and the driver hasn't appeared in coverage yet.
The ten-year Treasury yield is 5.202%, down 4.2 bps, while the two-year is up 0.4 bps at 4.795% CNBC. Long bonds are rallying while short-dated yields hold. The ten-year is now well below last week's 24-year peak of 5.365%. BlackRock has upgraded Treasuries after six years of underweighting them FT. WTI crude is $92.59 at 8:58 AM ET, -1.23% on the day CNBC. The dollar index is 102.284 at 9:07 AM ET, -0.30%, a day after its one-year high of 102.61 CNBC.
Interest-rate-sensitive defensive stocks are taking the other side of the chip selling. The consumer staples sector is up +0.83%, led by Walmart (WMT) +1.21% and Coca-Cola (KO) +1.11%. The staples and real-estate rows in the table above have added three to four percent over the week. Dow Jones linked the Treasury rally to markets looking ahead to U.S. inflation data.
Variance decomposition: live intraday — 20261013 session, bracketed against its trailing-year range. Factor returns are trailing through last close. Total cross-sectional dispersion: 2.4%ile of the past year.
Variance mix — % of total, today vs 1d ago vs 1-yr avg
market 14%ile style 98.8%ile thematic 36%ile idiosyncratic 6.0%ile
Variance explained — today vs. factor's trailing-year range
Marker = the factor's share of today's total variance, placed in its own trailing-year range (box 25–75%ile, ticks 90%ile and max). Amber marker = unusually load-bearing today (≥90%ile of its own year). Factor name green = up today / red = down.
Correlation & dispersion — realized vs implied
Pairwise realized correlation (20d): 9.25% 7.0%ile since 2020 · 82%ile 3m
Top-500 pairwise: 13.73% 20%ile since 2020 · 100.0%ile 3m · implied (Cboe COR1M): 7.57 1.2%ile of its own history (gap +6.2pp)
Realized 20d vol (ann. pts): all stocks 36 vs VIXEQ 39 · index 9 vs VIX 15 · style factors 16 48%ile
20-day window (19 completed days + today); percentiles vs model history since 2020; '3m' tokens rank vs the trailing 63 trading days; definitions in Terms below. Implied prints (Cboe) are delayed ~15 min. as of 08:58 ET
Top 50 high-beta momentum names (eq-wt, since-2020 rank): -2.6% 15%ile · rest of market +0.4%
| Factor | Today | 1d | 5d | 20d | 60d |
|---|---|---|---|---|---|
| Style-Risk | |||||
| Beta | -1.06% z-1.1 | -1.65% | -5.12% | +1.60% | +0.65% |
| Residual Volatility | -0.29% z-0.6 | -0.37% | +0.13% | +0.67% | +4.23% |
| International | -0.06% z-0.2 | +0.09% | -0.21% | -0.66% | +0.45% |
| Style | |||||
| Growth | -0.17% z-0.7 | -0.02% | +0.03% | +0.86% | +1.25% |
| Liquidity | -0.15% z-0.6 | -0.08% | -0.51% | -0.81% | +1.99% |
| Value | -0.06% z-0.3 | +0.20% | -0.04% | -0.23% | +0.39% |
| Profitability | -0.04% z-0.2 | +0.04% | -0.03% | +1.17% | -0.83% |
| Dividend Yield | -0.03% z-0.2 | +0.00% | -0.21% | -0.86% | -0.64% |
| Leverage | -0.02% z-0.1 | -0.04% | -0.54% | -1.09% | -3.80% |
| Size | -0.02% z-0.0 | +0.36% | +0.69% | +2.59% | +3.62% |
| Style-Momentum | |||||
| Medium-Term Momentum | -0.25% z-0.9 | +0.08% | +0.16% | -0.56% | -0.01% |
| One-Day Momentum | +0.19% z+0.7 | -0.02% | +0.24% | -0.84% | -1.58% |
| Long-Term Momentum | -0.42% z-0.7 | -0.22% | -0.59% | +1.27% | -0.52% |
| Short-Term Momentum | +0.10% z+0.3 | +0.19% | +0.47% | +1.14% | -6.20% |
| Style-Positioning | |||||
| Hedge-Fund Ownership | +0.09% z+0.8 | +0.01% | +0.37% | +0.03% | -0.39% |
| Short Interest | -0.06% z-0.3 | +0.06% | +0.17% | -0.93% | -2.03% |
| Style-Flow | |||||
| Morning Activity | +0.13% z+1.1 | -0.02% | +0.24% | -0.75% | +1.65% |
| Short-Sale Activity | +0.06% z+0.6 | +0.13% | -0.11% | -0.41% | +0.76% |
| Thematic | |||||
| Semiconductors | -0.55% z-0.9 | -0.46% | -2.39% | -0.32% | -3.38% |
| Gold | +0.18% z+0.6 | +0.02% | +0.36% | -0.81% | +3.38% |
| China | -0.20% z-0.5 | -0.31% | +0.09% | +0.10% | +0.55% |
| Bitcoin / Crypto | -0.13% z-0.4 | +0.12% | +0.38% | -0.59% | +2.13% |
| Oil | -0.19% z-0.4 | +0.02% | -0.08% | -0.14% | +4.80% |
| Treasury (Duration) | +0.08% z+0.3 | -0.15% | +0.35% | -1.63% | -2.79% |
5/20/60d windows include today's session; 1d is the previous session.
Factor z-score. Today's factor return divided by its daily-return standard deviation over ~1,600 trading days.
High-beta momentum cohort. US names above $2B market cap in the top quintile of both raw beta and 12-month momentum; membership frozen at each month's first business day. “Top 50” = the 50 strongest by combined rank.
VIXEQ / DSPX / COR1M. Cboe implied indices: single-stock volatility, dispersion, and 1-month implied correlation (top-50 S&P names). Quotes delayed ~15 minutes.
Data compiled by FactorPulse AI; edited and verified by Jeff Klein. For informational purposes only. Does not constitute financial advice, an investment recommendation, or an offer to buy or sell any securities. Always consult a qualified financial professional before making investment decisions.
For more on factor construction methodology, see www.factorpulse.com/glossary.