A Chinese memory maker's claim that it has caught up with the industry leaders sent Seoul's stock market down 5.5% and pushed U.S. memory stocks lower for a second day. ChangXin Memory Technologies, or CXMT, said it had reached production parity in DDR5 server memory, a market long dominated by Samsung, SK Hynix and Micron. In Seoul, Samsung fell about 7% and SK Hynix about 10%. The KOSPI index closed down 5.5% after a program-trading halt, and the Korea JoongAng Daily called it "Black Tuesday." In New York, memory-chip maker Micron fell about 4% and chip-equipment maker Applied Materials about 7%, together losing roughly $64 billion in market value. Storage makers Seagate and Western Digital also slid, and Broadcom CEO Hock Tan's warning about the risks of AI-infrastructure spending added to the pressure. The selling hit memory and chip-equipment makers hardest: the memory-chip fund DRAM and the South Korea fund EWY are each down about 11% over the past week. The semiconductor fund SMH slipped less than 0.5% and is still up about 9% over the past month, and the high-beta stocks that led Thursday's and Monday's selloffs fell a milder 1%.
Big-bank earnings beats went unrewarded. Citigroup fell nearly 6%, erasing about $12 billion, as investors looked past a better-than-expected quarter to a drop in trading revenue from the prior quarter and bigger reserves for bad loans. JPMorgan slipped less than 1% after its report. Wells Fargo fell about 3%, and Goldman Sachs edged lower even though its stock-trading revenue topped expectations. Outside the banks, Johnson & Johnson fell about 6% after its report, wiping out roughly $36 billion; the company is also leaning toward spinning out its hips-and-knees business. Pizza chain Domino's dropped about 5% after U.S. same-store sales grew just 0.3% against a 0.8% estimate, and health insurer UnitedHealth ended flat despite raising its full-year profit outlook.
Investors also sold the market's most expensive stocks, led by pricey biotechs. The biotech fund XBI fell about 3%, and the healthcare sector dropped almost 2%, giving cheap stocks one of their best days relative to expensive ones since 2020. The large-cap fund SPY ended flat. Treasuries rallied: the 10-year yield eased to about 5.21%, roughly 0.15 percentage points below last week's 24-year high, and the 30-year yield dipped to about 5.56%. BlackRock has raised long-term Treasuries to neutral after six years underweight, the Financial Times reported Tuesday. Oil rose 1% to about $95 a barrel, lifting the oil-and-gas producer fund XOP about 3%.
ChangXin Memory Technologies (CXMT) said it had reached production parity on DDR5 server memory, challenging the hold Samsung, SK Hynix and Micron have on that market. Bloomberg In Seoul, Samsung Electronics fell about 7% and SK Hynix about 10%. Economic Times Korea JoongAng Daily called it "Black Tuesday." The KOSPI closed down 5.5% after a program-trading halt.
In New York, Micron closed down 3.8% and Applied Materials 6.7%, together losing about $64B of market value. Seagate and Western Digital also fell. Broadcom CEO Hock Tan's warning about the risks of AI-infrastructure spending added to the pressure. Economic Times Factor exposures explain almost none of Micron's drop: its style tilts added 0.08%, and 3.4% was specific to the stock. Applied Materials' stock-specific loss of 6.1% was in the top 1% of its daily moves over the past year.
| ETF | Theme | Today | 1d Ago | 5d Ago | 20d Ago | 63d Ago |
|---|---|---|---|---|---|---|
| DRAM | memory chips & storage | -3.4% | -4.3% | -11.3% | -0.2% | -10.6% |
| XBI | biotech | -3.1% | -1.5% | -3.1% | -3.9% | -2.6% |
| EWY | South Korea | -2.1% | -4.0% | -11.2% | -3.5% | -3.9% |
| XLV | healthcare | -1.3% | +0.7% | +2.8% | +2.9% | +9.1% |
| SMH | semiconductors | -0.4% | -2.1% | -6.8% | +9.1% | -1.6% |
| IWD | large/mid-cap value | -0.1% | +0.4% | +1.7% | +0.1% | +3.7% |
| SPY | large cap | -0.01% | -0.1% | +0.4% | +2.5% | +3.8% |
| TLT | long-term Treasuries | +0.4% | +0.1% | +1.2% | -3.2% | -6.1% |
| XOP | oil & gas producers | +2.9% | +1.5% | +3.7% | +0.8% | +17.6% |
The memory-chip and Korea funds have each lost about 11% over the past week. That has wiped out DRAM's gains over the past 20 sessions, over which SMH is still up 9.1%.
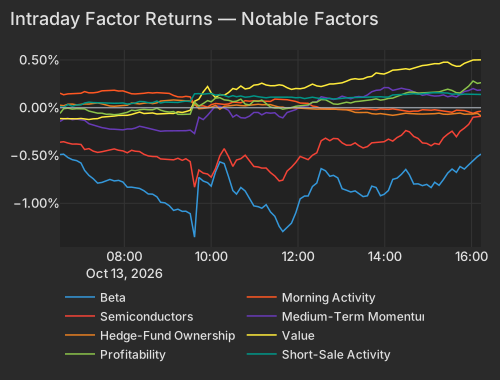
The Semiconductors factor slipped 0.10% at z=-0.2. That was its fifth straight decline, for a five-session loss of 1.94%. Beta fell 0.50% at z=-0.5, after losing 4.56% over five sessions. AI-connectivity names led the highest-beta bucket's 2.6% loss: Astera Labs (ALAB), MaxLinear (MXL) and Applied Optoelectronics (AAOI). The top 50 high-beta momentum names fell 1.3% while the rest of the market rose 0.2%. Today's selling was concentrated in the companies most exposed to CXMT.
| Time | Beta | Morning Activity | Semiconductors | Medium-Term Momentum | Hedge-Fund Ownership | Value | Profitability | Short-Sale Activity |
|---|---|---|---|---|---|---|---|---|
| 2026-10-13T06:31:01 | -0.49 | 0.15 | -0.36 | -0.14 | 0.03 | -0.11 | -0.06 | 0.01 |
| 2026-10-13T06:36:01 | -0.49 | 0.14 | -0.36 | -0.12 | 0.02 | -0.11 | -0.01 | 0.00 |
| 2026-10-13T06:42:01 | -0.52 | 0.15 | -0.37 | -0.11 | 0.04 | -0.12 | -0.00 | 0.03 |
| 2026-10-13T06:48:01 | -0.54 | 0.15 | -0.38 | -0.12 | 0.04 | -0.12 | -0.01 | 0.02 |
| 2026-10-13T06:54:01 | -0.55 | 0.15 | -0.38 | -0.12 | 0.03 | -0.12 | -0.01 | 0.03 |
| 2026-10-13T07:00:01 | -0.58 | 0.15 | -0.38 | -0.12 | 0.04 | -0.11 | -0.01 | 0.03 |
| 2026-10-13T07:05:01 | -0.66 | 0.17 | -0.44 | -0.13 | 0.04 | -0.12 | -0.01 | 0.05 |
| 2026-10-13T07:11:01 | -0.71 | 0.16 | -0.43 | -0.17 | 0.04 | -0.12 | -0.03 | 0.06 |
| 2026-10-13T07:17:01 | -0.74 | 0.16 | -0.45 | -0.18 | 0.04 | -0.12 | -0.05 | 0.05 |
| 2026-10-13T07:23:01 | -0.79 | 0.16 | -0.47 | -0.20 | 0.05 | -0.11 | -0.06 | 0.05 |
| 2026-10-13T07:29:01 | -0.78 | 0.18 | -0.46 | -0.21 | 0.04 | -0.10 | -0.06 | 0.05 |
| 2026-10-13T07:35:01 | -0.76 | 0.18 | -0.45 | -0.22 | 0.03 | -0.10 | -0.07 | 0.04 |
| 2026-10-13T07:40:02 | -0.75 | 0.18 | -0.43 | -0.22 | 0.02 | -0.09 | -0.07 | 0.04 |
| 2026-10-13T07:46:01 | -0.77 | 0.18 | -0.43 | -0.22 | 0.02 | -0.09 | -0.07 | 0.05 |
| 2026-10-13T07:52:01 | -0.76 | 0.17 | -0.44 | -0.23 | 0.02 | -0.08 | -0.07 | 0.05 |
| 2026-10-13T07:58:01 | -0.78 | 0.18 | -0.45 | -0.23 | 0.03 | -0.08 | -0.06 | 0.05 |
| 2026-10-13T08:04:01 | -0.83 | 0.16 | -0.47 | -0.22 | 0.03 | -0.08 | -0.05 | 0.04 |
| 2026-10-13T08:10:01 | -0.83 | 0.15 | -0.45 | -0.22 | 0.05 | -0.07 | -0.03 | 0.04 |
| 2026-10-13T08:15:01 | -0.84 | 0.14 | -0.45 | -0.21 | 0.04 | -0.06 | -0.03 | 0.05 |
| 2026-10-13T08:21:01 | -0.84 | 0.15 | -0.46 | -0.19 | 0.04 | -0.05 | -0.02 | 0.07 |
| 2026-10-13T08:27:01 | -0.87 | 0.15 | -0.49 | -0.20 | 0.05 | -0.06 | -0.02 | 0.06 |
| 2026-10-13T08:33:01 | -0.90 | 0.16 | -0.50 | -0.22 | 0.05 | -0.06 | -0.02 | 0.05 |
| 2026-10-13T08:39:01 | -0.90 | 0.15 | -0.51 | -0.23 | 0.04 | -0.05 | -0.02 | 0.05 |
| 2026-10-13T08:45:01 | -0.93 | 0.16 | -0.51 | -0.24 | 0.05 | -0.07 | -0.01 | 0.07 |
| 2026-10-13T08:50:02 | -0.99 | 0.16 | -0.54 | -0.25 | 0.07 | -0.07 | -0.03 | 0.05 |
| 2026-10-13T08:56:01 | -1.00 | 0.15 | -0.54 | -0.24 | 0.07 | -0.06 | -0.04 | 0.06 |
| 2026-10-13T09:02:01 | -1.02 | 0.15 | -0.54 | -0.24 | 0.08 | -0.06 | -0.04 | 0.06 |
| 2026-10-13T09:08:01 | -1.07 | 0.13 | -0.55 | -0.24 | 0.08 | -0.06 | -0.04 | 0.06 |
| 2026-10-13T09:14:01 | -1.06 | 0.11 | -0.53 | -0.24 | 0.08 | -0.04 | -0.07 | 0.06 |
| 2026-10-13T09:20:01 | -1.08 | 0.11 | -0.55 | -0.24 | 0.08 | -0.05 | -0.07 | 0.06 |
| 2026-10-13T09:25:01 | -1.08 | 0.12 | -0.53 | -0.24 | 0.07 | -0.04 | -0.07 | 0.07 |
| 2026-10-13T09:31:01 | -1.11 | 0.11 | -0.56 | -0.23 | 0.07 | -0.03 | -0.07 | 0.06 |
| 2026-10-13T09:37:01 | -1.35 | 0.03 | -0.83 | -0.27 | 0.04 | 0.07 | 0.06 | 0.15 |
| 2026-10-13T09:43:01 | -0.73 | 0.02 | -0.65 | -0.10 | -0.01 | 0.09 | 0.02 | 0.15 |
| 2026-10-13T09:49:01 | -0.77 | 0.02 | -0.68 | -0.12 | -0.01 | 0.16 | 0.04 | 0.14 |
| 2026-10-13T09:55:01 | -0.78 | 0.01 | -0.69 | -0.08 | 0.00 | 0.22 | 0.07 | 0.15 |
| 2026-10-13T10:00:01 | -0.82 | 0.03 | -0.73 | -0.03 | 0.01 | 0.15 | 0.06 | 0.15 |
| 2026-10-13T10:06:01 | -0.67 | 0.04 | -0.64 | 0.02 | 0.02 | 0.11 | 0.10 | 0.13 |
| 2026-10-13T10:12:01 | -0.57 | 0.04 | -0.50 | 0.01 | -0.02 | 0.14 | 0.11 | 0.14 |
| 2026-10-13T10:18:01 | -0.58 | 0.03 | -0.43 | -0.00 | 0.02 | 0.13 | 0.08 | 0.13 |
| 2026-10-13T10:24:01 | -0.72 | 0.04 | -0.51 | -0.03 | 0.02 | 0.16 | 0.08 | 0.11 |
| 2026-10-13T10:30:01 | -0.87 | 0.06 | -0.61 | -0.10 | 0.02 | 0.20 | 0.06 | 0.13 |
| 2026-10-13T10:35:01 | -0.90 | 0.06 | -0.55 | -0.07 | 0.03 | 0.19 | 0.07 | 0.12 |
| 2026-10-13T10:41:01 | -0.83 | 0.05 | -0.53 | -0.10 | 0.02 | 0.23 | 0.09 | 0.12 |
| 2026-10-13T10:47:01 | -0.87 | 0.07 | -0.50 | -0.11 | 0.02 | 0.20 | 0.04 | 0.11 |
| 2026-10-13T10:53:01 | -0.96 | 0.07 | -0.56 | -0.09 | 0.03 | 0.20 | 0.03 | 0.11 |
| 2026-10-13T10:59:01 | -1.03 | 0.07 | -0.61 | -0.05 | 0.03 | 0.24 | 0.07 | 0.12 |
| 2026-10-13T11:05:01 | -1.04 | 0.07 | -0.62 | -0.05 | 0.04 | 0.24 | 0.07 | 0.12 |
| 2026-10-13T11:10:01 | -1.05 | 0.07 | -0.63 | -0.07 | 0.03 | 0.26 | 0.08 | 0.11 |
| 2026-10-13T11:16:01 | -1.01 | 0.07 | -0.63 | -0.05 | 0.04 | 0.24 | 0.04 | 0.10 |
| 2026-10-13T11:22:01 | -1.09 | 0.07 | -0.68 | -0.06 | 0.03 | 0.23 | 0.01 | 0.11 |
| 2026-10-13T11:28:01 | -1.14 | 0.09 | -0.71 | -0.05 | 0.02 | 0.23 | -0.00 | 0.11 |
| 2026-10-13T11:34:01 | -1.24 | 0.09 | -0.77 | -0.09 | 0.01 | 0.24 | -0.00 | 0.11 |
| 2026-10-13T11:39:01 | -1.30 | 0.09 | -0.76 | -0.11 | 0.01 | 0.23 | -0.02 | 0.11 |
| 2026-10-13T11:45:01 | -1.25 | 0.08 | -0.66 | -0.05 | -0.01 | 0.21 | -0.01 | 0.11 |
| 2026-10-13T11:51:01 | -1.21 | 0.08 | -0.62 | -0.03 | 0.00 | 0.19 | 0.00 | 0.11 |
| 2026-10-13T11:57:01 | -1.10 | 0.07 | -0.57 | -0.02 | -0.00 | 0.20 | 0.02 | 0.10 |
| 2026-10-13T12:03:01 | -0.95 | 0.05 | -0.51 | 0.01 | -0.00 | 0.20 | 0.02 | 0.11 |
| 2026-10-13T12:09:01 | -0.92 | 0.05 | -0.53 | 0.02 | -0.01 | 0.21 | 0.03 | 0.10 |
| 2026-10-13T12:14:01 | -0.92 | 0.05 | -0.54 | 0.02 | -0.01 | 0.22 | 0.03 | 0.10 |
| 2026-10-13T12:20:01 | -0.82 | 0.02 | -0.50 | 0.06 | -0.01 | 0.25 | 0.06 | 0.11 |
| 2026-10-13T12:26:01 | -0.79 | 0.01 | -0.47 | 0.06 | -0.01 | 0.23 | 0.06 | 0.10 |
| 2026-10-13T12:32:01 | -0.64 | -0.01 | -0.35 | 0.11 | -0.01 | 0.22 | 0.09 | 0.09 |
| 2026-10-13T12:38:01 | -0.66 | -0.01 | -0.32 | 0.11 | -0.01 | 0.23 | 0.08 | 0.09 |
| 2026-10-13T12:44:01 | -0.72 | -0.01 | -0.34 | 0.10 | -0.02 | 0.25 | 0.06 | 0.10 |
| 2026-10-13T12:49:01 | -0.71 | -0.01 | -0.32 | 0.09 | -0.01 | 0.25 | 0.04 | 0.09 |
| 2026-10-13T12:55:01 | -0.73 | -0.02 | -0.32 | 0.10 | -0.02 | 0.26 | 0.04 | 0.09 |
| 2026-10-13T13:01:01 | -0.85 | -0.02 | -0.37 | 0.12 | -0.02 | 0.26 | 0.05 | 0.10 |
| 2026-10-13T13:07:02 | -0.86 | -0.02 | -0.39 | 0.11 | -0.02 | 0.28 | 0.06 | 0.10 |
| 2026-10-13T13:13:01 | -0.88 | -0.02 | -0.39 | 0.09 | -0.03 | 0.30 | 0.05 | 0.11 |
| 2026-10-13T13:19:01 | -0.87 | -0.01 | -0.37 | 0.11 | -0.05 | 0.30 | 0.06 | 0.11 |
| 2026-10-13T13:24:01 | -0.89 | -0.02 | -0.40 | 0.12 | -0.05 | 0.30 | 0.07 | 0.11 |
| 2026-10-13T13:30:01 | -0.93 | -0.01 | -0.42 | 0.11 | -0.05 | 0.30 | 0.07 | 0.11 |
| 2026-10-13T13:36:01 | -0.92 | -0.01 | -0.41 | 0.13 | -0.05 | 0.32 | 0.07 | 0.11 |
| 2026-10-13T13:42:02 | -0.82 | -0.01 | -0.37 | 0.17 | -0.06 | 0.33 | 0.08 | 0.11 |
| 2026-10-13T13:48:01 | -0.83 | -0.02 | -0.36 | 0.18 | -0.07 | 0.36 | 0.09 | 0.12 |
| 2026-10-13T13:54:01 | -0.92 | -0.01 | -0.37 | 0.19 | -0.06 | 0.36 | 0.08 | 0.11 |
| 2026-10-13T13:59:02 | -0.91 | -0.02 | -0.36 | 0.21 | -0.07 | 0.35 | 0.08 | 0.11 |
| 2026-10-13T14:05:01 | -0.87 | -0.02 | -0.33 | 0.21 | -0.07 | 0.37 | 0.10 | 0.11 |
| 2026-10-13T14:11:01 | -0.75 | -0.01 | -0.35 | 0.18 | -0.08 | 0.39 | 0.10 | 0.13 |
| 2026-10-13T14:17:01 | -0.74 | -0.02 | -0.31 | 0.19 | -0.07 | 0.40 | 0.12 | 0.14 |
| 2026-10-13T14:23:01 | -0.70 | -0.02 | -0.29 | 0.20 | -0.07 | 0.40 | 0.14 | 0.14 |
| 2026-10-13T14:29:01 | -0.65 | -0.03 | -0.24 | 0.19 | -0.06 | 0.41 | 0.15 | 0.14 |
| 2026-10-13T14:34:01 | -0.70 | -0.04 | -0.25 | 0.19 | -0.06 | 0.40 | 0.16 | 0.14 |
| 2026-10-13T14:40:01 | -0.80 | -0.03 | -0.30 | 0.17 | -0.06 | 0.41 | 0.16 | 0.15 |
| 2026-10-13T14:46:01 | -0.80 | -0.04 | -0.32 | 0.15 | -0.07 | 0.43 | 0.15 | 0.14 |
| 2026-10-13T14:52:01 | -0.81 | -0.02 | -0.37 | 0.13 | -0.07 | 0.44 | 0.15 | 0.15 |
| 2026-10-13T14:58:01 | -0.80 | -0.03 | -0.37 | 0.14 | -0.07 | 0.45 | 0.15 | 0.15 |
| 2026-10-13T15:04:01 | -0.84 | -0.03 | -0.40 | 0.13 | -0.06 | 0.46 | 0.15 | 0.16 |
| 2026-10-13T15:09:01 | -0.78 | -0.02 | -0.37 | 0.12 | -0.06 | 0.46 | 0.16 | 0.16 |
| 2026-10-13T15:15:02 | -0.81 | -0.03 | -0.38 | 0.12 | -0.06 | 0.46 | 0.17 | 0.16 |
| 2026-10-13T15:21:01 | -0.75 | -0.03 | -0.31 | 0.13 | -0.07 | 0.48 | 0.18 | 0.16 |
| 2026-10-13T15:27:01 | -0.68 | -0.04 | -0.28 | 0.12 | -0.07 | 0.48 | 0.19 | 0.15 |
| 2026-10-13T15:33:01 | -0.64 | -0.05 | -0.25 | 0.12 | -0.06 | 0.45 | 0.18 | 0.14 |
| 2026-10-13T15:39:01 | -0.68 | -0.03 | -0.30 | 0.11 | -0.05 | 0.43 | 0.16 | 0.14 |
| 2026-10-13T15:44:01 | -0.61 | -0.02 | -0.25 | 0.14 | -0.06 | 0.43 | 0.15 | 0.14 |
| 2026-10-13T15:50:01 | -0.64 | -0.03 | -0.21 | 0.17 | -0.07 | 0.46 | 0.19 | 0.14 |
| 2026-10-13T15:56:01 | -0.60 | -0.04 | -0.17 | 0.18 | -0.07 | 0.48 | 0.23 | 0.14 |
| 2026-10-13T16:02:01 | -0.55 | -0.06 | -0.10 | 0.20 | -0.07 | 0.50 | 0.28 | 0.14 |
| 2026-10-13T16:08:01 | -0.51 | -0.04 | -0.09 | 0.18 | -0.06 | 0.50 | 0.25 | 0.14 |
| 2026-10-13T16:13:01 | -0.48 | -0.04 | -0.09 | 0.19 | -0.09 | 0.50 | 0.26 | 0.14 |
| Factor | Return | Z-Score | 5d Z | 20d Z | 63d Z | Category | Direction |
|---|---|---|---|---|---|---|---|
| Value | +0.50% | +2.1 | +1.0 | +0.3 | +0.6 | Style | Cheap beat expensive |
| Profitability | +0.26% | +1.4 | +0.7 | +1.7 | -0.2 | Style | Profitable beat unprofitable |
| Short-Sale Activity | +0.14% | +1.3 | -0.1 | -0.7 | +1.1 | Flow | Yesterday's heavily short-sold names outperformed |
| Short-Term Momentum | -0.11% | -0.4 | +0.4 | +0.7 | -2.7 | Momentum | Last week's losers beat its winners |
| Hedge-Fund Ownership | -0.07% | -0.6 | +0.9 | -0.3 | -0.8 | Positioning | Hedge-fund-heavy names lagged |
| Short Interest | -0.07% | -0.4 | +0.4 | -1.3 | -1.5 | Positioning | Most-shorted names lagged |
| Beta | -0.50% | -0.5 | -2.1 | +0.5 | -0.3 | Risk | High-beta names lagged |
| Oil | +0.35% | +0.7 | +0.4 | +0.2 | +1.5 | Thematic | Oil-sensitive names led |
| Semiconductors | -0.10% | -0.2 | -1.4 | +0.0 | -0.6 | Thematic | Chip names lagged slightly |
Value gained 0.50% at z=+2.1, a return in the 97.9th percentile since 2020. Its share of the day's variance was its largest in the past year. The gain came from the expensive end of the market, where the priciest bucket fell 2.1%. Rhythm Pharmaceuticals (RYTM), Ascendis Pharma (ASND) and Scholar Rock (SRRK) led that decline. Profitability rose 0.26% at z=+1.4 as the least profitable bucket fell 2.0%, led by Insmed (INSM), Madrigal (MDGL) and Axsome (AXSM).
Ionis (IONS) fell 3.0% and Inhibrx (INBX) 3.7%, almost entirely through their factor exposures rather than company news. The healthcare sector fell 1.8%. IWD, the large-cap value fund, slipped 0.1%: the gain came from expensive stocks falling. So far it is a one-day move: Value's 20-day z is +0.3 and its 63-day z is +0.6.
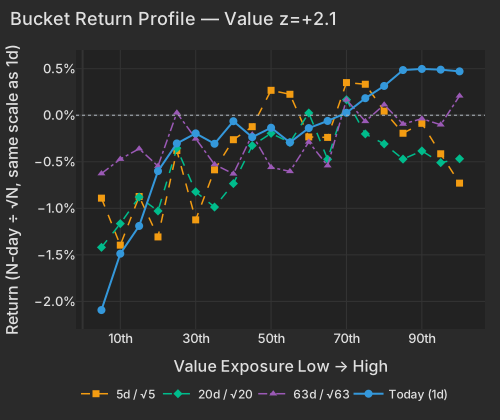
| Bucket | Ret 1D Pct | Ret 5D Norm Pct | Ret 20D Norm Pct | Ret 63D Norm Pct |
|---|---|---|---|---|
| 1 | -2.09 | -0.89 | -1.42 | -0.63 |
| 2 | -1.49 | -1.40 | -1.16 | -0.47 |
| 3 | -1.19 | -0.87 | -0.88 | -0.36 |
| 4 | -0.60 | -1.31 | -1.03 | -0.55 |
| 5 | -0.30 | -0.38 | -0.35 | 0.03 |
| 6 | -0.20 | -1.12 | -0.82 | -0.25 |
| 7 | -0.31 | -0.59 | -0.99 | -0.53 |
| 8 | -0.06 | -0.26 | -0.73 | -0.63 |
| 9 | -0.24 | -0.12 | -0.33 | -0.21 |
| 10 | -0.13 | 0.27 | -0.19 | -0.56 |
| 11 | -0.29 | 0.23 | -0.29 | -0.60 |
| 12 | -0.14 | -0.23 | 0.02 | -0.29 |
| 13 | -0.06 | -0.24 | -0.47 | -0.54 |
| 14 | 0.03 | 0.35 | 0.17 | 0.17 |
| 15 | 0.18 | 0.33 | -0.20 | -0.07 |
| 16 | 0.31 | 0.04 | -0.31 | 0.11 |
| 17 | 0.49 | -0.19 | -0.47 | -0.09 |
| 18 | 0.50 | -0.09 | -0.38 | -0.04 |
| 19 | 0.49 | -0.41 | -0.51 | -0.10 |
| 20 | 0.47 | -0.73 | -0.47 | 0.21 |
Citigroup closed down 5.6%, erasing $12B, despite beating estimates. Investors focused on a sequential drop in Markets revenue and higher credit-loss provisions. WSJ Goldman Sachs (GS) slipped 0.2% even though equity-trading revenue beat expectations. JPMorgan (JPM) fell 0.7% after its report. Bloomberg Wells Fargo (WFC) closed down 3.1%. UnitedHealth (UNH) ended flat after raising its full-year profit outlook. WSJ
Johnson & Johnson closed down 5.7% after its report, erasing about $36B. The company is also leaning toward spinning out its hips-and-knees business. WSJ Domino's (DPZ) fell 4.7% after U.S. same-store sales grew 0.3% against a 0.8% estimate. WSJ Stock-specific moves explained 84% of cross-sectional variance, against a one-year norm of 65%. On this earnings-heavy day, single names moved on their own news.
The 10-year Treasury yield fell 3.1 bps to 5.213% and the 30-year fell 3.6 bps to 5.563%, while the 2-year held at 4.789%. CNBC Long yields falling more than short yields flattened the curve. WTI crude rose 1.0% to $94.66 at 4:04 PM ET. CNBC XOP closed up 2.9%. BlackRock has raised long-term Treasuries to neutral after six years underweight, the Financial Times reported Tuesday. Last week the 10-year hit a 24-year peak of 5.365%, about 15 bps above today's level. FT
Variance decomposition: live intraday — 20261013 session, bracketed against its trailing-year range. Factor returns are trailing through last close. Total cross-sectional dispersion: 5.6%ile of the past year.
Variance mix — % of total, today vs 1d ago vs 1-yr avg
market 18%ile style 30%ile thematic 60%ile idiosyncratic 87%ile
Variance explained — today vs. factor's trailing-year range
Marker = the factor's share of today's total variance, placed in its own trailing-year range (box 25–75%ile, ticks 90%ile and max). Amber marker = unusually load-bearing today (≥90%ile of its own year). Factor name green = up today / red = down.
Correlation & dispersion — realized vs implied
Pairwise realized correlation (20d): 8.78% 5.9%ile since 2020 · 70%ile 3m
Top-500 pairwise: 12.84% 16%ile since 2020 · 90.5%ile 3m · implied (Cboe COR1M): 7.60 1.2%ile of its own history (gap +5.2pp)
Realized 20d vol (ann. pts): all stocks 36 vs VIXEQ 40 · index 9 vs VIX 15 · style factors 16 46%ile
20-day window (19 completed days + today); percentiles vs model history since 2020; '3m' tokens rank vs the trailing 63 trading days; definitions in Terms below. Implied prints (Cboe) are delayed ~15 min. as of 15:58 ET
Top 50 high-beta momentum names (eq-wt, since-2020 rank): -1.3% 26%ile · rest of market +0.2%
| Factor | Today | 1d | 5d | 20d | 60d |
|---|---|---|---|---|---|
| Style-Risk | |||||
| International | +0.17% z+0.6 | +0.09% | +0.02% | -0.43% | +0.68% |
| Beta | -0.50% z-0.5 | -1.65% | -4.56% | +2.15% | +1.21% |
| Residual Volatility | -0.08% z-0.1 | -0.37% | +0.35% | +0.88% | +4.45% |
| Style | |||||
| Value | +0.50% z+2.1 | +0.20% | +0.52% | +0.33% | +0.95% |
| Profitability | +0.26% z+1.4 | +0.04% | +0.27% | +1.47% | -0.53% |
| Liquidity | +0.13% z+0.5 | -0.08% | -0.22% | -0.52% | +2.27% |
| Growth | +0.08% z+0.3 | -0.02% | +0.28% | +1.11% | +1.50% |
| Size | +0.09% z+0.2 | +0.36% | +0.79% | +2.69% | +3.73% |
| Leverage | +0.04% z+0.2 | -0.04% | -0.48% | -1.03% | -3.74% |
| Dividend Yield | +0.01% z+0.0 | +0.00% | -0.17% | -0.82% | -0.60% |
| Style-Momentum | |||||
| Medium-Term Momentum | +0.19% z+0.7 | +0.08% | +0.60% | -0.12% | +0.43% |
| One-Day Momentum | +0.16% z+0.6 | -0.02% | +0.21% | -0.87% | -1.61% |
| Short-Term Momentum | -0.11% z-0.4 | +0.19% | +0.25% | +0.92% | -6.41% |
| Long-Term Momentum | +0.02% z+0.0 | -0.22% | -0.15% | +1.71% | -0.08% |
| Style-Positioning | |||||
| Hedge-Fund Ownership | -0.07% z-0.6 | +0.01% | +0.21% | -0.13% | -0.55% |
| Short Interest | -0.07% z-0.4 | +0.06% | +0.16% | -0.94% | -2.04% |
| Style-Flow | |||||
| Short-Sale Activity | +0.14% z+1.3 | +0.13% | -0.03% | -0.33% | +0.84% |
| Morning Activity | -0.03% z-0.2 | -0.02% | +0.08% | -0.91% | +1.48% |
| Thematic | |||||
| Gold | -0.30% z-0.9 | +0.02% | -0.12% | -1.29% | +2.90% |
| Oil | +0.35% z+0.7 | +0.02% | +0.45% | +0.40% | +5.34% |
| China | -0.20% z-0.5 | -0.31% | +0.09% | +0.11% | +0.55% |
| Treasury (Duration) | -0.11% z-0.3 | -0.15% | +0.15% | -1.82% | -2.98% |
| Bitcoin / Crypto | -0.07% z-0.2 | +0.12% | +0.44% | -0.53% | +2.19% |
| Semiconductors | -0.10% z-0.2 | -0.46% | -1.94% | +0.13% | -2.93% |
5/20/60d windows include today's session; 1d is the previous session.
Market variance share. The fraction of cross-sectional variance explained by the market factor — the attribution companion to pairwise correlation, not a substitute for it.
Factor z-score. Today's factor return divided by its daily-return standard deviation over ~1,600 trading days.
High-beta momentum cohort. US names above $2B market cap in the top quintile of both raw beta and 12-month momentum; membership frozen at each month's first business day. “Top 50” = the 50 strongest by combined rank.
Stock-specific (idiosyncratic) return. The part of a stock's move not explained by market, style, or thematic factors in our decomposition.
Data compiled by FactorPulse AI; edited and verified by Jeff Klein. For informational purposes only. Does not constitute financial advice, an investment recommendation, or an offer to buy or sell any securities. Always consult a qualified financial professional before making investment decisions.
For more on factor construction methodology, see www.factorpulse.com/glossary.