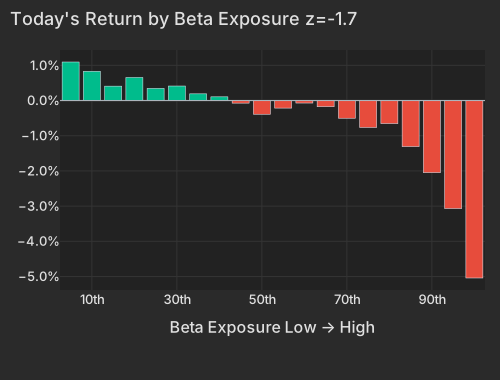
Investors dumped the stocks most sensitive to market moves for the second time in three sessions. The 50 hottest high-beta names fell nearly 5%, while the S&P 500 fund SPY finished essentially flat. A broader group of these stocks was already about 15% below its peak. Friday's rebound had come on roughly half the usual trading volume. The stocks being sold lean toward retail investors rather than hedge funds. Money moved to safer corners instead: consumer-staples and energy stocks rose more than 1%, and iPhone maker Apple gained more than 1%, adding about $60 billion in market value. Options traders are betting individual stocks will keep swinging even as the VIX, Wall Street's fear gauge, stays calm near 15.
China supplied the day's chip headline. Chinese memory maker CXMT said Saturday it plans to launch server memory built on a denser design by the end of 2026, ahead of the 2028 target set by Samsung and SK hynix. U.S. memory maker Micron fell nearly 4% and Korean rival SK hynix about 4%, together shedding more than $90 billion in market value. Most of Micron's drop tracked the broader selloff rather than its own news, while SK hynix took a bigger hit of its own. That split suggests investors see China's timeline mainly as a threat to the Korean makers. In Seoul, the KOSPI fell more than 3% as foreign investors sold chip stocks. The memory-chip fund DRAM and the South Korea fund EWY now carry the week's deepest losses. The broader chip fund SMH fell about 2% and is down more than 4% over five sessions. Lenders are wary too: JPMorgan and Goldman Sachs underwrote a $1.3 billion loan for AI cloud startup Volta but not its $3.7 billion chip loan, as investors demand higher yields for AI financing.
Oil climbed on violence in the Middle East. Houthi missile and drone strikes on Riyadh's King Khalid International Airport killed 13 people, and coalition forces were still intercepting incoming attacks on Monday morning NYT. Crude recovered from early losses after the attacks, as Morningstar reported. U.S. crude rose about 1.5% to roughly $93 a barrel. Energy stocks led the market, but the rally stayed in that sector. Defense stocks got no lift: the defense fund XAR fell about 1%. The dollar rose to the top of its one-year range, and the 10-year Treasury yield stood above 5% as of Friday. Wednesday's consumer-price report is the next test for a high-flying trade that has now cracked twice in three sessions.
Beta lost -1.60% at z=-1.67, a return in the 4.9th percentile since 2020. Beta alone explained about 38% of stock-level variance. Style factors together explained 44% of the day's variance against a 22% one-year norm. SPY slipped just -0.05%, so a flat index hid a violent sort underneath it.
The damage sat in the stocks most sensitive to the market. The highest-Beta bucket fell -5.1%, led by AI hardware and power names: Aehr Test Systems (AEHR) -7.24%, AXT (AXTI) -9.27% and FuelCell Energy (FCEL) -9.54%. AEHR's company-specific component was +0.19%, so its drop came entirely from factor exposure. The 12-month momentum factor (Long-Term Momentum) eased just -0.26%. The model is pricing market sensitivity, not past winners as such. At the other end, Apple (AAPL) rose +1.30% on its Size exposure, adding about $60B of market value.
| Factor | Return | Z-Score | 5d Z | 20d Z | 63d Z | Category | Direction |
|---|---|---|---|---|---|---|---|
| Beta | -1.60% | -1.67 | -1.80 | +0.58 | -0.27 | Style-Risk | High-beta names lagged |
| Size | +0.34% | +0.98 | +1.10 | +1.77 | +1.19 | Style | Large caps led |
| Semiconductors | -0.45% | -0.75 | -1.36 | +0.30 | -0.89 | Thematic | Chip-exposed names lagged |
| Residual Volatility | -0.37% | -0.75 | +0.08 | +0.34 | +0.98 | Style-Risk | Volatile names lagged |
| Long-Term Momentum | -0.26% | -0.40 | -0.7 | +0.8 | -0.4 | Style-Momentum | 12-month winners slightly lower |
| Short-Sale Activity | +0.14% | +1.30 | -0.44 | -0.80 | +0.99 | Style-Flow | Friday's heavily short-sold names outperformed |
| Short Interest | +0.05% | +0.31 | -0.92 | -1.35 | -1.34 | Style-Positioning | Flat |
| Hedge-Fund Ownership | -0.01% | -0.12 | +0.61 | -0.47 | -0.44 | Style-Positioning | Flat |
| Bucket | Avg Ret Pct |
|---|---|
| 1 | 1.10 |
| 2 | 0.83 |
| 3 | 0.41 |
| 4 | 0.65 |
| 5 | 0.35 |
| 6 | 0.41 |
| 7 | 0.19 |
| 8 | 0.11 |
| 9 | -0.07 |
| 10 | -0.39 |
| 11 | -0.21 |
| 12 | -0.07 |
| 13 | -0.17 |
| 14 | -0.50 |
| 15 | -0.76 |
| 16 | -0.65 |
| 17 | -1.31 |
| 18 | -2.05 |
| 19 | -3.07 |
| 20 | -5.04 |
ChangXin Memory Technologies (CXMT) said on October 10 that it plans to launch server DDR5 modules built on a denser 4F² cell design by the end of 2026, according to the South China Morning Post. Samsung and SK hynix are targeting 2028 for the same architecture. Micron (MU) fell -3.80% and SK hynix (SKHY) -3.97%, erasing about $45B and $49B of market value.
The return decomposition separates the two. Micron lost -2.90% through factor exposure, led by Beta, and only -0.51% on its own news. SK hynix took -1.39% on company-specific news, matching its style loss. That split suggests investors see CXMT's timeline mainly as a threat to the Korean memory makers. In Seoul, the KOSPI fell more than 3% as foreign investors sold chip stocks KOREATIMES. The Semiconductors factor itself lost only -0.45% today, but it has now fallen five sessions in a row, for -1.85% over the week.
| ETF | Theme | Today | 1d Ago | 5d Ago | 20d Ago | 63d Ago |
|---|---|---|---|---|---|---|
| DRAM | memory chips | -4.36% | +0.46% | -7.43% | -3.23% | -0.19% |
| EWY | South Korea | -3.92% | +0.54% | -7.63% | -6.08% | +5.49% |
| URA | uranium | -3.01% | +0.88% | -2.24% | -10.64% | -4.47% |
| NLR | nuclear power | -2.97% | +0.95% | +0.59% | -8.72% | -5.60% |
| SMH | semiconductors | -2.08% | -0.65% | -4.32% | +6.12% | +3.02% |
| AIPO | AI power infrastructure | -1.96% | +0.87% | -0.10% | -0.45% | -4.66% |
| MTUM | momentum | -1.54% | +0.84% | -0.89% | +4.43% | +1.91% |
| SPY | large cap | -0.05% | +0.60% | +1.16% | +2.12% | +4.18% |
| XLP | consumer staples | +1.11% | +0.01% | +3.60% | +0.72% | -0.72% |
| XLE | energy | +1.39% | -0.25% | +3.60% | +0.52% | +15.40% |
Memory chips and Korea carry the week's deepest losses, while staples and energy were bought on the other side of a flat index.
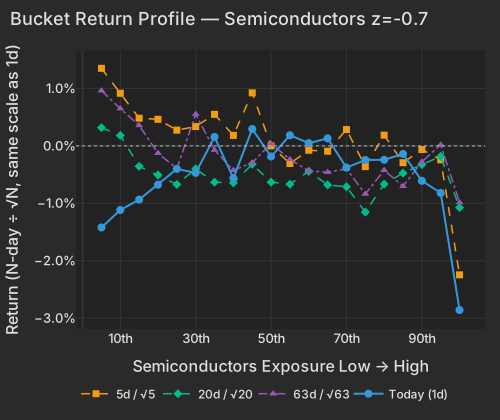
| Bucket | Ret 1D Pct | Ret 5D Norm Pct | Ret 20D Norm Pct | Ret 63D Norm Pct |
|---|---|---|---|---|
| 1 | -1.42 | 1.35 | 0.32 | 0.96 |
| 2 | -1.12 | 0.92 | 0.18 | 0.65 |
| 3 | -0.94 | 0.48 | -0.36 | 0.36 |
| 4 | -0.68 | 0.46 | -0.51 | -0.13 |
| 5 | -0.40 | 0.27 | -0.67 | -0.39 |
| 6 | -0.47 | 0.34 | -0.40 | 0.55 |
| 7 | 0.16 | 0.55 | -0.63 | -0.07 |
| 8 | -0.56 | 0.18 | -0.64 | -0.42 |
| 9 | 0.29 | 0.92 | -0.32 | -0.29 |
| 10 | -0.19 | -0.00 | -0.63 | 0.04 |
| 11 | 0.19 | -0.31 | -0.67 | -0.23 |
| 12 | 0.05 | -0.08 | -0.44 | -0.44 |
| 13 | 0.13 | -0.09 | -0.68 | -0.46 |
| 14 | -0.38 | 0.28 | -0.71 | -0.40 |
| 15 | -0.25 | -0.36 | -1.15 | -0.84 |
| 16 | -0.24 | 0.19 | -0.67 | -0.42 |
| 17 | -0.14 | -0.29 | -0.47 | -0.70 |
| 18 | -0.61 | -0.06 | -0.33 | -0.28 |
| 19 | -0.82 | -0.24 | -0.18 | 0.02 |
| 20 | -2.86 | -2.25 | -1.07 | -0.99 |
Lenders are cautious too. JPMorgan and Goldman Sachs underwrote a $1.3 billion term loan for the AI cloud startup Volta but left its $3.7 billion chip loan un-underwritten, as investors demand higher yields for AI financing Bloomberg.
The top 50 high-beta momentum names fell -4.75% as of 3:56 PM ET, the 85th-worst day since 2020. They hit their session low of -5.06% at 11:31 and never recovered. The broader high-beta momentum group fell -3.29%. Thursday also ranked among this group's most extreme days since 2020, and the group was already -14.8% below its peak at Friday's close.
Friday's rebound came on light volume, about half the market's usual pace. Today the selling hit the names that most closely fit the high-beta momentum profile hardest: the top 50 fell about 1.44 times as far as the broader group, well above the usual ratio.
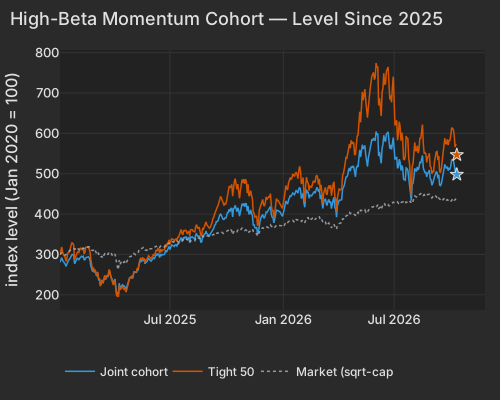
| Series | Prev Close Level |
|---|---|
| joint | 514.94 |
| tight50 | 573.98 |
| market | 438.30 |
Hedge-fund-owned stocks were not singled out. Hedge-Fund Ownership was flat both after adjusting for other factors (z=-0.12) and on a raw basis (z=-0.14). The top 50 are not hedge-fund-heavy either; they lean strongly toward retail-heavy names that habitually trade early (+1.35σ). Who did the selling is unknown, but the stocks being sold are retail-tilted. Options pricing points the same way: implied single-stock volatility (Cboe VIXEQ) is 39.22, the top of its 20-session range, while the VIX is just 15.23. Options are priced for single stocks to keep moving while the index stays calm.
Houthi missile and drone strikes on Riyadh's King Khalid International Airport have killed 13 people, and coalition forces were still intercepting incoming attacks on Monday morning NYT. Crude recovered from early losses after the attacks, as Morningstar reported. WTI was at $93.27 at 4:03 PM ET, up +1.55% CNBC. Energy stocks led the sector board, but the Oil factor returned just +0.03% (z=+0.07). Crude lifted energy as a sector without reordering the rest of the market by oil sensitivity.
Defense stocks did not get a lift from the strikes: XAR fell -1.16%. ITA's -11.98% 63-day loss is in the 4.5th percentile of such windows since 2018. The dollar index reached 102.60 at 4:13 PM ET, up +0.38% and at the top of its one-year range CNBC. The ten-year Treasury yield last printed 5.24% at Friday's close CNBC. Investors are now waiting for Wednesday's U.S. CPI report bls.gov. That is the next test for a high-beta trade that has now broken twice in three sessions.
Variance decomposition: live intraday — 20261012 session, bracketed against its trailing-year range. Factor returns are trailing through last close. Total cross-sectional dispersion: 10%ile of the past year.
Variance mix — % of total, today vs 1d ago vs 1-yr avg
market 31%ile style 94.4%ile thematic 43%ile idiosyncratic 16%ile
Variance explained — today vs. factor's trailing-year range
Marker = the factor's share of today's total variance, placed in its own trailing-year range (box 25–75%ile, ticks 90%ile and max). Amber marker = unusually load-bearing today (≥90%ile of its own year). Factor name green = up today / red = down.
Correlation & dispersion — realized vs implied
Pairwise realized correlation (20d): 9.17% 6.8%ile since 2020 · 82%ile 3m
Top-500 pairwise: 13.47% 18%ile since 2020 · 100.0%ile 3m · implied (Cboe COR1M): 7.52 1.1%ile of its own history (gap +6.0pp)
Realized 20d vol (ann. pts): all stocks 36 vs VIXEQ 39 · index 10 vs VIX 15 · style factors 16 47%ile
20-day window (19 completed days + today); percentiles vs model history since 2020; '3m' tokens rank vs the trailing 63 trading days; definitions in Terms below. Implied prints (Cboe) are delayed ~15 min. as of 15:58 ET
Top 50 high-beta momentum names (eq-wt, since-2020 rank): -4.8% 4.9%ile · rest of market +0.2%
| Factor | Today | 1d | 5d | 20d | 60d |
|---|---|---|---|---|---|
| Style-Risk | |||||
| Beta | -1.60% z-1.7 | +0.38% | -3.86% | +2.51% | +1.88% |
| Residual Volatility | -0.37% z-0.8 | +0.43% | +0.09% | +0.76% | +4.98% |
| International | +0.11% z+0.4 | +0.08% | -0.22% | -0.52% | +0.48% |
| Style | |||||
| Size | +0.34% z+1.0 | +0.04% | +0.86% | +2.76% | +3.80% |
| Value | +0.20% z+0.9 | -0.49% | +0.11% | +0.01% | +0.47% |
| Liquidity | -0.07% z-0.3 | -0.51% | -0.19% | -0.84% | +2.92% |
| Leverage | -0.04% z-0.2 | -0.16% | -0.20% | -1.23% | -3.95% |
| Profitability | +0.02% z+0.1 | -0.24% | +0.11% | +1.16% | -0.78% |
| Growth | -0.02% z-0.1 | +0.07% | +0.47% | +0.93% | +1.55% |
| Dividend Yield | +0.01% z+0.1 | -0.29% | -0.12% | -0.60% | -0.60% |
| Style-Momentum | |||||
| Short-Term Momentum | +0.15% z+0.5 | +0.31% | +0.80% | +1.58% | -6.48% |
| Long-Term Momentum | -0.26% z-0.4 | +0.17% | -1.02% | +2.40% | -0.21% |
| Medium-Term Momentum | +0.06% z+0.2 | +0.40% | +0.26% | -0.30% | +0.08% |
| One-Day Momentum | -0.01% z-0.0 | +0.02% | -0.35% | -1.20% | -2.02% |
| Style-Positioning | |||||
| Short Interest | +0.05% z+0.3 | +0.02% | -0.34% | -1.00% | -2.24% |
| Hedge-Fund Ownership | -0.01% z-0.1 | +0.17% | +0.15% | -0.23% | -0.54% |
| Style-Flow | |||||
| Short-Sale Activity | +0.14% z+1.3 | -0.18% | -0.11% | -0.39% | +0.65% |
| Morning Activity | -0.00% z-0.0 | -0.00% | +0.18% | -0.81% | +1.53% |
| Thematic | |||||
| Semiconductors | -0.45% z-0.8 | -0.28% | -1.85% | +0.81% | -2.65% |
| China | -0.30% z-0.7 | +0.35% | -0.07% | +0.04% | +1.06% |
| Treasury (Duration) | -0.14% z-0.4 | +0.01% | -0.03% | -1.73% | -3.28% |
| Bitcoin / Crypto | +0.13% z+0.4 | +0.29% | +0.03% | -0.56% | +2.56% |
| Oil | +0.03% z+0.1 | -0.09% | -0.14% | +0.79% | +5.51% |
| Gold | +0.02% z+0.1 | +0.44% | -0.07% | -1.15% | +3.33% |
5/20/60d windows include today's session; 1d is the previous session.
Factor z-score. Today's factor return divided by its daily-return standard deviation over ~1,600 trading days.
High-beta momentum cohort. US names above $2B market cap in the top quintile of both raw beta and 12-month momentum; membership frozen at each month's first business day. “Top 50” = the 50 strongest by combined rank.
VIXEQ / DSPX / COR1M. Cboe implied indices: single-stock volatility, dispersion, and 1-month implied correlation (top-50 S&P names). Quotes delayed ~15 minutes.
Data compiled by FactorPulse AI; edited and verified by Jeff Klein. For informational purposes only. Does not constitute financial advice, an investment recommendation, or an offer to buy or sell any securities. Always consult a qualified financial professional before making investment decisions.
For more on factor construction methodology, see www.factorpulse.com/glossary.