Chinese memory-chip maker ChangXin Memory Technologies reported progress on a denser chip design, one that packs more memory into the same space than the layout used in mainstream production, and memory stocks from Seoul to New York are paying for it. When South Korea's market reopened after a holiday weekend, the Kospi index fell nearly 4%, its fourth straight loss, led by Samsung Electronics and SK Hynix, with foreign investors doing much of the selling. Higher oil prices and tension in the Middle East also weighed. Before the U.S. opening bell, memory-chip maker Micron is down about 2%, and the memory-chip fund DRAM is off nearly 3% after losing more than 7% over the prior five sessions.
The drop extends a week-old slide in chip stocks, which have now fallen five sessions in a row, though the semiconductor fund SMH is still up about 6% over the past month. This morning the losses are landing hardest on the stocks that swing most with the market, particularly AI hardware names. The most market-sensitive of them are down about 1% while the rest of the market is slightly higher. Hedge funds had already pulled back. Goldman Sachs data through Friday showed stock-picking hedge funds' net bets on rising stocks near the bottom of their historical range, with managers net sellers of chip stocks. Stocks popular with hedge funds aren't taking a second hit today, but Friday's bounce in last week's hardest-hit names came on light trading, a sign few investors are rushing back in.
Oil is climbing after Houthi missile and drone strikes on Riyadh's King Khalid International Airport over the weekend killed 13 people. Aviation authorities widened travel advisories this morning after the Saudi-led coalition reported intercepting more drones and missiles. U.S. crude is up about 1.4% to roughly $93 a barrel, also helped by fresh strikes on Ukrainian energy infrastructure. In the stock market, the lift is mostly confined to big oil companies such as TotalEnergies and Shell, and defense stocks aren't drawing buyers. Elsewhere, drugmaker Bristol-Myers Squibb is up more than 3% after two late-stage trials met their main goals, one in a lung-scarring disease and one in neuroendocrine tumors.
Investing.com reported that ChangXin Memory Technologies (CXMT) has made progress on a 4F² DRAM cell. That layout fits more memory cells on a chip than the 6F² design used in mainstream production. When Korea reopened, the KOSPI closed -3.65% lower for its fourth straight loss, Korea JoongAng Daily reported. Foreign investors drove the semiconductor selling KOREATIMES. The same outlet also blamed part of the drop on higher oil prices and tension in the Middle East.
Before the U.S. open, Micron (MU) is down -2.33% and SK Hynix's U.S. listing (SKHY) is down -2.26%. The pressure was building before today. The Semiconductors factor has fallen in each of the last five sessions, losing -1.61% in total. Beta has given up -2.65% over the same five days. On its own, today's Semiconductors move of -0.21% (z=-0.35) is small. It matters because it is the fifth decline in a row, and Seoul has just shown how much further a market heavy in memory chips can fall in one session.
| ETF | Theme | Today | 1d Ago | 5d Ago | 20d Ago | 63d Ago |
|---|---|---|---|---|---|---|
| DRAM | memory chips & storage | -2.68% | +0.46% | -7.43% | -3.23% | -0.19% |
| EWY | south korea | -2.43% | +0.54% | -7.63% | -6.08% | +5.49% |
| SMH | semiconductors | -0.88% | -0.65% | -4.32% | +6.12% | +3.02% |
| XLK | technology | -0.31% | +0.51% | -0.52% | +6.04% | +9.78% |
| ITA | defense | -0.15% | +0.86% | -0.55% | -5.53% | -11.98% |
| SPY | large cap | +0.05% | +0.60% | +1.16% | +2.12% | +4.18% |
| IGV | software | +0.38% | +2.81% | +3.91% | +10.98% | +21.54% |
| XLE | energy | +0.81% | -0.25% | +3.60% | +0.52% | +15.40% |
| USO | oil | +1.73% | +0.42% | +0.56% | -4.33% | +25.82% |
Memory chips and Korea rank last on every short window, but the broader chip ETF, SMH, is still up +6.12% over 20 days. The slide is a week old, and the month is still positive.
| Factor | Return | Z-Score | 5d Z | 20d Z | 63d Z | Category | Direction |
|---|---|---|---|---|---|---|---|
| Beta | -0.39% | -0.41 | -1.24 | +0.87 | -0.11 | Style-Risk | High-beta names lagging |
| Semiconductors | -0.21% | -0.35 | -1.19 | +0.39 | -0.84 | Thematic | Chip exposure lagging, 5th straight down day |
| Residual Volatility | +0.12% | +0.24 | +0.52 | +0.56 | +1.10 | Style-Risk | Volatile names still ahead |
| Oil | +0.11% | +0.23 | -0.1 | +0.4 | +1.3 | Thematic | Barely moving despite crude |
| Hedge-Fund Ownership | -0.01% | -0.09 | +0.63 | -0.46 | -0.43 | Style-Positioning | Flat |
| Short Interest | +0.02% | +0.13 | -1.00 | -1.39 | -1.36 | Style-Positioning | Flat today |
| Leverage | -0.02% | -0.13 | -0.49 | -1.62 | -2.97 | Style | Three-month losing run |
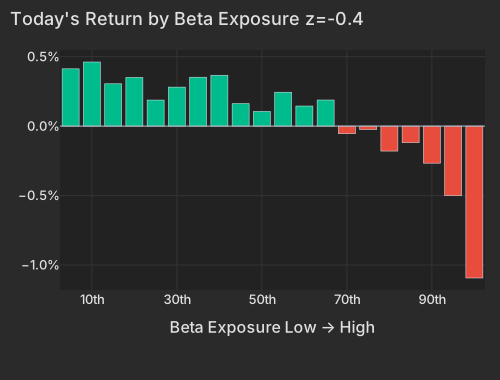
Beta is down -0.39% (z=-0.41) and accounts for about 19% of stock-level variance this morning, a high share for it compared with its past year. Almost all of the damage is in the highest-beta twentieth of the market, which is down -1.09%. Seven AI, chip and data-center names in that group are off -1.99% on a weighted basis. Aehr Test Systems (AEHR), AXT (AXTI), Sandisk (SNDK) and Penguin Solutions (PENG) are each down between -1.4% and -2.5%, and factor exposure explains all or nearly all of each move. The top 50 high-beta momentum names are down -1.16% while the rest of the market is up +0.19%, so last Thursday's rout is continuing at a more normal pace.
| Bucket | Avg Ret Pct |
|---|---|
| 1 | 0.41 |
| 2 | 0.46 |
| 3 | 0.30 |
| 4 | 0.35 |
| 5 | 0.19 |
| 6 | 0.28 |
| 7 | 0.35 |
| 8 | 0.37 |
| 9 | 0.16 |
| 10 | 0.11 |
| 11 | 0.24 |
| 12 | 0.14 |
| 13 | 0.19 |
| 14 | -0.05 |
| 15 | -0.02 |
| 16 | -0.18 |
| 17 | -0.12 |
| 18 | -0.27 |
| 19 | -0.50 |
| 20 | -1.09 |
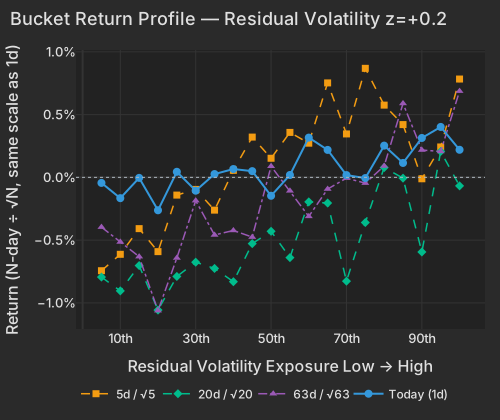
Residual Volatility is moving the other way, up +0.12% (z=+0.24) today and +5.48% over 60 sessions. The same stocks tend to score high on both Beta and Residual Volatility, so a plain screen would show them losing together. With the two separated, the losses fall on market sensitivity, meaning the AI hardware names that move with the index, while stocks that are volatile for company-specific reasons keep outperforming.
| Bucket | Ret 1D Pct | Ret 5D Norm Pct | Ret 20D Norm Pct | Ret 63D Norm Pct |
|---|---|---|---|---|
| 1 | -0.04 | -0.74 | -0.79 | -0.40 |
| 2 | -0.17 | -0.61 | -0.90 | -0.51 |
| 3 | -0.00 | -0.41 | -0.70 | -0.63 |
| 4 | -0.26 | -0.59 | -1.06 | -1.06 |
| 5 | 0.04 | -0.14 | -0.79 | -0.64 |
| 6 | -0.11 | -0.10 | -0.68 | -0.19 |
| 7 | 0.03 | -0.26 | -0.73 | -0.46 |
| 8 | 0.07 | 0.06 | -0.83 | -0.42 |
| 9 | 0.05 | 0.32 | -0.53 | -0.48 |
| 10 | -0.15 | 0.15 | -0.43 | 0.09 |
| 11 | 0.02 | 0.36 | -0.64 | -0.11 |
| 12 | 0.32 | 0.27 | -0.20 | -0.31 |
| 13 | 0.22 | 0.75 | -0.20 | -0.09 |
| 14 | 0.02 | 0.35 | -0.83 | -0.01 |
| 15 | -0.01 | 0.87 | -0.36 | -0.05 |
| 16 | 0.25 | 0.58 | 0.08 | 0.09 |
| 17 | 0.11 | 0.42 | -0.01 | 0.59 |
| 18 | 0.31 | -0.01 | -0.59 | 0.22 |
| 19 | 0.40 | 0.24 | 0.21 | 0.21 |
| 20 | 0.22 | 0.78 | -0.07 | 0.69 |
Goldman Sachs Prime Brokerage data through Friday, October 9, showed net leverage among U.S. fundamental long/short funds falling to the 1st percentile, with managers net sellers of semiconductors. This morning, hedge-fund holdings are not taking a second round of losses. Hedge-Fund Ownership is flat at -0.01% (z=-0.09), and it is also flat on a raw basis. Short Interest is flat too, at +0.02%. On Friday, the high-beta momentum names that led the earlier selling bounced on light volume, which does not point to strong re-leveraging. The chip trade is still being sold, but no particular type of seller can be identified from this morning's data.
Bristol-Myers Squibb (BMY) is up +3.60%, adding $4.3B of market value. The company said its Phase 3 ALOFT-IPF trial of admilparant in idiopathic pulmonary fibrosis met its primary endpoint. A second Phase 3 trial, ACTION-1 for the radiopharmaceutical RYZ101 in neuroendocrine tumors, also met its primary goal. CCC Intelligent Solutions (CCC) is up +10.61% after Bloomberg reported Friday that GTCR and Elliott Investment Management are in advanced talks to take the auto-insurance software company private. Salesforce (CRM) is up +4.34%, adding $8.2B of market value, almost all of it stock-specific, and the reason has not yet appeared in news coverage.
Houthi missile and drone strikes on Riyadh's King Khalid International Airport on October 10 and 11 killed 13 people NYT. At 7:14 AM ET, aviation authorities widened travel advisories after the Saudi-led coalition reported intercepting more drones and ballistic missiles NYT. Fresh strikes on Ukrainian energy infrastructure are also supporting crude, while a possible Russian diesel export deal pulls the other way WSJ.
In equities, the response is limited to the oil majors. TotalEnergies (TTE) is up +2.33% and Shell (SHEL) +1.25%, leading an Energy sector that is up +0.88%. Oil sensitivity is not separating winners from losers in the rest of the market. Defense is not attracting buyers either: ITA's 63-day loss is in the worst 4.5% of its 63-day windows since 2019.
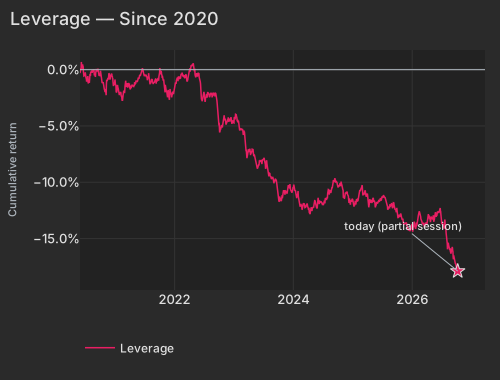
The ten-year Treasury yield last closed at 5.24% on Friday CNBC. Over the same months that yields climbed, the Leverage factor has lost -3.94% in 60 sessions, a three-month run among the worst 1% since 2020. That steady pressure on heavily indebted companies is the slower trend under this week's chip losses.
| Date | Cumret Pct |
|---|---|
| 2020-05-29 | -0.31 |
| 2020-06-22 | -0.33 |
| 2020-07-15 | -0.63 |
| 2020-08-06 | -0.33 |
| 2020-08-28 | -0.33 |
| 2020-09-22 | -0.38 |
| 2020-10-14 | -1.16 |
| 2020-11-05 | -2.14 |
| 2020-11-30 | -0.81 |
| 2020-12-22 | -1.45 |
| 2021-01-15 | -1.36 |
| 2021-02-09 | -2.52 |
| 2021-03-04 | -1.07 |
| 2021-03-26 | -1.44 |
| 2021-04-20 | -1.35 |
| 2021-05-12 | -1.04 |
| 2021-06-04 | -0.56 |
| 2021-06-28 | -0.54 |
| 2021-07-21 | -0.64 |
| 2021-08-12 | -0.90 |
| 2021-09-03 | -0.94 |
| 2021-09-28 | -0.62 |
| 2021-10-20 | -0.63 |
| 2021-11-11 | -1.69 |
| 2021-12-06 | -1.72 |
| 2021-12-29 | -2.12 |
| 2022-01-21 | -0.73 |
| 2022-02-14 | -0.49 |
| 2022-03-09 | -0.68 |
| 2022-03-31 | -0.20 |
| 2022-04-25 | 0.45 |
| 2022-05-17 | -0.41 |
| 2022-06-09 | -1.08 |
| 2022-07-05 | -2.24 |
| 2022-07-27 | -2.22 |
| 2022-08-18 | -2.25 |
| 2022-09-12 | -2.10 |
| 2022-10-04 | -4.72 |
| 2022-10-26 | -4.83 |
| 2022-11-17 | -4.76 |
| 2022-12-12 | -4.37 |
| 2023-01-05 | -4.21 |
| 2023-01-30 | -4.54 |
| 2023-02-22 | -5.30 |
| 2023-03-16 | -6.84 |
| 2023-04-10 | -7.11 |
| 2023-05-02 | -7.36 |
| 2023-05-24 | -8.69 |
| 2023-06-16 | -8.13 |
| 2023-07-12 | -8.23 |
| 2023-08-03 | -9.23 |
| 2023-08-25 | -9.59 |
| 2023-09-19 | -9.92 |
| 2023-10-11 | -11.26 |
| 2023-11-02 | -10.88 |
| 2023-11-27 | -10.96 |
| 2023-12-19 | -10.71 |
| 2024-01-12 | -10.76 |
| 2024-02-06 | -11.53 |
| 2024-02-29 | -12.24 |
| 2024-03-22 | -12.11 |
| 2024-04-16 | -12.83 |
| 2024-05-08 | -12.05 |
| 2024-05-31 | -11.85 |
| 2024-06-25 | -11.87 |
| 2024-07-18 | -11.53 |
| 2024-08-09 | -10.89 |
| 2024-09-03 | -10.15 |
| 2024-09-25 | -9.94 |
| 2024-10-17 | -10.16 |
| 2024-11-08 | -11.22 |
| 2024-12-03 | -11.13 |
| 2024-12-26 | -11.73 |
| 2025-01-22 | -11.98 |
| 2025-02-13 | -10.86 |
| 2025-03-10 | -11.00 |
| 2025-04-01 | -11.09 |
| 2025-04-24 | -11.82 |
| 2025-05-16 | -11.66 |
| 2025-06-10 | -11.72 |
| 2025-07-03 | -11.29 |
| 2025-07-28 | -11.88 |
| 2025-08-19 | -12.00 |
| 2025-09-11 | -11.89 |
| 2025-10-03 | -12.45 |
| 2025-10-27 | -12.79 |
| 2025-11-18 | -13.70 |
| 2025-12-11 | -14.19 |
| 2026-01-06 | -14.07 |
| 2026-01-29 | -13.65 |
| 2026-02-23 | -12.69 |
| 2026-03-17 | -13.63 |
| 2026-04-09 | -13.07 |
| 2026-05-01 | -13.11 |
| 2026-05-26 | -13.11 |
| 2026-06-17 | -12.74 |
| 2026-07-13 | -13.86 |
| 2026-08-04 | -14.83 |
| 2026-08-26 | -15.91 |
| 2026-09-18 | -16.70 |
| 2026-10-12 | -17.89 |
Variance decomposition: live intraday — 20261012 session, bracketed against its trailing-year range. Factor returns are trailing through last close. Total cross-sectional dispersion: 0.4%ile of the past year.
Variance mix — % of total, today vs 1d ago vs 1-yr avg
market 16%ile style 68%ile thematic 55%ile idiosyncratic 55%ile
Variance explained — today vs. factor's trailing-year range
Marker = the factor's share of today's total variance, placed in its own trailing-year range (box 25–75%ile, ticks 90%ile and max). Amber marker = unusually load-bearing today (≥90%ile of its own year). Factor name green = up today / red = down.
Correlation & dispersion — realized vs implied
Pairwise realized correlation (20d): 9.55% 7.6%ile since 2020 · 87%ile 3m
Top-500 pairwise: 14.89% 23%ile since 2020 · 100.0%ile 3m · implied (Cboe COR1M): 6.93 0.9%ile of its own history (gap +8.0pp)
Realized 20d vol (ann. pts): all stocks 35 vs VIXEQ 39 · index 10 vs VIX 15 · style factors 15 41%ile
20-day window (19 completed days + today); percentiles vs model history since 2020; '3m' tokens rank vs the trailing 63 trading days; definitions in Terms below. Implied prints (Cboe) are delayed ~15 min. as of 07:58 ET
Top 50 high-beta momentum names (eq-wt, since-2020 rank): -1.2% 28%ile · rest of market +0.2%
| Factor | Today | 1d | 5d | 20d | 60d |
|---|---|---|---|---|---|
| Style-Risk | |||||
| Beta | -0.39% z-0.4 | +0.38% | -2.65% | +3.72% | +3.09% |
| Residual Volatility | +0.12% z+0.2 | +0.43% | +0.58% | +1.25% | +5.48% |
| International | +0.04% z+0.1 | +0.08% | -0.30% | -0.59% | +0.41% |
| Style | |||||
| Value | -0.05% z-0.2 | -0.49% | -0.14% | -0.25% | +0.22% |
| Profitability | -0.04% z-0.2 | -0.24% | +0.05% | +1.10% | -0.85% |
| Leverage | -0.02% z-0.1 | -0.16% | -0.18% | -1.22% | -3.94% |
| Size | +0.03% z+0.1 | +0.04% | +0.55% | +2.45% | +3.49% |
| Liquidity | -0.01% z-0.1 | -0.51% | -0.13% | -0.79% | +2.98% |
| Dividend Yield | -0.01% z-0.1 | -0.29% | -0.14% | -0.62% | -0.61% |
| Growth | -0.00% z-0.0 | +0.07% | +0.48% | +0.95% | +1.57% |
| Style-Momentum | |||||
| Long-Term Momentum | -0.10% z-0.2 | +0.17% | -0.86% | +2.56% | -0.05% |
| Short-Term Momentum | +0.04% z+0.1 | +0.31% | +0.68% | +1.46% | -6.60% |
| Medium-Term Momentum | +0.04% z+0.1 | +0.40% | +0.24% | -0.33% | +0.05% |
| One-Day Momentum | +0.01% z+0.0 | +0.02% | -0.33% | -1.18% | -2.00% |
| Style-Positioning | |||||
| Short Interest | +0.02% z+0.1 | +0.02% | -0.37% | -1.04% | -2.27% |
| Hedge-Fund Ownership | -0.01% z-0.1 | +0.17% | +0.15% | -0.23% | -0.54% |
| Style-Flow | |||||
| Morning Activity | +0.11% z+0.9 | -0.00% | +0.29% | -0.69% | +1.64% |
| Short-Sale Activity | +0.02% z+0.1 | -0.18% | -0.23% | -0.51% | +0.53% |
| Thematic | |||||
| Semiconductors | -0.21% z-0.3 | -0.28% | -1.61% | +1.05% | -2.41% |
| Bitcoin / Crypto | +0.10% z+0.3 | +0.29% | +0.00% | -0.59% | +2.53% |
| Oil | +0.11% z+0.2 | -0.09% | -0.06% | +0.86% | +5.59% |
| Gold | -0.07% z-0.2 | +0.44% | -0.16% | -1.24% | +3.24% |
| Treasury (Duration) | +0.03% z+0.1 | +0.01% | +0.15% | -1.55% | -3.10% |
| China | -0.01% z-0.0 | +0.35% | +0.22% | +0.33% | +1.34% |
5/20/60d windows include today's session; 1d is the previous session.
Factor z-score. Today's factor return divided by its daily-return standard deviation over ~1,600 trading days.
High-beta momentum cohort. US names above $2B market cap in the top quintile of both raw beta and 12-month momentum; membership frozen at each month's first business day. “Top 50” = the 50 strongest by combined rank.
Stock-specific (idiosyncratic) return. The part of a stock's move not explained by market, style, or thematic factors in our decomposition.
Data compiled by FactorPulse AI; edited and verified by Jeff Klein. For informational purposes only. Does not constitute financial advice, an investment recommendation, or an offer to buy or sell any securities. Always consult a qualified financial professional before making investment decisions.
For more on factor construction methodology, see www.factorpulse.com/glossary.