SpaceX's roughly $8 billion deal for nationwide wireless airwaves, agreed Thursday, wiped about $58 billion off T-Mobile, AT&T and Verizon on Friday as investors saw the company turning from a partner of the big carriers into a direct competitor. T-Mobile fell about 13%, AT&T nearly 10%, and Verizon about 9%, its worst day since 2002. European telecom stocks slid too. Cell-tower landlords Crown Castle and American Tower rose about 15% and 9%, adding roughly $11 billion on the bet that a new SpaceX network will need their sites. That gain is only about a fifth of what the carriers lost, and there is a catch: those same three carriers were expected to supply nearly 90% of Crown Castle's site rent for 2025. The towers win only if SpaceX picks ground equipment over satellites and the new rent outweighs the strain on the landlords' biggest customers.
Elsewhere, a Bloomberg report that ChatGPT maker OpenAI expects annualized revenue of at least $70 billion by December lifted Microsoft more than 2% and Amazon more than 3%, together adding about $180 billion in market value. Software stocks rose nearly 3% in a rally that went well beyond Microsoft, led by a 7% jump in Snowflake, while chipmakers slipped. Apple fell about 1% after Nikkei Asia reported 15% to 20% cuts to October parts orders for the iPhone 18 Pro. Health insurer Humana jumped about 11% after analysts named it the top winner from the 2027 Medicare star ratings. Chinese internet stocks climbed about 4% on heavy trading as Alibaba drew higher price targets from Jefferies and Citi and Beijing approved a record 550 billion yuan in local-government borrowing. Biotech stocks rose 3%, recovering part of a nearly 5% slide over the past month, and a broad basket of large U.S. stocks ended up about half a percent.
In bonds, the two-year Treasury yield rose about 4 basis points to roughly 4.8%, while the 10-year edged up to about 5.25% and the 30-year held near 5.6%. Gold gained about 1.5% to near $4,200 an ounce. Oil barely moved, with U.S. crude near $92 a barrel, after President Trump said the U.S. will not strike Iran before the November 3 midterms. The University of Michigan's early October consumer sentiment reading fell to 46.3 from 48.1, below forecasts, and Americans' one-year inflation expectations rose to 4.7%, the highest since May. The New York Fed's tracker held its estimate of third-quarter growth at 2.5%.
On Thursday, SpaceX agreed to buy Grain Management's nationwide 800 MHz spectrum portfolio, and the three national carriers took the hit today. CNBC The deal was reported at about $8 billion. TIKR T-Mobile (TMUS) closed -13.35%, erasing about $25B of market value. AT&T (T) closed -9.76%, and Verizon (VZ) fell -8.60% in its worst day since 2002. Bloomberg With the airwaves, SpaceX moves from technical partner to direct competitor in U.S. wireless, and European telecom stocks slid as well. WSJ Liberty's GCI tracking stock (GLIBK) is marked -15.01% on the day.
Crown Castle (CCI) closed the session +15.43%, then gave back -1.47% in late trading. American Tower (AMT) closed +9.30%, and together the two added about $11B. Investors are betting SpaceX's wireless plans will need new ground-based infrastructure. Globe and Mail Neither rally came from the factor model: style tilts took -0.46% off Crown Castle and -0.45% off American Tower. The customer list is the catch. AT&T, Verizon and T-Mobile were expected to generate nearly 90% of Crown Castle's 2025 site rental revenue. TIKR At today's prices, the landlords' gain depends on SpaceX choosing towers over satellites for coverage, and on that new rent outweighing pressure on the three tenants that pay most of it.
| Factor | Return | Z-Score | 5d Z | 20d Z | 63d Z | Category | Direction |
|---|---|---|---|---|---|---|---|
| Value | -0.47% | -2.0 | -0.7 | -0.5 | +0.1 | Style | Most expensive beat cheapest |
| Liquidity | -0.50% | -1.9 | -0.4 | -0.6 | +1.1 | Style | Lowest-turnover beat highest-turnover |
| Hedge-Fund Ownership | +0.18% | +1.6 | +1.0 | -0.5 | -0.4 | Positioning | Hedge-fund-owned names led |
| Short-Sale Activity | -0.17% | -1.5 | -0.9 | -0.8 | +0.7 | Flow | Yesterday's heavily short-sold names lagged |
| Dividend Yield | -0.26% | -1.5 | -1.4 | -1.0 | -0.2 | Style | High-payout names lagged |
| Gold | +0.47% | +1.4 | +0.0 | -0.7 | +1.3 | Thematic | Gold-linked names led |
| Residual Volatility | +0.41% | +0.8 | +0.9 | +1.0 | +1.0 | Risk | More volatile names led |
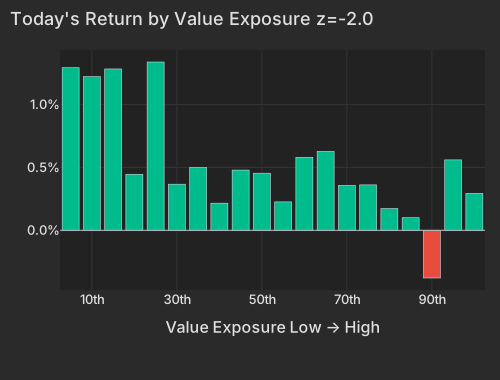
Separately from the telecom story, Value lost -0.47% at z=-2.0, a return in the 2.5th percentile since 2020, as the cheapest stocks lagged the most expensive. The gains came at the expensive end, where biotech and defense names are concentrated. The SPDR S&P Biotech ETF (XBI) closed +3.00% after falling -4.80% over the prior 20 sessions. Liquidity printed z=-1.9 as the lowest-turnover names, biotech and a pair of banks among them, beat the most heavily traded. Value is down only -0.49% over 20 days, so this is a one-day lurch rather than a trend.
| Bucket | Avg Ret Pct |
|---|---|
| 1 | 1.29 |
| 2 | 1.22 |
| 3 | 1.28 |
| 4 | 0.45 |
| 5 | 1.34 |
| 6 | 0.37 |
| 7 | 0.50 |
| 8 | 0.22 |
| 9 | 0.48 |
| 10 | 0.45 |
| 11 | 0.23 |
| 12 | 0.58 |
| 13 | 0.63 |
| 14 | 0.36 |
| 15 | 0.36 |
| 16 | 0.17 |
| 17 | 0.10 |
| 18 | -0.38 |
| 19 | 0.56 |
| 20 | 0.29 |
Dividend Yield is the factor with a multi-day trail. It fell -0.26% today at z=-1.5, and its five-day z of -1.38 shows high-payout stocks lagging all week. That hurt the carriers on top of the SpaceX news. Verizon's style component took -1.73% off its return, and Dividend Yield was the biggest single piece.
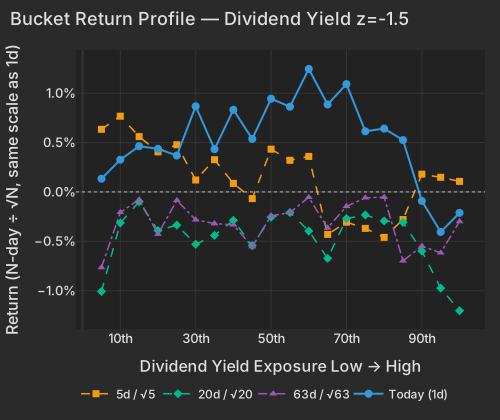
| Bucket | Ret 1D Pct | Ret 5D Norm Pct | Ret 20D Norm Pct | Ret 63D Norm Pct |
|---|---|---|---|---|
| 1 | 0.13 | 0.63 | -1.01 | -0.77 |
| 2 | 0.33 | 0.77 | -0.32 | -0.21 |
| 3 | 0.46 | 0.56 | -0.10 | -0.08 |
| 4 | 0.44 | 0.41 | -0.39 | -0.43 |
| 5 | 0.37 | 0.48 | -0.34 | -0.09 |
| 6 | 0.87 | 0.12 | -0.53 | -0.28 |
| 7 | 0.43 | 0.33 | -0.44 | -0.32 |
| 8 | 0.83 | 0.09 | -0.29 | -0.33 |
| 9 | 0.54 | -0.07 | -0.54 | -0.55 |
| 10 | 0.94 | 0.43 | -0.26 | -0.24 |
| 11 | 0.86 | 0.32 | -0.21 | -0.21 |
| 12 | 1.25 | 0.36 | -0.40 | -0.05 |
| 13 | 0.89 | -0.43 | -0.67 | -0.36 |
| 14 | 1.09 | -0.31 | -0.27 | -0.15 |
| 15 | 0.61 | -0.37 | -0.23 | -0.06 |
| 16 | 0.64 | -0.46 | -0.29 | -0.05 |
| 17 | 0.53 | -0.28 | -0.31 | -0.70 |
| 18 | -0.09 | 0.18 | -0.60 | -0.55 |
| 19 | -0.41 | 0.15 | -0.98 | -0.62 |
| 20 | -0.21 | 0.11 | -1.20 | -0.30 |
China internet stocks led the ETFs: KWEB closed +3.88% on volume running at 3.2× the typical session pace. Alibaba rallied on target increases from Jefferies and Citi, while China's Ministry of Finance released a record 550 billion yuan local-debt quota. The ETFs below show how far apart the day's stories pulled: biotech, China internet and gold miners led, while communication services and oil producers lagged.
| ETF | Theme | Today (session) | 1d Ago | 5d Ago | 20d Ago | 63d Ago |
|---|---|---|---|---|---|---|
| KWEB | China internet | +3.88% | -1.27% | -1.27% | -1.72% | -8.95% |
| XBI | Biotech | +3.00% | -0.63% | -3.38% | -4.80% | -6.12% |
| GDX | Gold miners | +2.95% | +1.47% | -0.02% | -9.69% | +14.82% |
| IGV | Software | +2.74% | -0.23% | +1.26% | +8.29% | +18.59% |
| XLRE | Real estate | +1.89% | +0.69% | +0.42% | -4.32% | -7.33% |
| SPY | Large cap | +0.59% | -0.42% | +1.30% | +2.38% | +2.77% |
| SMH | Semiconductors | -0.65% | -2.84% | -1.71% | +8.39% | -0.62% |
| XOP | Oil & gas E&P | -1.06% | +2.79% | +4.99% | -0.61% | +22.52% |
| XLC | Communication services | -1.53% | +0.73% | +1.94% | +0.83% | +0.70% |
Moves specific to individual stocks explained 77.1% of cross-sectional variance, against a 65.3% one-year average. Style factors explained only 12.9%. Realized pairwise correlation over 20 days is 8.48%, the 5.0th percentile since 2020 and its lowest since September 16. Measured against the past three months it sits at the 63.5th percentile, so the low is a level that is holding, not a new extreme. Implied single-stock correlation (Cboe COR1M) is 7.05, in the lowest 0.88% of its 20-year history. Implied single-stock volatility (Cboe VIXEQ) is at the top of its 20-session range at 39.05. Implied index volatility (Cboe VIX), at 14.86, has eased from its September 16 high of 17.71. Options are priced for single stocks to keep moving apart under a calm index, which explains how a shock the size of SpaceX's deal hit three stocks while SPY closed +0.59%. VIXEQ and COR1M are market-wide and look a month ahead, a window that takes in the start of third-quarter earnings season on Tuesday, when correlation between stocks is seasonally at its lowest.
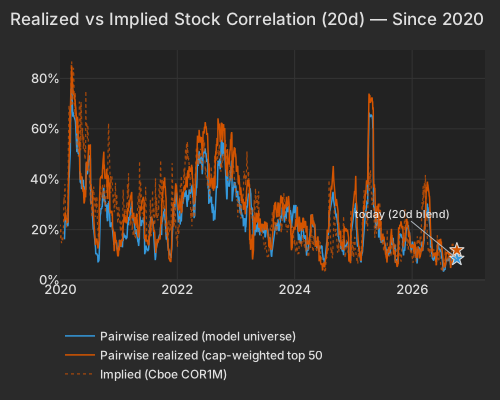
| Series | Today Pct | Prev Close Pct |
|---|---|---|
| pairwise_model | 8.48 | 8.83 |
| pairwise_top500 | 11.88 | 13.01 |
| implied_cor1m |
Several other stocks moved on their own news. Humana (HUM) closed +11.49% after analysts named it the top beneficiary of the 2027 Medicare Advantage star ratings. CNBC Apple (AAPL) closed -1.10% after Nikkei Asia reported cuts of 15% to 20% to October component orders for the iPhone 18 Pro. MarketWatch Bloomberg reported that OpenAI expects annualized revenue of at least $70B by December. Bloomberg Microsoft (MSFT) closed +2.39% and Amazon (AMZN) +3.33%, adding about $179B of market value between them. Software rallied more broadly than either: IGV closed +2.74%, led by Snowflake (SNOW) +7.34%, Palo Alto Networks (PANW) +5.14% and Palantir (PLTR) +5.06%. Chips did not join: the Semiconductors factor fell -0.25% and SMH lost ground. Delta Air Lines (DAL), which reported before the open, closed the session +0.17%.
The two-year Treasury yield rose 3.7 bp to 4.79%, while the 30-year slipped 0.3 bp to 5.60%, flattening the curve from the short end. CNBC The ten-year rose 1.3 bp to 5.25% even as eurozone government bond yields declined. CNBC WSJ Spot gold was $4,194.69 at 4:13 PM ET, up +1.47%. CNBC The Gold factor rose +0.47% at z=+1.4. Crude barely moved after Trump said the U.S. will not strike Iran before the November 3 midterms. NYT WTI was $91.59 at 4:03 PM ET, up +0.11%. CNBC
The University of Michigan's preliminary October consumer sentiment index, released at 10:00 AM ET, fell to 46.3 from 48.1, below the 47.6 consensus data.sca.isr.umich.edu. Year-ahead inflation expectations in the same survey rose to 4.7%, the highest since May. The New York Fed Staff Nowcast, released at 12:45 PM ET, kept its third-quarter growth estimate at 2.5%.
Variance decomposition: live intraday — 20261009 session, bracketed against its trailing-year range. Factor returns are trailing through last close. Total cross-sectional dispersion: 25%ile of the past year.
Variance mix — % of total, today vs 1d ago vs 1-yr avg
market 59%ile style 33%ile thematic 61%ile idiosyncratic 64%ile
Variance explained — today vs. factor's trailing-year range
Marker = the factor's share of today's total variance, placed in its own trailing-year range (box 25–75%ile, ticks 90%ile and max). Amber marker = unusually load-bearing today (≥90%ile of its own year). Factor name green = up today / red = down.
Correlation & dispersion — realized vs implied
Pairwise realized correlation (20d): 8.48% 5.0%ile since 2020 · 64%ile 3m most extreme since 2026-09-16
Top-500 pairwise: 11.88% 13%ile since 2020 · 87%ile 3m · implied (Cboe COR1M): 7.05 0.9%ile of its own history (gap +4.8pp)
Realized 20d vol (ann. pts): all stocks 37 vs VIXEQ 39 · index 10 vs VIX 15 · style factors 17 58%ile
20-day window (19 completed days + today); percentiles vs model history since 2020; '3m' tokens rank vs the trailing 63 trading days; definitions in Terms below. Implied prints (Cboe) are delayed ~15 min. as of 15:58 ET
High-beta momentum cohort (eq-wt, since-2020 rank): +1.7% 75%ile · rest of market +0.3%
| Factor | Today | 1d | 5d | 20d | 60d |
|---|---|---|---|---|---|
| Style-Risk | |||||
| Residual Volatility | +0.41% z+0.8 | -0.02% | +0.96% | +2.24% | +5.53% |
| Beta | +0.39% z+0.4 | -2.00% | -2.46% | +1.78% | +3.03% |
| International | +0.09% z+0.3 | -0.15% | +0.08% | -0.71% | +0.39% |
| Style | |||||
| Value | -0.47% z-2.0 | +0.26% | -0.38% | -0.49% | +0.06% |
| Liquidity | -0.50% z-1.9 | -0.03% | -0.24% | -0.65% | +3.26% |
| Dividend Yield | -0.26% z-1.5 | +0.13% | -0.54% | -0.82% | -0.39% |
| Profitability | -0.23% z-1.2 | +0.20% | +0.11% | +0.79% | -1.04% |
| Leverage | -0.14% z-0.8 | -0.32% | -0.27% | -1.70% | -4.01% |
| Growth | +0.06% z+0.2 | -0.07% | +0.59% | +1.03% | +1.50% |
| Size | +0.05% z+0.1 | -0.28% | +0.67% | +2.40% | +3.21% |
| Style-Momentum | |||||
| Medium-Term Momentum | +0.39% z+1.4 | -0.10% | +0.18% | +0.02% | +0.02% |
| Short-Term Momentum | +0.26% z+0.9 | -0.11% | +0.80% | +0.53% | -6.78% |
| Long-Term Momentum | +0.14% z+0.2 | -0.30% | -0.96% | +1.60% | +0.88% |
| One-Day Momentum | -0.04% z-0.1 | +0.06% | -0.34% | -2.01% | -2.48% |
| Style-Positioning | |||||
| Hedge-Fund Ownership | +0.18% z+1.6 | -0.06% | +0.24% | -0.24% | -0.64% |
| Short Interest | +0.01% z+0.0 | -0.00% | -0.33% | -0.74% | -2.31% |
| Style-Flow | |||||
| Short-Sale Activity | -0.17% z-1.5 | -0.02% | -0.23% | -0.37% | +0.48% |
| Morning Activity | -0.00% z-0.0 | +0.04% | +0.23% | -0.77% | +1.36% |
| Thematic | |||||
| Gold | +0.46% z+1.4 | -0.03% | +0.02% | -1.08% | +3.47% |
| Bitcoin / Crypto | +0.28% z+0.9 | -0.03% | +0.32% | +0.07% | +2.62% |
| China | +0.34% z+0.8 | -0.13% | +0.55% | +0.40% | +1.32% |
| Semiconductors | -0.25% z-0.4 | -0.87% | -1.77% | -0.82% | -1.74% |
| Oil | -0.08% z-0.2 | +0.16% | +0.23% | +0.47% | +6.15% |
| Treasury (Duration) | +0.01% z+0.0 | +0.36% | +0.02% | -1.57% | -2.94% |
5/20/60d windows include today's session; 1d is the previous session.
Pairwise realized correlation. Index variance net of the weighted idiosyncratic diagonal, over the cross terms — the estimator used for implied-correlation indices. 20-day window unless noted; history since 2020.
Market variance share. The fraction of cross-sectional variance explained by the market factor — the attribution companion to pairwise correlation, not a substitute for it.
Factor z-score. Today's factor return divided by its daily-return standard deviation over ~1,600 trading days.
Stock-specific (idiosyncratic) return. The part of a stock's move not explained by market, style, or thematic factors in our decomposition.
VIXEQ / DSPX / COR1M. Cboe implied indices: single-stock volatility, dispersion, and 1-month implied correlation (top-50 S&P names). Quotes delayed ~15 minutes.
Data compiled by FactorPulse AI; edited and verified by Jeff Klein. For informational purposes only. Does not constitute financial advice, an investment recommendation, or an offer to buy or sell any securities. Always consult a qualified financial professional before making investment decisions.
For more on factor construction methodology, see www.factorpulse.com/glossary.