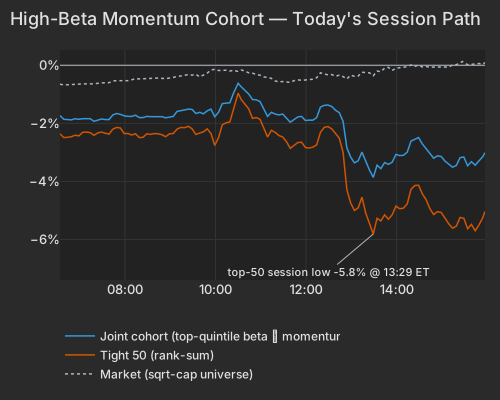
Investors dumped Wall Street's high-beta stocks Thursday: the 50 most sensitive to market moves that also had the best runs over the past year fell about 5%, one of their worst days since 2020. Most other stocks edged up, and the broad market ended roughly flat. The selling was aimed at volatility rather than recent winners: past-year standouts that normally move in step with the market actually rose, while the most volatile stocks fell even without a strong run behind them. AI hardware took the worst of it. Chipmaker Nvidia fell about 3% and AI-hardware maker Coherent about 9%. Bad news from Asia added to the pressure. Samsung forecast a record of roughly $80 billion in third-quarter operating profit, yet its shares fell about 2% in Seoul, and memory-chip maker SK Hynix dropped by a similar amount. An Nvidia-backed company called Firmus also struggled to find enough buyers for its stock-market debut.
Falling interest rates offered no relief. The 10-year Treasury yield slipped to about 5.2% after strong demand at a $22 billion sale of 30-year bonds, even though Fed Governor Christopher Waller had said in Istanbul that more rate hikes are needed. On Wednesday, the same kind of selling had coincided with yields hitting a 24-year high. On Thursday, yields fell and the selling got worse. Real-estate and bond funds bounced after a month of losses. Heavily indebted companies lagged again, extending a slide that has run all quarter. Weekly jobless claims dipped to 197,000, still near historic lows.
Oil went the other way. Iran's attacks on tankers in the Strait of Hormuz and a hurricane threatening U.S. Gulf oil output pushed crude up about 3% to roughly $91 a barrel. Exxon and Chevron each rose about 3%, and consumer-staples stocks gained about 2%, part of a broader rally in the market's steadiest names. In company news, biotech argenx fell about 12% after halting a late-stage trial of its drug for Sjögren's disease because it was unlikely to work. PepsiCo rose about 4% after beating third-quarter estimates, even though it trimmed its full-year outlook.
The high-beta momentum cohort's top 50 names were down -5.22% at 3:56 PM, the 66th-worst session of 1,700 since 2020. The wider ~190-name group lost -3.15%. The roughly 1,200 stocks in neither screen gained +0.89%, and the broad model universe ended near flat. The top 50 fell about 1.66 times as far as the wider group, well above the usual ratio. In other words, the more closely a stock fit the high-beta momentum profile, the more it lost.
The selling built through midday. The top 50 were off less than 1% at 10:30 AM, reached their low at 1:29 PM and won back less than a point by the close.
| Series | Ret Pct |
|---|---|
| joint | -3.15 |
| tight50 | -5.22 |
| market | 0.06 |
| rest | 0.89 |
The trade was already under pressure before today: at Wednesday's close the wider group sat 13.9% below its peak. The ownership data doesn't show who sold. Hedge-Fund Ownership slipped just -0.05% (z=-0.4), and -0.14% on a raw basis. That is too little to pin the move on hedge-fund books. The group leans retail: its names skew heavily toward stocks that habitually trade early in the session. In Wednesday's session it fell on light volume, and the easiest-to-sell names were not sold first. Neither looks like a forced seller.
Beta lost -1.94% at z=-2.0 and by itself explained 40% of stock-level variance. Style factors together explained 44% of the day's variance, double their 22% one-year average. The overall market move explained almost none of it.
Splitting the screen shows where the selling was aimed. Stocks with strong 12-month momentum but ordinary beta rose +0.49%. High-beta stocks without the momentum fell -1.56%. Long-Term Momentum as a factor gave up only -0.27% (z=-0.4). So investors were selling market sensitivity, and the 12-month winners got hit because they carried the most of it.
| Factor | Return | Z-Score | 5d Z | 20d Z | 63d Z | Category | Direction |
|---|---|---|---|---|---|---|---|
| Beta | -1.94% | -2.02 | -0.91 | +0.48 | -0.25 | Style-Risk | High-beta names lagged |
| Leverage | -0.33% | -1.94 | -0.04 | -2.17 | -3.02 | Style | Indebted names lagged |
| Semiconductors | -0.82% | -1.36 | -0.74 | -0.18 | -0.70 | Thematic | Chip-exposed names lagged |
| Long-Term Momentum | -0.27% | -0.42 | -0.6 | +0.5 | -0.3 | Style-Momentum | Barely moved |
| Short-Term Momentum | -0.11% | -0.38 | +1.19 | +0.25 | -2.86 | Style-Momentum | Mild 5-day reversion |
| Hedge-Fund Ownership | -0.05% | -0.41 | -0.27 | -0.85 | -0.58 | Style-Positioning | Flat |
| Oil | +0.19% | +0.39 | +0.41 | +0.15 | +1.49 | Thematic | Small positive |
| Short Interest | -0.03% | -0.17 | -1.26 | -1.26 | -1.65 | Style-Positioning | Flat |
AI hardware stocks were the high-beta extreme. Coherent (COHR) was marked -9.08% and AXT (AXTI) -9.30%, almost all of it from factor exposure. Lumentum (LITE) lost -5.64% even though its stock-specific component was positive. MaxLinear (MXL) -12.92% and Applied Optoelectronics (AAOI) -12.86% lost roughly as much to factor exposure as to their own selling. Wolfspeed (WOLF) shows the force of it best. It carried a +4.56% stock-specific gain and still fell -1.67%, because its factor exposures cost it -6.29%. Nvidia (NVDA) closed -2.92%, and most of that came from style exposure.
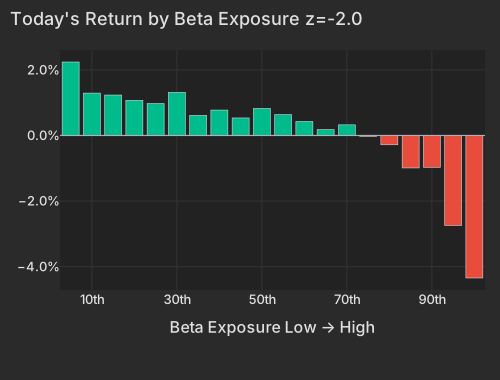
| Bucket | Avg Ret Pct |
|---|---|
| 1 | 2.24 |
| 2 | 1.29 |
| 3 | 1.23 |
| 4 | 1.07 |
| 5 | 0.97 |
| 6 | 1.31 |
| 7 | 0.61 |
| 8 | 0.77 |
| 9 | 0.53 |
| 10 | 0.82 |
| 11 | 0.64 |
| 12 | 0.43 |
| 13 | 0.18 |
| 14 | 0.32 |
| 15 | -0.03 |
| 16 | -0.28 |
| 17 | -0.99 |
| 18 | -0.97 |
| 19 | -2.74 |
| 20 | -4.35 |
Semiconductors added -0.82% (z=-1.4) on top of Beta. Samsung guided to a record ~$80 billion third-quarter operating profit, yet its Seoul shares closed -2.42% and SK Hynix -2.44%. WSJ Nvidia-backed Firmus struggled to fill its IPO order book. Bloomberg Both news items explain part of the chip selling. Neither explains why high-momentum stocks with ordinary beta rose.
The 10-year Treasury yield fell 5.0 bps to 5.227%, and the 30-year fell 5.9 bps to 5.602%. CNBC Indirect bidders took 72.3% of the $22 billion 30-year bond sale, above the 68% average. CNBC That came after Fed Governor Christopher Waller said in Istanbul that more hikes are needed, though not necessarily at back-to-back meetings. WSJ Rate-sensitive funds bounced after a month of losses.
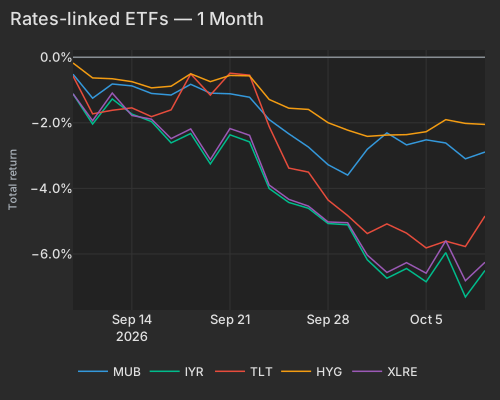
| T | Mub | Iyr | Tlt | Hyg | Xlre |
|---|---|---|---|---|---|
| 2026-09-09 | -0.52 | -1.12 | -0.57 | -0.18 | -1.12 |
| 2026-09-10 | -1.25 | -2.04 | -1.73 | -0.63 | -1.94 |
| 2026-09-11 | -0.82 | -1.27 | -1.62 | -0.66 | -1.09 |
| 2026-09-14 | -0.87 | -1.73 | -1.55 | -0.75 | -1.78 |
| 2026-09-15 | -1.11 | -1.96 | -1.81 | -0.94 | -1.89 |
| 2026-09-16 | -1.15 | -2.61 | -1.61 | -0.88 | -2.48 |
| 2026-09-17 | -0.83 | -2.33 | -0.51 | -0.51 | -2.19 |
| 2026-09-18 | -1.10 | -3.25 | -1.16 | -0.75 | -3.12 |
| 2026-09-21 | -1.12 | -2.37 | -0.49 | -0.56 | -2.18 |
| 2026-09-22 | -1.22 | -2.58 | -0.55 | -0.57 | -2.38 |
| 2026-09-23 | -1.90 | -4.01 | -2.12 | -1.29 | -3.90 |
| 2026-09-24 | -2.34 | -4.43 | -3.38 | -1.55 | -4.34 |
| 2026-09-25 | -2.74 | -4.61 | -3.50 | -1.59 | -4.54 |
| 2026-09-28 | -3.28 | -5.07 | -4.36 | -2.00 | -5.02 |
| 2026-09-29 | -3.60 | -5.11 | -4.83 | -2.22 | -5.05 |
| 2026-09-30 | -2.81 | -6.18 | -5.38 | -2.41 | -6.03 |
| 2026-10-01 | -2.31 | -6.74 | -5.08 | -2.37 | -6.56 |
| 2026-10-02 | -2.67 | -6.44 | -5.36 | -2.36 | -6.26 |
| 2026-10-05 | -2.52 | -6.85 | -5.82 | -2.27 | -6.59 |
| 2026-10-06 | -2.62 | -5.96 | -5.61 | -1.90 | -5.60 |
| 2026-10-07 | -3.10 | -7.31 | -5.77 | -2.02 | -6.82 |
| 2026-10-08 | -2.89 | -6.50 | -4.84 | -2.05 | -6.25 |
Iran's attacks on tankers in the Strait of Hormuz, along with a hurricane threatening U.S. Gulf oil output, drove crude higher. FT NYT WTI stood at $90.83 at 4:04 PM ET, up +2.89%. CNBC Exxon (XOM) rose +2.56% and Chevron (CVX) +2.99%, but the Oil factor gained just +0.19%. Oil producers such as SM Energy (SM) and Kosmos (KOS) sat in the lowest-beta bucket, which gained +2.24%. The energy rally was the other side of the same split by market sensitivity that sank AI hardware.
| ETF | Theme | Today (session) | 1d Ago | 5d Ago | 20d Ago | 63d Ago |
|---|---|---|---|---|---|---|
| XLE | energy | +2.94% | -0.61% | +3.02% | -2.40% | +16.28% |
| XLP | consumer staples | +2.08% | -0.12% | +1.36% | -0.98% | -1.15% |
| TLT | long-term bonds | +0.93% | -0.17% | -0.42% | -5.23% | -7.60% |
| SPY | large cap | -0.45% | -0.24% | +1.91% | +2.20% | +3.65% |
| MTUM | momentum | -1.46% | -0.63% | +1.60% | +4.46% | +0.58% |
| SMH | semiconductors | -2.91% | -1.18% | +2.63% | +8.84% | +2.85% |
| EWY | south korea | -4.11% | -1.45% | +0.50% | -3.72% | -0.57% |
| DRAM | memory chips & storage | -5.12% | +0.82% | -0.58% | -2.55% | -6.76% |
| WGMI | crypto miners | -6.16% | -4.25% | -4.34% | -10.14% | -24.84% |
Leverage lost -0.33% at z=-1.9, meaning the most indebted companies trailed the least indebted. Its 60-day loss now stands at -3.84%, with z=-3.0 on the 63-day window. Today extended a trend that has been running all quarter. Leverage exposures barely overlap the high-beta momentum screen, so this is a separate trade. The debt-heavy names lagged even as yields fell, which points to balance-sheet risk itself rather than the day's move in rates.
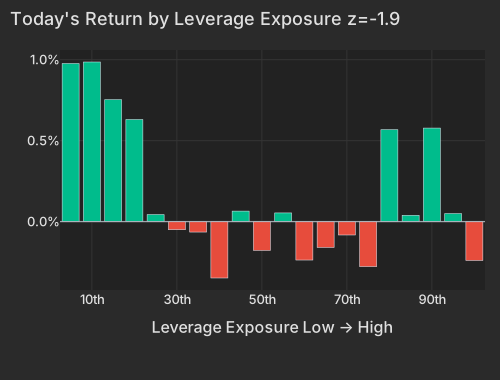
| Bucket | Avg Ret Pct |
|---|---|
| 1 | 0.98 |
| 2 | 0.99 |
| 3 | 0.75 |
| 4 | 0.63 |
| 5 | 0.04 |
| 6 | -0.05 |
| 7 | -0.06 |
| 8 | -0.35 |
| 9 | 0.06 |
| 10 | -0.18 |
| 11 | 0.05 |
| 12 | -0.24 |
| 13 | -0.16 |
| 14 | -0.08 |
| 15 | -0.28 |
| 16 | 0.57 |
| 17 | 0.04 |
| 18 | 0.58 |
| 19 | 0.05 |
| 20 | -0.24 |
argenx (ARGX) closed -11.55% after halting its Phase 3 UNITY study of efgartigimod in Sjögren's disease because it was unlikely to work. WSJ PepsiCo (PEP) closed +3.70% after beating third-quarter estimates, even though it trimmed its full-year outlook. WSJ Humana (HUM) closed -2.33%, then jumped +13.09% in late trading after CMS data showed its largest Medicare Advantage contract had improved its quality score enough to qualify for federal bonus payments.
Initial jobless claims, released at 8:30 AM ET, fell 2,000 to 197,000 for the week ending October 3, below the 200,000 consensus dol.gov. The four-week average eased to 198,000, and continuing claims edged up to 1.716 million.
Variance decomposition: live intraday — 20261008 session, bracketed against its trailing-year range. Factor returns are trailing through last close. Total cross-sectional dispersion: 36%ile of the past year.
Variance mix — % of total, today vs 1d ago vs 1-yr avg
market 6.8%ile style 94.8%ile thematic 94.0%ile idiosyncratic 13%ile
Variance explained — today vs. factor's trailing-year range
Marker = the factor's share of today's total variance, placed in its own trailing-year range (box 25–75%ile, ticks 90%ile and max). Amber marker = unusually load-bearing today (≥90%ile of its own year). Factor name green = up today / red = down.
Correlation & dispersion — realized vs implied
Pairwise realized correlation (20d): 8.90% 6.1%ile since 2020 · 75%ile 3m
Top-500 pairwise: 13.03% 17%ile since 2020 · 96.8%ile 3m · implied (Cboe COR1M): 7.83 1.4%ile of its own history (gap +5.2pp)
Realized 20d vol (ann. pts): all stocks 37 vs VIXEQ 40 · index 10 vs VIX 16 · style factors 17 58%ile
20-day window (19 completed days + today); percentiles vs model history since 2020; '3m' tokens rank vs the trailing 63 trading days; definitions in Terms below. Implied prints (Cboe) are delayed ~15 min. as of 15:58 ET
Top 50 high-beta momentum names (eq-wt, since-2020 rank): -5.2% 3.8%ile worst since 2026-09-14 · rest of market +0.9%
| Factor | Today | 1d | 5d | 20d | 60d |
|---|---|---|---|---|---|
| Style-Risk | |||||
| Beta | -1.94% z-2.0 | -0.79% | -1.96% | +2.08% | -0.32% |
| International | -0.14% z-0.5 | -0.18% | +0.01% | -0.77% | +0.03% |
| Residual Volatility | -0.05% z-0.1 | +0.39% | +0.18% | +1.77% | +4.31% |
| Style | |||||
| Leverage | -0.33% z-1.9 | +0.00% | -0.01% | -1.63% | -3.84% |
| Value | +0.23% z+1.0 | +0.05% | +0.04% | +0.16% | +0.88% |
| Profitability | +0.18% z+1.0 | +0.01% | +0.20% | +1.03% | -0.31% |
| Dividend Yield | +0.12% z+0.7 | -0.01% | -0.37% | -0.65% | -0.08% |
| Size | -0.24% z-0.7 | +0.59% | +0.77% | +2.51% | +2.87% |
| Growth | -0.07% z-0.3 | +0.22% | +0.33% | +0.97% | +1.39% |
| Liquidity | -0.03% z-0.1 | +0.27% | -0.14% | -0.34% | +3.04% |
| Style-Momentum | |||||
| Long-Term Momentum | -0.27% z-0.4 | +0.18% | -0.84% | +1.39% | -0.45% |
| Short-Term Momentum | -0.11% z-0.4 | -0.03% | +0.81% | +0.34% | -6.96% |
| Medium-Term Momentum | -0.11% z-0.4 | +0.03% | +0.00% | -0.62% | +0.00% |
| One-Day Momentum | +0.03% z+0.1 | -0.01% | -0.49% | -1.77% | -2.38% |
| Style-Positioning | |||||
| Hedge-Fund Ownership | -0.05% z-0.4 | +0.16% | -0.07% | -0.42% | -0.80% |
| Short Interest | -0.03% z-0.2 | +0.15% | -0.47% | -0.94% | -2.02% |
| Style-Flow | |||||
| Morning Activity | +0.04% z+0.3 | +0.08% | +0.05% | -0.91% | +1.19% |
| Short-Sale Activity | +0.02% z+0.2 | -0.10% | +0.06% | +0.02% | +0.91% |
| Thematic | |||||
| Semiconductors | -0.82% z-1.4 | -0.23% | -1.00% | -0.48% | -2.18% |
| Treasury (Duration) | +0.31% z+1.0 | +0.05% | -0.40% | -1.83% | -2.71% |
| Oil | +0.19% z+0.4 | +0.01% | +0.43% | +0.31% | +5.43% |
| China | -0.15% z-0.4 | +0.38% | -0.25% | +0.25% | +0.73% |
| Bitcoin / Crypto | -0.04% z-0.1 | +0.13% | -0.44% | -0.30% | +1.67% |
| Gold | -0.00% z-0.0 | -0.26% | -0.32% | -1.87% | +2.68% |
5/20/60d windows include today's session; 1d is the previous session.
Factor z-score. Today's factor return divided by its daily-return standard deviation over ~1,600 trading days.
High-beta momentum cohort. US names above $2B market cap in the top quintile of both raw beta and 12-month momentum; membership frozen at each month's first business day. “Top 50” = the 50 strongest by combined rank.
Stock-specific (idiosyncratic) return. The part of a stock's move not explained by market, style, or thematic factors in our decomposition.
Data compiled by FactorPulse AI; edited and verified by Jeff Klein. For informational purposes only. Does not constitute financial advice, an investment recommendation, or an offer to buy or sell any securities. Always consult a qualified financial professional before making investment decisions.
For more on factor construction methodology, see www.factorpulse.com/glossary.