A record quarter from Samsung that still fell short on sales, plus a nearly 5% jump in oil on violence involving Iran, has investors dumping the market's jumpiest stocks before Thursday's opening bell, with AI chipmakers taking the worst of it. Samsung earned about 107 trillion won (roughly $80 billion) in operating profit, but revenue of 195 trillion won missed forecasts of about 207 trillion. Its shares fell about 2.4% in Seoul, as did those of fellow memory maker SK Hynix. Korean stocks are also absorbing Seoul's decision to recall its top envoy to Ukraine. In U.S. premarket trading, memory-chip maker Micron, chip designer Broadcom and contract chipmaker TSMC are each down around 1.5%. The selling has less to do with chips than with volatility: the market's most volatile stocks are off nearly 2% while the steadiest are up about 1%, giving back part of a month-long run.
Crude is trading near $92 a barrel and energy is the strongest sector, but much of the buying looks like a search for shelter. Exxon Mobil is up 2%, adding about $14 billion in market value, yet roughly half of that gain reflects its standing as a steady stock, with oil itself accounting for a smaller share. Food and beverage giant PepsiCo is up about 1% even after cutting its 2026 outlook because its North American turnaround is taking longer than planned, though its quarterly profit rose.
Higher interest rates aren't driving this morning's selling, even as yields climb. The 10-year Treasury yield is up to about 5.3%, and the 30-year, near 5.7%, is close to levels last seen in 2002, after Fed Governor Christopher Waller said in Istanbul that more rate hikes are needed, though not necessarily at back-to-back meetings. Yet stocks that usually suffer when yields rise are holding steady. Heavily indebted companies have lagged over the past three months as borrowing costs sit at 24-year highs, but they're flat today. Initial jobless claims fell to 197,000, and the next test for long-term rates comes at 1 p.m., when the Treasury auctions $22 billion of 30-year bonds.
Samsung Electronics reported preliminary third-quarter operating profit of 107.4 trillion won, up 782.5% from a year earlier. WSJ Revenue of 195 trillion won still fell short of the 206.8 trillion won FactSet consensus. SK Hynix closed -2.44% in Seoul alongside Samsung. Micron (MU) was down -1.7% in US pre-market trading at 8:39 AM ET. Separately, Nvidia-backed Firmus is struggling to close the books on its IPO, a second sign this morning that appetite for AI hardware is cooling. Bloomberg Korean stocks face a second hit after Seoul said it would recall its top envoy to Ukraine. Bloomberg
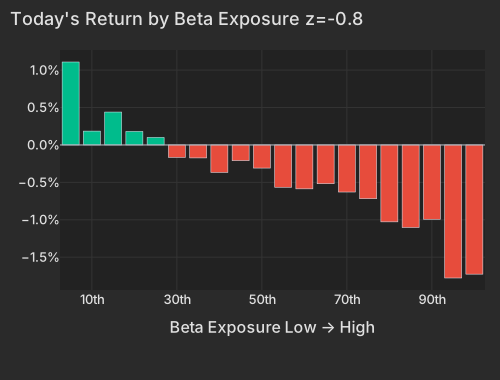
In the factor model, the highest-beta bucket is down -1.73%, led by Astera Labs (ALAB), AXT (AXTI), Ouster (OUST) and Aehr Test Systems (AEHR). The lowest-beta bucket is up +1.1%. Aehr (-2.15%) and CEVA (-2.66%) are falling almost entirely on their factor exposures, with little left over that is specific to either company. Among the megacaps, Broadcom (AVGO) is off -1.65% and TSMC (TSM) -1.43%. With the Semiconductors factor at -0.12%, the loss tracks how much market risk a stock carries rather than which industry it is in. That is why GlobalFoundries (GFS) is up +4.05% and Wolfspeed (WOLF) +15.48%, both on moves specific to the company. Neither move has a driver in the coverage yet.
| Factor | Return | Z-Score | 5d Z | 20d Z | 63d Z | Category | Direction |
|---|---|---|---|---|---|---|---|
| Beta | -0.80% | -0.84 | -0.38 | 0.75 | -0.10 | Style-Risk | High-beta names lagging |
| Oil | +0.38% | 0.80 | 0.59 | 0.24 | 1.54 | Thematic | Oil-exposed names leading |
| Hedge-Fund Ownership | -0.07% | -0.62 | -0.37 | -0.90 | -0.61 | Style-Positioning | Hedge-fund-heavy names lagging |
| Treasury (Duration) | +0.11% | 0.33 | -0.84 | -1.41 | -0.96 | Thematic | Duration-sensitive names firm |
| Dividend Yield | +0.06% | 0.32 | -1.11 | -0.92 | -0.16 | Style | High payers slightly ahead |
| Semiconductors | -0.12% | -0.20 | -0.2 | +0.1 | -0.6 | Thematic | Little chip-specific selling |
| Leverage | -0.05% | -0.33 | 0.68 | -1.81 | -2.82 | Style | Indebted names still lagging |
| Short-Term Momentum | +0.05% | 0.16 | 1.43 | 0.38 | -2.80 | Style-Momentum | Last week's movers flat |
| Bucket | Avg Ret Pct |
|---|---|
| 1 | 1.11 |
| 2 | 0.18 |
| 3 | 0.44 |
| 4 | 0.18 |
| 5 | 0.10 |
| 6 | -0.17 |
| 7 | -0.17 |
| 8 | -0.37 |
| 9 | -0.21 |
| 10 | -0.31 |
| 11 | -0.57 |
| 12 | -0.59 |
| 13 | -0.52 |
| 14 | -0.63 |
| 15 | -0.72 |
| 16 | -1.03 |
| 17 | -1.10 |
| 18 | -0.99 |
| 19 | -1.78 |
| 20 | -1.73 |
This morning's drop gives back part of a month of gains, with Beta up +3.21% over the past 20 sessions. Chip ETFs show the same pattern. SPDR S&P Semiconductor (SMH) is now giving back a 20-day run. The Roundhill Memory ETF (DRAM) was already down over the quarter before Samsung reported. The top 50 high-beta momentum names are down -2.34% against -0.21% for the rest of the market, an ordinary gap by that group's history since 2020.
| ETF | Theme | Today | 1d Ago | 5d Ago | 20d Ago | 63d Ago |
|---|---|---|---|---|---|---|
| USO | oil | +3.82% | -0.69% | -1.20% | -4.04% | +32.02% |
| XLE | energy | +1.89% | -0.61% | +3.02% | -2.40% | +16.28% |
| XLP | consumer staples | +0.38% | -0.12% | +1.36% | -0.98% | -1.15% |
| TLT | long-term bonds | -0.34% | -0.17% | -0.42% | -5.23% | -7.60% |
| IWM | small cap | -0.78% | -1.29% | -0.07% | -4.20% | -6.33% |
| SMH | semiconductors | -1.67% | -1.18% | +2.63% | +8.84% | +2.85% |
| EWY | south korea | -2.29% | -1.45% | +0.50% | -3.72% | -0.57% |
| DRAM | memory chips & storage | -2.35% | +0.82% | -0.58% | -2.55% | -6.76% |
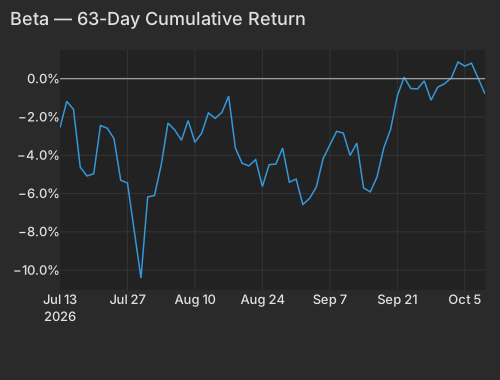
| Factor | Display Name | Cumret Pct |
|---|---|---|
| beta | Beta | -0.80 |
WTI crude is at $92.43 as of 8:37 AM ET, up +4.7% on the day. The jump followed an outbreak of violence in the Middle East involving Iran. NYT Energy is the strongest sector, up +1.38%, and Exxon Mobil is up +2.02%, adding $13.6B of market value. Exxon's low Beta exposure accounts for about +1.05% of its move. Oil and the other thematic factors add only +0.59%. The Oil factor is up just +0.38% (z=0.80), a muted response to a near-5% move in crude. SM Energy (+3.37%) and Murphy Oil (+3.03%) are also rising almost entirely on factor exposure. Energy stocks are being bought as somewhere to hide from Beta as much as a bet on crude.
PepsiCo (PEP) is in the same low-beta group, up +1.09% and adding $1.8B of market value. That is despite cutting its 2026 outlook because its North American turnaround is taking longer than planned, though quarterly profit rose. WSJ Among other single-stock movers, argenx (ARGX) is down -14.09%, erasing $8.2B of market value. Reuters reported that the company is stopping its Phase 3 UNITY trial in Sjögren's disease after an interim analysis found it unlikely to succeed. Haemonetics (HAE) is up +17.49% after disclosing a supply agreement under which CSL Plasma will roll out its NexSys PCS devices across its US collection centers by 2027.
The ten-year Treasury yield is at 5.324%, up 4.7 basis points, and the two-year is up 5.4 basis points to 4.818%. Short-dated yields are rising faster after Fed Governor Christopher Waller said in Istanbul that more rate hikes are needed, though they need not come at consecutive meetings. WSJ The 30-year yield, at 5.692%, is near levels last seen in 2002. Even so, the Treasury (Duration) factor is up +0.11%, after losing -2.03% over the past 20 sessions. Dividend Yield is also slightly positive. Stocks that trade like bonds are holding up this morning, which puts Samsung and AI hardware ahead of yields as the driver of the Beta move.
Higher yields are still taking a slower toll on companies with heavy debt. The Leverage factor has lost -3.57% over 60 sessions as the most indebted companies lagged, but it is flat this morning at -0.05%. Borrowing costs at 24-year highs are shaping the quarter, not this morning's moves.
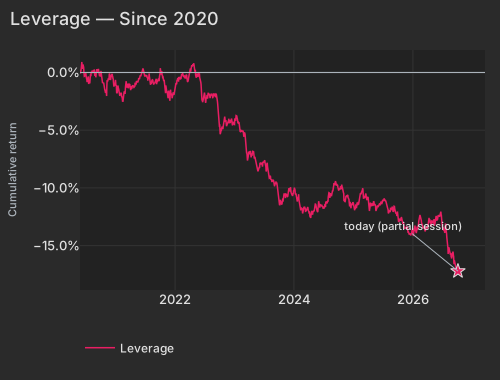
| Date | Cumret Pct |
|---|---|
| 2020-05-27 | -0.00 |
| 2020-06-18 | 0.46 |
| 2020-07-13 | -0.38 |
| 2020-08-04 | 0.05 |
| 2020-08-26 | -0.29 |
| 2020-09-18 | 0.14 |
| 2020-10-12 | -0.75 |
| 2020-11-03 | -1.49 |
| 2020-11-25 | -0.12 |
| 2020-12-18 | -0.83 |
| 2021-01-13 | -1.34 |
| 2021-02-05 | -1.83 |
| 2021-03-02 | -1.57 |
| 2021-03-24 | -0.96 |
| 2021-04-16 | -1.18 |
| 2021-05-10 | -0.74 |
| 2021-06-02 | -0.26 |
| 2021-06-24 | -0.04 |
| 2021-07-19 | -0.71 |
| 2021-08-10 | -0.84 |
| 2021-09-01 | -0.84 |
| 2021-09-24 | -0.74 |
| 2021-10-18 | -0.42 |
| 2021-11-09 | -1.46 |
| 2021-12-02 | -2.02 |
| 2021-12-27 | -1.94 |
| 2022-01-19 | -0.70 |
| 2022-02-10 | -0.22 |
| 2022-03-07 | -0.47 |
| 2022-03-29 | -0.32 |
| 2022-04-21 | 0.72 |
| 2022-05-13 | -0.14 |
| 2022-06-07 | -0.45 |
| 2022-06-30 | -2.09 |
| 2022-07-25 | -1.81 |
| 2022-08-16 | -1.91 |
| 2022-09-08 | -2.09 |
| 2022-09-30 | -4.71 |
| 2022-10-24 | -4.91 |
| 2022-11-15 | -4.65 |
| 2022-12-08 | -4.31 |
| 2023-01-03 | -4.50 |
| 2023-01-26 | -4.46 |
| 2023-02-17 | -5.05 |
| 2023-03-14 | -6.12 |
| 2023-04-05 | -6.83 |
| 2023-04-28 | -6.85 |
| 2023-05-22 | -8.36 |
| 2023-06-14 | -7.86 |
| 2023-07-10 | -7.79 |
| 2023-08-01 | -8.84 |
| 2023-08-23 | -9.47 |
| 2023-09-15 | -9.46 |
| 2023-10-09 | -11.47 |
| 2023-10-31 | -11.12 |
| 2023-11-22 | -10.73 |
| 2023-12-15 | -10.29 |
| 2024-01-10 | -10.18 |
| 2024-02-02 | -11.02 |
| 2024-02-27 | -12.18 |
| 2024-03-20 | -11.96 |
| 2024-04-12 | -12.54 |
| 2024-05-06 | -11.96 |
| 2024-05-29 | -12.09 |
| 2024-06-21 | -11.63 |
| 2024-07-16 | -11.65 |
| 2024-08-07 | -10.50 |
| 2024-08-29 | -10.30 |
| 2024-09-23 | -9.67 |
| 2024-10-15 | -10.04 |
| 2024-11-06 | -11.15 |
| 2024-11-29 | -10.61 |
| 2024-12-23 | -11.44 |
| 2025-01-17 | -11.50 |
| 2025-02-11 | -10.81 |
| 2025-03-06 | -10.95 |
| 2025-03-28 | -10.84 |
| 2025-04-22 | -11.33 |
| 2025-05-14 | -11.50 |
| 2025-06-06 | -11.64 |
| 2025-07-01 | -11.12 |
| 2025-07-24 | -11.32 |
| 2025-08-15 | -11.97 |
| 2025-09-09 | -11.90 |
| 2025-10-01 | -12.04 |
| 2025-10-23 | -12.80 |
| 2025-11-14 | -13.51 |
| 2025-12-09 | -13.84 |
| 2026-01-02 | -13.47 |
| 2026-01-27 | -13.77 |
| 2026-02-19 | -12.49 |
| 2026-03-13 | -13.36 |
| 2026-04-07 | -13.32 |
| 2026-04-29 | -13.07 |
| 2026-05-21 | -12.82 |
| 2026-06-15 | -12.46 |
| 2026-07-09 | -13.50 |
| 2026-07-31 | -14.27 |
| 2026-08-24 | -15.79 |
| 2026-09-16 | -16.35 |
| 2026-10-08 | -17.21 |
Options traders expect single stocks, not the index, to keep doing the moving. Implied single-stock correlation (Cboe COR1M) is still at 8.01, in the lowest 1.65% of its 20-year history. Implied single-stock volatility (Cboe VIXEQ) is at 39.13, the top of its 20-session range, while the VIX sits at 15.69. The next test for the long end comes at 1:00 PM ET, when the Treasury sells $22 billion of 30-year bonds. WSJ
Initial jobless claims, released at 8:30 AM ET, fell to 197,000 from a revised 199,000, and the four-week average dropped to 198,000, the Labor Department said dol.gov. The dollar index is at 102.359, up +0.11% as of 8:48 AM ET and just below its one-year high.
Variance decomposition: live intraday — 20261008 session, bracketed against its trailing-year range. Factor returns are trailing through last close. Total cross-sectional dispersion: 1.6%ile of the past year.
Variance mix — % of total, today vs 1d ago vs 1-yr avg
market 72%ile style 87%ile thematic 78%ile idiosyncratic 18%ile
Variance explained — today vs. factor's trailing-year range
Marker = the factor's share of today's total variance, placed in its own trailing-year range (box 25–75%ile, ticks 90%ile and max). Amber marker = unusually load-bearing today (≥90%ile of its own year). Factor name green = up today / red = down.
Correlation & dispersion — realized vs implied
Pairwise realized correlation (20d): 9.89% 8.7%ile since 2020 · 93.7%ile 3m
Top-500 pairwise: 14.40% 22%ile since 2020 · 100.0%ile 3m · implied (Cboe COR1M): 8.01 1.6%ile of its own history (gap +6.4pp)
Realized 20d vol (ann. pts): all stocks 36 vs VIXEQ 39 · index 10 vs VIX 16 · style factors 16 51%ile
20-day window (19 completed days + today); percentiles vs model history since 2020; '3m' tokens rank vs the trailing 63 trading days; definitions in Terms below. Implied prints (Cboe) are delayed ~15 min. as of 08:41 ET
Top 50 high-beta momentum names (eq-wt, since-2020 rank): -2.3% 17%ile · rest of market -0.2%
| Factor | Today | 1d | 5d | 20d | 60d |
|---|---|---|---|---|---|
| Style-Risk | |||||
| Beta | -0.81% z-0.8 | -0.79% | -0.83% | +3.21% | +0.81% |
| International | -0.12% z-0.4 | -0.18% | +0.04% | -0.74% | +0.06% |
| Residual Volatility | +0.02% z+0.0 | +0.39% | +0.25% | +1.84% | +4.38% |
| Style | |||||
| Profitability | -0.07% z-0.4 | +0.01% | -0.05% | +0.78% | -0.56% |
| Leverage | -0.05% z-0.3 | +0.00% | +0.26% | -1.36% | -3.57% |
| Dividend Yield | +0.06% z+0.3 | -0.01% | -0.43% | -0.72% | -0.15% |
| Value | +0.07% z+0.3 | +0.05% | -0.11% | +0.00% | +0.72% |
| Liquidity | +0.07% z+0.3 | +0.27% | -0.04% | -0.23% | +3.15% |
| Growth | +0.02% z+0.1 | +0.22% | +0.42% | +1.06% | +1.48% |
| Size | +0.03% z+0.1 | +0.59% | +1.04% | +2.78% | +3.14% |
| Style-Momentum | |||||
| Medium-Term Momentum | -0.05% z-0.2 | +0.03% | +0.06% | -0.57% | +0.06% |
| Short-Term Momentum | +0.05% z+0.2 | -0.03% | +0.97% | +0.51% | -6.80% |
| One-Day Momentum | +0.03% z+0.1 | -0.01% | -0.48% | -1.76% | -2.38% |
| Long-Term Momentum | +0.04% z+0.1 | +0.18% | -0.53% | +1.70% | -0.14% |
| Style-Positioning | |||||
| Hedge-Fund Ownership | -0.06% z-0.6 | +0.16% | -0.09% | -0.44% | -0.82% |
| Short Interest | +0.02% z+0.1 | +0.15% | -0.42% | -0.90% | -1.97% |
| Style-Flow | |||||
| Short-Sale Activity | +0.03% z+0.2 | -0.10% | +0.07% | +0.02% | +0.91% |
| Morning Activity | +0.01% z+0.1 | +0.08% | +0.02% | -0.94% | +1.17% |
| Thematic | |||||
| Oil | +0.38% z+0.8 | +0.01% | +0.63% | +0.51% | +5.62% |
| Treasury (Duration) | +0.11% z+0.3 | +0.05% | -0.60% | -2.03% | -2.92% |
| Gold | -0.10% z-0.3 | -0.26% | -0.41% | -1.96% | +2.59% |
| Semiconductors | -0.12% z-0.2 | -0.23% | -0.29% | +0.23% | -1.48% |
| Bitcoin / Crypto | -0.02% z-0.1 | +0.13% | -0.41% | -0.27% | +1.70% |
| China | -0.02% z-0.0 | +0.38% | -0.11% | +0.39% | +0.87% |
5/20/60d windows include today's session; 1d is the previous session.
Factor z-score. Today's factor return divided by its daily-return standard deviation over ~1,600 trading days.
High-beta momentum cohort. US names above $2B market cap in the top quintile of both raw beta and 12-month momentum; membership frozen at each month's first business day. “Top 50” = the 50 strongest by combined rank.
VIXEQ / DSPX / COR1M. Cboe implied indices: single-stock volatility, dispersion, and 1-month implied correlation (top-50 S&P names). Quotes delayed ~15 minutes.
Data compiled by FactorPulse AI; edited and verified by Jeff Klein. For informational purposes only. Does not constitute financial advice, an investment recommendation, or an offer to buy or sell any securities. Always consult a qualified financial professional before making investment decisions.
For more on factor construction methodology, see www.factorpulse.com/glossary.