The 10-year Treasury yield touched its highest level since 2002 on Wednesday, and the selling it set off fell mostly on smaller companies while the giants held up. The typical stock dropped about 1.3%, but the S&P 500, which is weighted toward the biggest names, slipped only about 0.2%. Strong demand at a 10-year note auction later pulled the yield back to about 5.28%, still slightly higher on the day. Inflation was the backdrop. The typical stock hit its low just before 11:30 a.m., minutes after a New York Fed survey showed households expecting 3.9% inflation over the next year, up 0.3 point. Minutes from the Fed's September meeting, released in the afternoon, showed all 19 officials backed that month's rate increase and a majority saw one more as likely appropriate.
Size was the dividing line. Amazon rose about 1.4%, adding roughly $41 billion in market value, and drugmaker Eli Lilly gained about 2.6%. The small-company Russell 2000 has now trailed the S&P 500 by more than six percentage points over the past month. Homebuilder stocks fell about 2.6%, and regional banks and real-estate funds each lost roughly 1.5%. Those losses tracked their tilt toward smaller, jumpier stocks more than any extra hit from rising rates. Speculative AI-hardware stocks fell hardest. There was little sign of forced selling by hedge funds, because their favorite stocks held up.
Equipment maker Caterpillar fell nearly 6%, erasing about $23 billion in market value, after the FTC and the Agriculture Department opened a joint inquiry into competition and repair restrictions in farm equipment. Barron's tied a decline in tractor maker Deere to the same pressure. Gold fell about 1.4% to roughly $4,100 as the dollar climbed to near its one-year high, and bitcoin slid about 2.4% to around $83,500. Trading app Webull tumbled about 19% after the House Select Committee on China found that its ties to China pose a national-security risk.
The ten-year Treasury yield touched its highest level since 2002 before strong demand at the 10-year note auction pulled it back Bloomberg Bloomberg. It still ended up 1.3 basis points at 5.28% CNBC. The two-year fell 2.1 basis points to 4.77% CNBC. The 30-year rose 2.6 basis points to 5.67%, so the curve steepened from the long end CNBC. Minutes from the September meeting showed all 19 Fed participants backed the hike, citing persistent inflation and the AI buildout Bloomberg. The average stock hit its session low at 11:23, minutes after the New York Fed's 11:00 survey showed households expecting faster inflation.
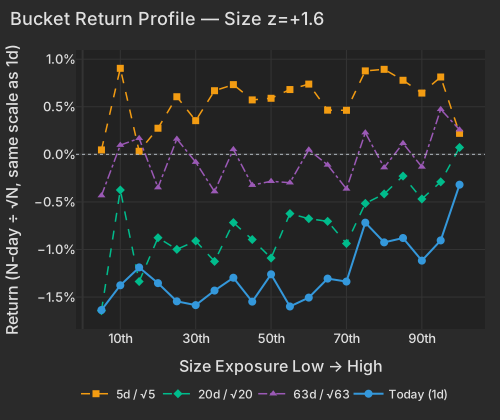
Size returned +0.57% at z=+1.6, a session in the 95.6th percentile since 2020 for large stocks beating small ones. Across our roughly 1,800-stock universe the equal-weighted return was -1.28%, while SPY lost -0.22%. Amazon (AMZN) rose +1.40%, adding about $41B of market value, and size was its biggest factor tailwind. Eli Lilly (LLY) gained +2.57%, most of it from its size and growth exposure. Micron (MU) rose +3.99% and added about $46B on a move that was almost entirely its own, with no reported driver. Taiwan Semiconductor (TSM) bucked the large-cap pattern, falling -1.95% and erasing about $50B.
| Factor | Return | Z-Score | 5d Z | 20d Z | 63d Z | Category | Direction |
|---|---|---|---|---|---|---|---|
| Size | +0.57% | +1.6 | +1.0 | +1.9 | +1.2 | Style | Large caps beat small caps |
| Beta | -0.78% | -0.8 | +0.1 | +0.7 | -0.1 | Risk | Market-sensitive names lagged |
| Hedge-Fund Ownership | +0.17% | +1.6 | -0.8 | -0.9 | -0.5 | Positioning | Hedge-fund-owned names held up |
| Liquidity | +0.29% | +1.1 | -0.1 | -0.2 | +1.3 | Style | Lowest-turnover names lagged |
| Residual Volatility | +0.41% | +0.8 | +0.5 | +0.7 | +0.8 | Risk | Volatile names beat calm ones |
| Short-Sale Activity | -0.11% | -1.0 | +0.2 | +0.3 | +1.0 | Flow | Yesterday's heavily short-sold names lagged |
| Short Interest | +0.14% | +0.8 | -1.8 | -1.2 | -1.7 | Positioning | Most-shorted names edged ahead |
| Treasury (Duration) | +0.06% | +0.2 | -1.4 | -1.7 | -0.9 | Thematic | Flat |
Today extends a month-long lead for large caps. Size has gained +3.00% over 20 sessions at z=+1.9. Over the same stretch the Russell 2000 fund (IWM) has trailed SPY by more than six percentage points. Hedge-fund-owned stocks also held up: Hedge-Fund Ownership returned +0.17% at z=+1.6, and +0.32% at z=+2.2 on a raw basis. The losses landed on smaller stocks rather than hedge funds' favorite longs, which argues against forced selling by funds.
| Bucket | Ret 1D Pct | Ret 5D Norm Pct | Ret 20D Norm Pct | Ret 63D Norm Pct |
|---|---|---|---|---|
| 1 | -1.64 | 0.05 | -1.64 | -0.43 |
| 2 | -1.38 | 0.90 | -0.37 | 0.10 |
| 3 | -1.19 | 0.03 | -1.34 | 0.17 |
| 4 | -1.35 | 0.27 | -0.88 | -0.35 |
| 5 | -1.54 | 0.61 | -1.00 | 0.16 |
| 6 | -1.58 | 0.35 | -0.91 | -0.08 |
| 7 | -1.43 | 0.67 | -1.12 | -0.39 |
| 8 | -1.30 | 0.73 | -0.72 | 0.05 |
| 9 | -1.55 | 0.57 | -0.90 | -0.32 |
| 10 | -1.26 | 0.59 | -1.09 | -0.28 |
| 11 | -1.60 | 0.68 | -0.62 | -0.30 |
| 12 | -1.51 | 0.74 | -0.68 | 0.05 |
| 13 | -1.31 | 0.46 | -0.70 | -0.11 |
| 14 | -1.34 | 0.46 | -0.94 | -0.36 |
| 15 | -0.72 | 0.88 | -0.52 | 0.23 |
| 16 | -0.93 | 0.89 | -0.42 | -0.14 |
| 17 | -0.88 | 0.78 | -0.23 | 0.12 |
| 18 | -1.12 | 0.64 | -0.47 | -0.13 |
| 19 | -0.90 | 0.81 | -0.29 | 0.47 |
| 20 | -0.32 | 0.22 | 0.07 | 0.26 |
Beta accounted for the largest share of stock moves explained by any single factor today, 7.7% of the total, and it lost -0.78% (z=-0.8). The most market-sensitive twentieth of stocks fell -3.1%, led by Ouster (OUST), AXT (AXTI), Applied Optoelectronics (AAOI), Aehr Test Systems (AEHR) and Astera Labs (ALAB). Himax (HIMX, -4.11%), Kopin (KOPN, -5.74%) and indie Semiconductor (INDI, -3.86%) fell almost entirely on their market sensitivity, with little company-specific news. The drop trims a month in which Beta gained +2.87%. Stocks with both high beta and strong 12-month returns fell -2.73% against -0.91% for the rest of the market, with losses spread evenly across the group.
Penguin Solutions (PENG) went the other way, closing +13.21% after record fiscal fourth-quarter revenue of $566.7 million, up 68% from a year earlier Economic Times. It rallied even though its high-beta exposure cost it about -2.4%.
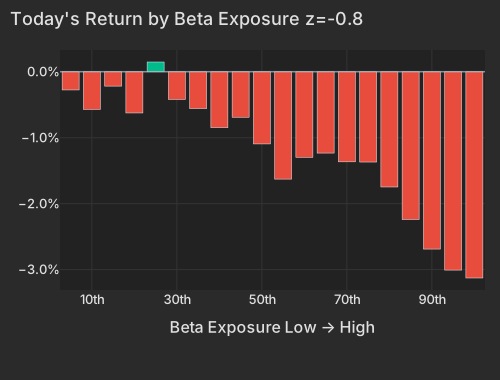
| Bucket | Avg Ret Pct |
|---|---|
| 1 | -0.28 |
| 2 | -0.57 |
| 3 | -0.22 |
| 4 | -0.62 |
| 5 | 0.15 |
| 6 | -0.42 |
| 7 | -0.56 |
| 8 | -0.85 |
| 9 | -0.69 |
| 10 | -1.09 |
| 11 | -1.63 |
| 12 | -1.30 |
| 13 | -1.23 |
| 14 | -1.37 |
| 15 | -1.37 |
| 16 | -1.75 |
| 17 | -2.24 |
| 18 | -2.69 |
| 19 | -3.01 |
| 20 | -3.13 |
The Treasury (Duration) factor returned +0.06% at z=+0.2 on the day the ten-year hit its 2002 high, after losing -2.41% over 20 sessions. Leverage was also flat at +0.02%. Homebuilders, regional banks and real estate funds still fell (table below). With both rate-linked factors flat, those losses came from the funds' exposure to small and market-sensitive stocks rather than from any extra hit for rate sensitivity.
| ETF | Theme | Today | 1d Ago | 5d Ago | 20d Ago | 63d Ago |
|---|---|---|---|---|---|---|
| XLV | healthcare | +0.99% | -0.17% | -2.13% | +0.36% | +3.34% |
| QQQ | large cap growth | -0.22% | +0.46% | +2.94% | +5.86% | +6.89% |
| SPY | large cap | -0.22% | +0.55% | +1.95% | +1.97% | +4.78% |
| MUB | municipal bonds | -0.51% | -0.10% | +1.02% | -2.62% | -4.73% |
| IWM | small cap | -1.32% | -0.72% | +0.84% | -4.27% | -3.88% |
| IYR | real estate | -1.44% | +0.95% | -0.89% | -5.96% | -6.64% |
| MDY | mid cap | -1.62% | +0.41% | +2.24% | -1.50% | -0.71% |
| KRE | regional banks | -1.64% | -0.45% | +0.34% | -5.17% | -3.91% |
| XLI | industrial | -2.17% | +0.87% | +1.45% | -1.36% | -4.65% |
| ITB | homebuilders | -2.56% | +1.60% | -1.62% | -3.70% | -8.58% |
In the bond market, municipal bonds took the most pressure. MUB's decline was more than twice its typical daily move, and it traded at 1.6× the typical session pace.
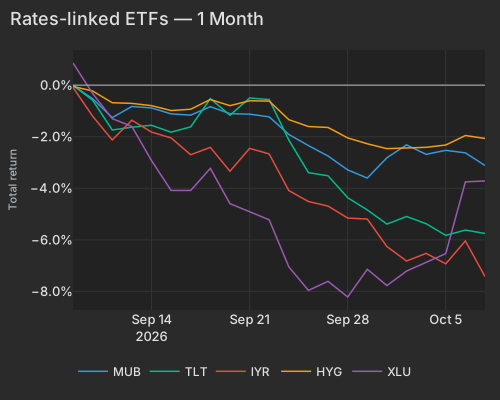
| T | Mub | Tlt | Iyr | Hyg | Xlu |
|---|---|---|---|---|---|
| 2026-09-08 | -0.01 | -0.01 | -0.09 | -0.05 | 0.86 |
| 2026-09-09 | -0.53 | -0.58 | -1.20 | -0.23 | -0.32 |
| 2026-09-10 | -1.26 | -1.74 | -2.12 | -0.68 | -1.30 |
| 2026-09-11 | -0.83 | -1.63 | -1.36 | -0.71 | -1.60 |
| 2026-09-14 | -0.88 | -1.56 | -1.82 | -0.80 | -2.92 |
| 2026-09-15 | -1.12 | -1.82 | -2.05 | -0.99 | -4.09 |
| 2026-09-16 | -1.16 | -1.62 | -2.70 | -0.93 | -4.09 |
| 2026-09-17 | -0.84 | -0.52 | -2.41 | -0.56 | -3.23 |
| 2026-09-18 | -1.11 | -1.17 | -3.34 | -0.80 | -4.60 |
| 2026-09-21 | -1.12 | -0.50 | -2.45 | -0.61 | -4.92 |
| 2026-09-22 | -1.23 | -0.56 | -2.67 | -0.62 | -5.22 |
| 2026-09-23 | -1.91 | -2.13 | -4.09 | -1.34 | -7.05 |
| 2026-09-24 | -2.35 | -3.39 | -4.51 | -1.60 | -7.96 |
| 2026-09-25 | -2.75 | -3.52 | -4.69 | -1.64 | -7.61 |
| 2026-09-28 | -3.29 | -4.37 | -5.15 | -2.05 | -8.22 |
| 2026-09-29 | -3.60 | -4.84 | -5.19 | -2.27 | -7.14 |
| 2026-09-30 | -2.82 | -5.39 | -6.26 | -2.46 | -7.77 |
| 2026-10-01 | -2.32 | -5.09 | -6.82 | -2.42 | -7.21 |
| 2026-10-02 | -2.68 | -5.38 | -6.53 | -2.41 | -6.86 |
| 2026-10-05 | -2.53 | -5.83 | -6.93 | -2.32 | -6.53 |
| 2026-10-06 | -2.63 | -5.62 | -6.04 | -1.95 | -3.75 |
| 2026-10-07 | -3.12 | -5.75 | -7.42 | -2.07 | -3.72 |
Caterpillar (CAT) closed the session down -5.86%, erasing about $23B of market value. The FTC and USDA had opened a joint inquiry into competition and repair restrictions in agricultural equipment FTC. About 70% of the move was specific to Caterpillar, a stock-specific drop in the top 1% of its past year. Barron's linked Deere's (DE) decline to the same regulatory pressure. The financing-cost argument has less support: if higher borrowing costs for equipment buyers were being priced, the Leverage factor should have moved, and it was flat.
Among other single stocks, Hess Midstream (HESM, -14.45%) and Black Hills (BKH, +7.31%) posted the session's largest company-specific moves. Both were tied to company announcements that had not been independently confirmed at publication. Wolfspeed (WOLF) closed the session -1.18%, then jumped +24.56% in late trading.
The dollar index rose +0.44% to 102.28 at 4:13 PM ET, just below its 102.54 one-year high set October 5 CNBC. Spot gold fell -1.39% to $4,105.75 at 4:13 PM ET CNBC. Gold miners such as Harmony (HMY), IAMGOLD (IAG) and Equinox (EQX) fell about -5.2% as a group. Bitcoin dropped -2.39% to $83,497 at 4:13 PM ET CNBC. Webull (BULL) closed -19.06% after the House Select Committee on China found that the trading platform's ties to China pose a national-security risk CNBC.
Moves in the broad market explained 19.9% of the variation in individual stock returns today, against a 9.4% one-year average and 2.8% yesterday. Stocks moved together more than usual, and the cap-weighted index hid it because the largest names held up. Over 20 days, realized correlation is 10.0%, still in the 9.2nd percentile since 2020 but higher than 95% of closes in the past three months. Options are priced for less: implied one-month correlation (Cboe COR1M) is 7.91, in the lowest 1.5% of its 20-year history. That is below the 13.2% correlation actually realized among S&P 500 stocks. Implied single-stock volatility (Cboe VIXEQ) is 39.27, at the top of its 20-session range. The VIX sits at 15.01. Options are still priced for stocks to keep moving independently, while realized correlation has been climbing all month.
The New York Fed's Survey of Consumer Inflation Expectations, released at 11:00 AM ET, showed median one-year expectations rising 0.3 percentage points to 3.9%. Three-year expectations were 3.3% and five-year expectations held at 3.0%. The FOMC minutes, released at 2:00 PM ET, showed a majority of officials judging one more rate increase likely appropriate, alongside a "proceed carefully" approach federalreserve.gov Bloomberg. Before the release, markets priced roughly an 85% chance of a December hike Economic Times.
Variance decomposition: live intraday — 20261007 session, bracketed against its trailing-year range. Factor returns are trailing through last close. Total cross-sectional dispersion: 22%ile of the past year.
Variance mix — % of total, today vs 1d ago vs 1-yr avg
market 88%ile style 48%ile thematic 58%ile idiosyncratic 28%ile
Variance explained — today vs. factor's trailing-year range
Marker = the factor's share of today's total variance, placed in its own trailing-year range (box 25–75%ile, ticks 90%ile and max). Amber marker = unusually load-bearing today (≥90%ile of its own year). Factor name green = up today / red = down.
Correlation & dispersion — realized vs implied
Pairwise realized correlation (20d): 10.03% 9.2%ile since 2020 · 95.2%ile 3m
Top-500 pairwise: 13.23% 17%ile since 2020 · 98.4%ile 3m · implied (Cboe COR1M): 7.91 1.5%ile of its own history (gap +5.3pp)
Realized 20d vol (ann. pts): all stocks 37 vs VIXEQ 39 · index 10 vs VIX 15 · style factors 17 53%ile
20-day window (19 completed days + today); percentiles vs model history since 2020; '3m' tokens rank vs the trailing 63 trading days; definitions in Terms below. Implied prints (Cboe) are delayed ~15 min. as of 15:58 ET
High-beta momentum cohort (eq-wt, since-2020 rank): -2.7% 11%ile worst since 2026-09-14 · rest of market -0.9%
| Factor | Today | 1d | 5d | 20d | 60d |
|---|---|---|---|---|---|
| Style-Risk | |||||
| Beta | -0.78% z-0.8 | +0.15% | +0.29% | +2.87% | +1.21% |
| Residual Volatility | +0.41% z+0.8 | -0.34% | +0.52% | +1.64% | +3.86% |
| International | -0.17% z-0.6 | -0.09% | -0.30% | -0.57% | +0.50% |
| Style | |||||
| Size | +0.57% z+1.6 | +0.16% | +0.80% | +3.00% | +3.16% |
| Liquidity | +0.29% z+1.1 | +0.16% | -0.03% | -0.20% | +2.84% |
| Growth | +0.20% z+0.8 | +0.26% | +0.59% | +1.01% | +1.41% |
| Value | +0.05% z+0.2 | +0.09% | +0.31% | -0.20% | +0.67% |
| Leverage | +0.02% z+0.1 | +0.32% | +0.12% | -1.52% | -3.43% |
| Dividend Yield | +0.01% z+0.1 | +0.05% | -0.37% | -0.87% | -0.41% |
| Profitability | +0.00% z+0.0 | +0.12% | +0.35% | +0.85% | -0.66% |
| Style-Momentum | |||||
| Long-Term Momentum | +0.15% z+0.2 | -0.81% | -0.30% | +1.34% | -1.44% |
| One-Day Momentum | -0.04% z-0.1 | -0.41% | -0.28% | -2.01% | -2.84% |
| Medium-Term Momentum | +0.03% z+0.1 | -0.12% | +0.09% | -0.61% | +0.31% |
| Short-Term Momentum | -0.03% z-0.1 | +0.47% | +0.72% | +0.26% | -7.00% |
| Style-Positioning | |||||
| Hedge-Fund Ownership | +0.17% z+1.6 | -0.11% | -0.20% | -0.45% | -0.47% |
| Short Interest | +0.14% z+0.8 | -0.56% | -0.65% | -0.88% | -1.85% |
| Style-Flow | |||||
| Short-Sale Activity | -0.11% z-1.0 | +0.06% | +0.05% | +0.13% | +0.91% |
| Morning Activity | +0.10% z+0.8 | +0.05% | -0.25% | -1.05% | +1.40% |
| Thematic | |||||
| China | +0.37% z+0.9 | -0.37% | -0.21% | +0.59% | +1.24% |
| Gold | -0.25% z-0.8 | -0.25% | -0.89% | -2.24% | +2.70% |
| Bitcoin / Crypto | +0.13% z+0.4 | -0.48% | -0.34% | -0.18% | +1.49% |
| Semiconductors | -0.23% z-0.4 | -0.01% | +0.18% | +0.06% | -2.67% |
| Treasury (Duration) | +0.06% z+0.2 | -0.30% | -1.00% | -2.41% | -2.89% |
| Oil | +0.00% z+0.0 | -0.25% | +0.49% | +0.18% | +4.57% |
5/20/60d windows include today's session; 1d is the previous session.
Factor z-score. Today's factor return divided by its daily-return standard deviation over ~1,600 trading days.
Stock-specific (idiosyncratic) return. The part of a stock's move not explained by market, style, or thematic factors in our decomposition.
VIXEQ / DSPX / COR1M. Cboe implied indices: single-stock volatility, dispersion, and 1-month implied correlation (top-50 S&P names). Quotes delayed ~15 minutes.
Data compiled by FactorPulse AI; edited and verified by Jeff Klein. For informational purposes only. Does not constitute financial advice, an investment recommendation, or an offer to buy or sell any securities. Always consult a qualified financial professional before making investment decisions.
For more on factor construction methodology, see www.factorpulse.com/glossary.