The 10-year Treasury yield climbed back to 5.35% Wednesday morning, its highest level since 2002 according to CNBC, ahead of an auction of 10-year notes. This time stocks didn't look past it. The S&P 500 was down about 0.6% by mid-morning after gaining nearly 2% over the prior five sessions. The selling hit last month's AI-hardware winners hardest. Chip stocks Micron and Lam Research fell 3% to 4%, and together with TSMC they shed roughly $100 billion in market value. A semiconductor fund fell 2% on nearly three times its usual volume. Chip stocks had already been pulling back from a gain of nearly 90% this year, so some of the selling may simply be profit-taking after a long run. Bonds themselves have been sliding for weeks, with a long-term Treasury fund down more than 5% over the past month.
Nuclear-power stocks gave back about two-thirds of Tuesday's rebound, which had come on Google's power deal with Constellation Energy. A nuclear fund fell nearly 4%. Gold dropped about 2% to roughly $4,080 as the dollar pushed toward the year high it set Monday. Silver lost 3%, and gold miners fell about 3.5%, extending a monthlong slide in precious metals ahead of the Fed minutes. Oil went the other way. U.S. crude rose about 1.4% to near $91, and Brent climbed back above $100 after fresh Houthi attacks on Saudi energy infrastructure. Health-care stocks gained about 1%.
In company news, Hess Midstream fell about 15% after agreeing to buy Chevron's stake in it for $200 million. As part of the deal, it will cut the fees it charges in the Bakken roughly in half in exchange for contracts that run through 2045, and it lowered its profit outlook. As of mid-morning, two events were still ahead that could set the tone for rates: the New York Fed's survey of consumer inflation expectations at 11 a.m. and the minutes of the Fed's September meeting at 2 p.m. Markets were pricing an 85% chance of a December rate hike, which makes any hint of further tightening in the minutes the afternoon's main test.
CNBC reported Wednesday that the 10-year yield is back at its highest level since 2002, ahead of today's 10-year note auction. The 10-year is at 5.35%, up 7.9 bp on the day. CNBC Long maturities are leading: the 30-year is up 7.9 bp at 5.72%, while the 2-year sits at 4.82%. The bond market itself has been falling for weeks. TLT is down -5.61% over 20 sessions, and MUB's 20-day loss ranks in the worst 2.7% of its history since 2019. The Treasury (Duration) equity factor has fallen in each of the last five sessions and is down -2.61% over 20 days. What changed today is that stocks stopped looking past it. SPY gained +1.95% over the prior five sessions and is down -0.59% this morning.
| Factor | Return | Z-Score | 5d Z | 20d Z | 63d Z | Category | Direction |
|---|---|---|---|---|---|---|---|
| Beta | -1.35% | -1.4 | -0.13 | 0.54 | -0.12 | Style-Risk | High-beta names lagged |
| Gold | -0.47% | -1.46 | -1.53 | -1.70 | 1.09 | Thematic | Gold-exposed names lagged |
| Size | +0.32% | 0.93 | 0.71 | 1.77 | 1.12 | Style | Large caps led |
| Short-Term Momentum | +0.30% | 0.98 | 1.54 | 0.43 | -2.73 | Style-Momentum | Last week's winners kept leading |
| Short Interest | +0.14% | 0.81 | -1.75 | -1.18 | -1.72 | Style-Positioning | Most-shorted names edged ahead |
| Treasury (Duration) | -0.14% | -0.44 | -1.7 | -1.8 | -1.0 | Thematic | Bond-like stocks slightly lower |
| Leverage | +0.03% | 0.18 | 0.32 | -2.01 | -2.72 | Style | Flat after a quarter-long slide |
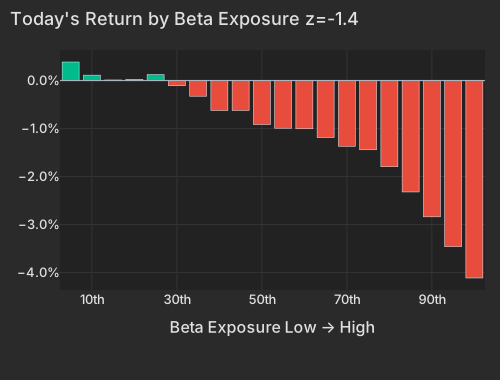
Beta is the session's dominant factor at -1.35%, z=-1.4. It accounts for 32% of today's stock-level variance, a top-decile share for the past year. Most of the loss sits in the highest-beta bucket, down -4.1% and full of AI-hardware names such as AXT (AXTI), Applied Optoelectronics (AAOI) and Astera Labs (ALAB). Micron (MU) is down -2.98% and Lam Research (LRCX) -3.68%, and the model attributes almost none of either move to the companies themselves. Together with TSMC (TSM), those three have lost about $100 billion of market value this morning. SMH is down -2.05% on 2.9× its typical volume. The Philadelphia semiconductor index had already been pulling back from a peak 87.5% year-to-date gain as yields reached 5.3%. Economic Times
| Bucket | Avg Ret Pct |
|---|---|
| 1 | 0.39 |
| 2 | 0.11 |
| 3 | 0.01 |
| 4 | 0.03 |
| 5 | 0.12 |
| 6 | -0.11 |
| 7 | -0.33 |
| 8 | -0.62 |
| 9 | -0.62 |
| 10 | -0.92 |
| 11 | -0.99 |
| 12 | -1.01 |
| 13 | -1.19 |
| 14 | -1.37 |
| 15 | -1.44 |
| 16 | -1.80 |
| 17 | -2.32 |
| 18 | -2.84 |
| 19 | -3.46 |
| 20 | -4.11 |
Yesterday's nuclear rebound is giving back about two-thirds of its gain on day two. NLR is down -3.73% on 2.3× its usual volume, after rising +5.49% on Google's power deal with Constellation Energy. WSJ AIPO, a fund of AI power-infrastructure stocks, is down -2.78% on 4.0× its typical volume, the heaviest relative trading in the ETF universe.
| ETF | Theme | Today | 1d Ago | 5d Ago | 20d Ago | 63d Ago |
|---|---|---|---|---|---|---|
| NLR | nuclear power | -3.73% | +5.49% | +5.08% | -11.44% | -1.49% |
| GDX | gold miners | -3.52% | +0.92% | -0.95% | -10.35% | +19.98% |
| AIPO | AI power infrastructure | -2.78% | +3.62% | +5.18% | +0.43% | -2.69% |
| SMH | semiconductors | -2.05% | -0.22% | +4.22% | +10.24% | +6.66% |
| IWM | small cap | -1.08% | -0.72% | +0.84% | -4.27% | -3.88% |
| TLT | long-term Treasuries | -0.92% | +0.22% | -0.82% | -5.61% | -7.30% |
| MUB | municipal bonds | -0.69% | -0.10% | +1.02% | -2.62% | -4.73% |
| SPY | large cap | -0.59% | +0.55% | +1.95% | +1.97% | +4.78% |
| XLV | healthcare | +1.03% | -0.17% | -2.13% | +0.36% | +3.34% |
| USO | oil | +1.29% | +0.64% | +1.09% | -0.77% | +29.14% |
The table shows bonds, nuclear, semiconductors and gold miners falling, while healthcare and crude rise. Size is up +0.32%, so large companies are holding up better than small caps.
The stocks most sensitive to bond prices are not where the selling is. The Treasury (Duration) factor is down just -0.14% at z=-0.44. The hardest-hit names are instead last month's winners, after Beta gained +2.30% over the prior 20 sessions. That pattern fits profit-taking after a long run as well as it fits a response to higher yields.
Spot gold is at $4,083.20 as of 9:42 AM ET, down -1.93%. CNBC The dollar index is up +0.58% at 102.42, just below the 102.54 year high it set Monday. CNBC The Gold factor is down -0.47% at z=-1.46, and the gold miners in its highest-exposure bucket are off about 5%. SLV is down -3.03% on 2.7× its usual volume. This adds to a month-long slide: the Gold factor has lost -2.46% over 20 sessions, and precious metals are being sold ahead of the Fed minutes. Economic Times Crude is rising against the grain. WTI is at $90.72 as of 9:32 AM ET, up +1.43%. CNBC OilPrice.com reported that Brent moved back above $100 after fresh Houthi attacks on Saudi energy infrastructure.
The market move explained 26.5% of stock-level variance this morning, compared with 2.8% yesterday and a 9.4% one-year average. That ranks at the 80th percentile since 2020: today the index direction is setting stock prices more than company news is. Over 20 days, realized correlation between stocks is still 10.2%, near the bottom of its range since 2020 (9.6th percentile). Implied single-stock correlation (Cboe COR1M) is 8.33, in the lowest 1.9% of its 20-year history. Options are still priced for stocks to keep moving on their own news, but this morning they are moving together.
The slow damage from higher rates shows up in Leverage. The factor has lost -3.42% over the past 60 sessions, a z=-2.7 move on the 63-day window. Today it is flat at +0.03%. More indebted companies have lagged through a quarter of rising yields, but today's selling went to the high-beta names instead.
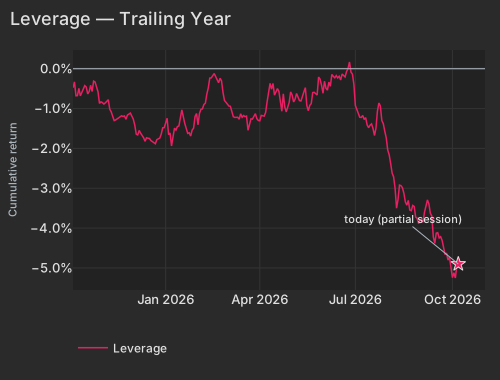
| Date | Cumret Pct |
|---|---|
| 2025-10-06 | -0.48 |
| 2025-10-08 | -0.68 |
| 2025-10-13 | -0.68 |
| 2025-10-15 | -0.50 |
| 2025-10-20 | -0.63 |
| 2025-10-22 | -0.42 |
| 2025-10-27 | -0.33 |
| 2025-10-29 | -0.58 |
| 2025-11-03 | -0.85 |
| 2025-11-05 | -0.86 |
| 2025-11-10 | -1.02 |
| 2025-11-12 | -1.20 |
| 2025-11-17 | -1.26 |
| 2025-11-19 | -1.20 |
| 2025-11-24 | -1.19 |
| 2025-11-26 | -1.16 |
| 2025-12-02 | -1.27 |
| 2025-12-05 | -1.66 |
| 2025-12-09 | -1.62 |
| 2025-12-12 | -1.82 |
| 2025-12-16 | -1.74 |
| 2025-12-19 | -1.84 |
| 2025-12-23 | -1.88 |
| 2025-12-29 | -1.64 |
| 2025-12-31 | -1.48 |
| 2026-01-06 | -1.61 |
| 2026-01-08 | -1.74 |
| 2026-01-13 | -1.45 |
| 2026-01-15 | -1.25 |
| 2026-01-21 | -1.49 |
| 2026-01-23 | -1.61 |
| 2026-01-28 | -1.49 |
| 2026-01-30 | -1.12 |
| 2026-02-04 | -1.02 |
| 2026-02-09 | -0.87 |
| 2026-02-11 | -0.48 |
| 2026-02-17 | -0.12 |
| 2026-02-19 | -0.26 |
| 2026-02-24 | -0.31 |
| 2026-02-26 | -0.80 |
| 2026-03-03 | -0.94 |
| 2026-03-05 | -1.06 |
| 2026-03-10 | -1.22 |
| 2026-03-12 | -1.27 |
| 2026-03-17 | -1.17 |
| 2026-03-19 | -1.19 |
| 2026-03-24 | -1.26 |
| 2026-03-26 | -1.20 |
| 2026-03-31 | -1.30 |
| 2026-04-02 | -1.17 |
| 2026-04-08 | -0.83 |
| 2026-04-13 | -0.51 |
| 2026-04-15 | -0.66 |
| 2026-04-20 | -0.57 |
| 2026-04-22 | -1.07 |
| 2026-04-27 | -1.08 |
| 2026-04-29 | -0.84 |
| 2026-05-04 | -0.83 |
| 2026-05-06 | -0.62 |
| 2026-05-11 | -0.81 |
| 2026-05-13 | -0.58 |
| 2026-05-18 | -1.05 |
| 2026-05-20 | -0.87 |
| 2026-05-26 | -0.66 |
| 2026-05-28 | -0.26 |
| 2026-06-02 | -0.31 |
| 2026-06-04 | -0.54 |
| 2026-06-09 | -0.14 |
| 2026-06-12 | -0.17 |
| 2026-06-16 | -0.19 |
| 2026-06-22 | -0.21 |
| 2026-06-24 | 0.00 |
| 2026-06-29 | -0.13 |
| 2026-07-01 | -0.92 |
| 2026-07-07 | -1.22 |
| 2026-07-09 | -1.27 |
| 2026-07-14 | -1.48 |
| 2026-07-16 | -1.39 |
| 2026-07-21 | -1.49 |
| 2026-07-23 | -0.86 |
| 2026-07-28 | -1.38 |
| 2026-07-30 | -1.73 |
| 2026-08-04 | -2.38 |
| 2026-08-06 | -2.71 |
| 2026-08-11 | -3.29 |
| 2026-08-14 | -2.99 |
| 2026-08-18 | -3.34 |
| 2026-08-21 | -3.55 |
| 2026-08-25 | -3.43 |
| 2026-08-28 | -3.75 |
| 2026-09-01 | -3.79 |
| 2026-09-04 | -3.60 |
| 2026-09-09 | -3.39 |
| 2026-09-14 | -4.22 |
| 2026-09-16 | -4.13 |
| 2026-09-21 | -4.22 |
| 2026-09-23 | -4.49 |
| 2026-09-28 | -4.80 |
| 2026-09-30 | -5.02 |
| 2026-10-05 | -5.25 |
| 2026-10-07 | -4.90 |
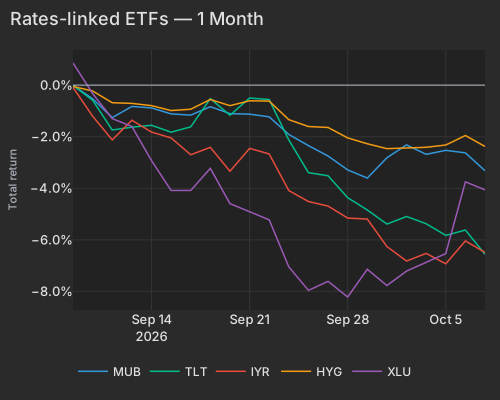
| T | Mub | Tlt | Iyr | Hyg | Xlu |
|---|---|---|---|---|---|
| 2026-09-08 | -0.01 | -0.01 | -0.09 | -0.05 | 0.86 |
| 2026-09-09 | -0.53 | -0.58 | -1.20 | -0.23 | -0.32 |
| 2026-09-10 | -1.26 | -1.74 | -2.12 | -0.68 | -1.30 |
| 2026-09-11 | -0.83 | -1.63 | -1.36 | -0.71 | -1.60 |
| 2026-09-14 | -0.88 | -1.56 | -1.82 | -0.80 | -2.92 |
| 2026-09-15 | -1.12 | -1.82 | -2.05 | -0.99 | -4.09 |
| 2026-09-16 | -1.16 | -1.62 | -2.70 | -0.93 | -4.09 |
| 2026-09-17 | -0.84 | -0.52 | -2.41 | -0.56 | -3.23 |
| 2026-09-18 | -1.11 | -1.17 | -3.34 | -0.80 | -4.60 |
| 2026-09-21 | -1.12 | -0.50 | -2.45 | -0.61 | -4.92 |
| 2026-09-22 | -1.23 | -0.56 | -2.67 | -0.62 | -5.22 |
| 2026-09-23 | -1.91 | -2.13 | -4.09 | -1.34 | -7.05 |
| 2026-09-24 | -2.35 | -3.39 | -4.51 | -1.60 | -7.96 |
| 2026-09-25 | -2.75 | -3.52 | -4.69 | -1.64 | -7.61 |
| 2026-09-28 | -3.29 | -4.37 | -5.15 | -2.05 | -8.22 |
| 2026-09-29 | -3.60 | -4.84 | -5.19 | -2.27 | -7.14 |
| 2026-09-30 | -2.82 | -5.39 | -6.26 | -2.46 | -7.77 |
| 2026-10-01 | -2.32 | -5.09 | -6.82 | -2.42 | -7.21 |
| 2026-10-02 | -2.68 | -5.38 | -6.53 | -2.41 | -6.86 |
| 2026-10-05 | -2.53 | -5.83 | -6.93 | -2.32 | -6.53 |
| 2026-10-06 | -2.63 | -5.62 | -6.04 | -1.95 | -3.75 |
| 2026-10-07 | -3.32 | -6.56 | -6.49 | -2.38 | -4.06 |
Penguin Solutions (PENG) is up +14.24% after fiscal fourth-quarter revenue of $566.7 million beat estimates of $516–521 million. Economic Times Adjusted EPS of $1.00 topped the $0.77–0.78 consensus, and the company guided fiscal 2027 revenue to $2.25–2.60 billion. Economic Times The stock is rising despite the day's factor moves. Its high-beta profile cost it about three points, so the company-specific gain is close to 18%.
Hess Midstream (HESM) is down -15.48%. The company said it will buy Chevron's ownership and general-partner interests for $200 million and cut Bakken tariffs by roughly half in exchange for contracts that run through 2045. It also lowered its 2026 adjusted EBITDA outlook to $1.23–1.25 billion and gave a preliminary 2027 range of $850–950 million. Webull (BULL) is down -18.57%. Utilities NorthWestern Energy (NWE) and Black Hills (BKH) are each up about 7%. All three are stock-specific moves, and none has an identified driver yet.
The New York Fed's Survey of Consumer Inflation Expectations is due at 11:00 AM ET. Consensus expects the one-year median near 3.0%, and investors will watch the three- and five-year horizons for signs that higher energy prices are lifting longer-term expectations. The minutes of the September 15–16 FOMC meeting are due at 2:00 PM ET federalreserve.gov. Markets price an 85% chance of a December hike, so any hint in the minutes about further tightening is this afternoon's main test for rates. Economic Times
Variance decomposition: live intraday — 20261007 session, bracketed against its trailing-year range. Factor returns are trailing through last close. Total cross-sectional dispersion: 6.4%ile of the past year.
Variance mix — % of total, today vs 1d ago vs 1-yr avg
market 93.6%ile style 91.6%ile thematic 36%ile idiosyncratic 2.0%ile
Variance explained — today vs. factor's trailing-year range
Marker = the factor's share of today's total variance, placed in its own trailing-year range (box 25–75%ile, ticks 90%ile and max). Amber marker = unusually load-bearing today (≥90%ile of its own year). Factor name green = up today / red = down.
Correlation & dispersion — realized vs implied
Pairwise realized correlation (20d): 10.20% 9.6%ile since 2020 · 95.2%ile 3m
Top-500 pairwise: 14.41% 22%ile since 2020 · 100.0%ile 3m · implied (Cboe COR1M): 8.33 1.9%ile of its own history (gap +6.1pp)
Realized 20d vol (ann. pts): all stocks 37 vs VIXEQ 38 · index 10 vs VIX 16 · style factors 17 55%ile
20-day window (19 completed days + today); percentiles vs model history since 2020; '3m' tokens rank vs the trailing 63 trading days; definitions in Terms below. Implied prints (Cboe) are delayed ~15 min. as of 09:41 ET
High-beta momentum cohort (eq-wt, since-2020 rank): -2.8% 11%ile worst since 2026-09-14 · rest of market -0.5%
| Factor | Today | 1d | 5d | 20d | 60d |
|---|---|---|---|---|---|
| Style-Risk | |||||
| Beta | -1.35% z-1.4 | +0.15% | -0.27% | +2.30% | +0.65% |
| International | -0.20% z-0.7 | -0.09% | -0.33% | -0.60% | +0.47% |
| Residual Volatility | +0.14% z+0.3 | -0.34% | +0.26% | +1.37% | +3.60% |
| Style | |||||
| Size | +0.32% z+0.9 | +0.16% | +0.55% | +2.76% | +2.91% |
| Value | +0.10% z+0.4 | +0.09% | +0.36% | -0.16% | +0.72% |
| Liquidity | +0.07% z+0.2 | +0.16% | -0.25% | -0.42% | +2.62% |
| Leverage | +0.03% z+0.2 | +0.32% | +0.12% | -1.51% | -3.42% |
| Profitability | +0.02% z+0.1 | +0.12% | +0.38% | +0.87% | -0.64% |
| Growth | +0.02% z+0.1 | +0.26% | +0.42% | +0.84% | +1.24% |
| Dividend Yield | +0.00% z+0.0 | +0.05% | -0.38% | -0.88% | -0.42% |
| Style-Momentum | |||||
| Short-Term Momentum | +0.30% z+1.0 | +0.47% | +1.05% | +0.58% | -6.67% |
| Medium-Term Momentum | +0.23% z+0.8 | -0.12% | +0.29% | -0.41% | +0.51% |
| Long-Term Momentum | +0.19% z+0.3 | -0.81% | -0.26% | +1.38% | -1.40% |
| One-Day Momentum | +0.02% z+0.1 | -0.41% | -0.22% | -1.94% | -2.78% |
| Style-Positioning | |||||
| Short Interest | +0.14% z+0.8 | -0.56% | -0.65% | -0.88% | -1.85% |
| Hedge-Fund Ownership | +0.01% z+0.1 | -0.11% | -0.36% | -0.61% | -0.63% |
| Style-Flow | |||||
| Morning Activity | -0.07% z-0.6 | +0.05% | -0.43% | -1.22% | +1.22% |
| Short-Sale Activity | +0.02% z+0.2 | +0.06% | +0.19% | +0.26% | +1.04% |
| Thematic | |||||
| Gold | -0.47% z-1.5 | -0.25% | -1.10% | -2.46% | +2.48% |
| Treasury (Duration) | -0.14% z-0.4 | -0.30% | -1.20% | -2.61% | -3.10% |
| Oil | +0.09% z+0.2 | -0.25% | +0.58% | +0.27% | +4.66% |
| Semiconductors | -0.08% z-0.1 | -0.01% | +0.33% | +0.20% | -2.52% |
| Bitcoin / Crypto | +0.02% z+0.1 | -0.48% | -0.45% | -0.29% | +1.38% |
| China | +0.02% z+0.1 | -0.37% | -0.56% | +0.24% | +0.90% |
5/20/60d windows include today's session; 1d is the previous session.
Factor z-score. Today's factor return divided by its daily-return standard deviation over ~1,600 trading days.
Stock-specific (idiosyncratic) return. The part of a stock's move not explained by market, style, or thematic factors in our decomposition.
VIXEQ / DSPX / COR1M. Cboe implied indices: single-stock volatility, dispersion, and 1-month implied correlation (top-50 S&P names). Quotes delayed ~15 minutes.
Data compiled by FactorPulse AI; edited and verified by Jeff Klein. For informational purposes only. Does not constitute financial advice, an investment recommendation, or an offer to buy or sell any securities. Always consult a qualified financial professional before making investment decisions.
For more on factor construction methodology, see www.factorpulse.com/glossary.