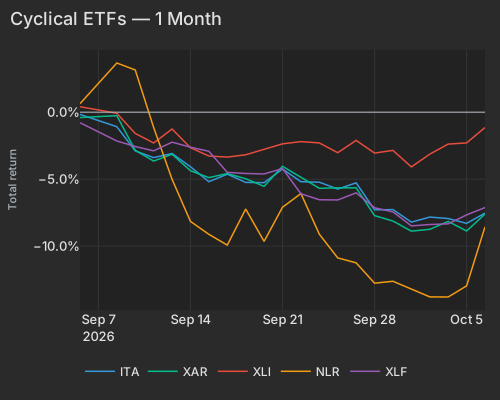
Google's agreement to buy 890 megawatts of nuclear power from upgraded Illinois reactors sent nuclear operator Constellation Energy up about 14% in morning trading, adding roughly $14 billion in market value. Rather than wait for new plants to be built, Google is paying for extra output from reactors already on the grid. Turbine and digital upgrades add about a new reactor's worth of power. Google also signed a separate 15-year contract for another 2,700 megawatts. The buying spread to independent power producers Vistra and Talen, each up about 10%, and to nuclear supplier BWX Technologies, up about 8%.
The rally interrupts a month-long slide. A nuclear-power fund rose about 5% but has won back less than half of the roughly 14% it lost over the prior month, and it started the day about a third below its January peak. Utilities gained about 2% with no help from bonds. The 30-year Treasury yield edged up to about 5.67%, and the 10-year sits near 5.3% after recently touching 5.34%, its highest since 2002. Treasury Secretary Scott Bessent told Axios over the weekend that he cannot control the bond market. With rates going nowhere, the utility rally looks like a bet on power demand from a sector that had lost about 12% over the previous three months.
Elsewhere in tech, chipmaker Marvell jumped about 8% after CEO Matt Murphy told its investor day the company sees a $400 billion market by 2030. Dell rose about 6% after expanding its AI data platform, and Nvidia gained about 1%, holding near a $6 trillion valuation behind a $150 billion buyback. The most heavily bet-against stocks lagged even as the broader market rose, a pattern that usually signals fresh short bets. Goldman Sachs prime-brokerage data showed hedge funds were net sellers of stocks for six straight weeks through late September. The open question is whether nuclear names can hold their gains with long-term yields near their highest since 2002.
Alphabet and Constellation signed a long-term agreement for 890 MW from existing Illinois nuclear plants. The extra power comes from turbine and digital-system upgrades that add the output of a new reactor Morningstar. A separate 15-year contract covers another 2,700 MW in the PJM market region Morningstar. The economics matter more than the headline size: Google is paying for extra megawatts from reactors already on the grid instead of waiting for new ones to be built.
Buying spread to independent power producers and nuclear suppliers MarketWatch. Vistra (VST) is up +9.95%, Talen (TLN) +9.71% and BWX Technologies (BWXT) +7.96%. The model has no nuclear factor, so 8.3 points of Vistra's gain and 6.5 points of BWXT's count as stock-specific. Outside the nuclear generators the buying thins out: the Utilities sector is up +1.04%, behind Industrials at +1.39%.
The bounce comes after heavy selling. NLR lost -13.52% over the prior 20 sessions, which puts the stretch in the worst 2.9% of its 20-day windows since 2019. It started the day 33.7% below its January 28 peak. The rebound is trading in size: URA is running at 4.6× its typical session pace, AIPO at 3.1× and NLR at 2.8×.
| ETF | Theme | Today | 1d Ago | 5d Ago | 20d Ago | 63d Ago |
|---|---|---|---|---|---|---|
| NLR | nuclear power | +5.32% | +0.96% | -0.23% | -13.52% | -6.36% |
| AIPO | AI power infrastructure | +3.57% | +0.38% | +2.84% | -0.31% | -5.23% |
| URA | uranium | +3.55% | +1.01% | +0.15% | -12.74% | -3.74% |
| XLU | utilities | +1.99% | +0.35% | +1.83% | -6.53% | -11.89% |
| DTCR | data centers | +1.48% | +0.48% | +0.22% | -2.77% | -3.04% |
| GRID | grid infrastructure | +1.21% | -0.44% | +2.58% | +1.94% | +0.06% |
| XLRE | real estate | +1.10% | -0.34% | -1.64% | -6.65% | -8.65% |
| SPY | large cap | +0.71% | +0.67% | +1.20% | +0.85% | +3.88% |
| USO | oil | -1.27% | -2.29% | -4.01% | +1.43% | +32.20% |
| XBI | biotech | -2.61% | +1.14% | -0.27% | -4.65% | -4.69% |
GRID is the only power fund in the table that is higher over 20 sessions. NLR and URA have won back well under half of their monthly losses.
| T | Ita | Xar | Xli | Nlr | Xlf |
|---|---|---|---|---|---|
| 2026-09-04 | -0.16 | -0.40 | 0.41 | 0.64 | -0.79 |
| 2026-09-08 | -1.08 | -0.26 | -0.08 | 3.67 | -2.15 |
| 2026-09-09 | -2.89 | -2.85 | -1.59 | 3.15 | -2.56 |
| 2026-09-10 | -3.39 | -3.65 | -2.30 | -1.14 | -2.89 |
| 2026-09-11 | -3.08 | -3.14 | -1.25 | -5.01 | -2.24 |
| 2026-09-14 | -4.08 | -4.37 | -2.65 | -8.16 | -2.61 |
| 2026-09-15 | -5.19 | -4.88 | -3.27 | -9.12 | -2.92 |
| 2026-09-16 | -4.63 | -4.58 | -3.35 | -9.93 | -4.49 |
| 2026-09-17 | -5.24 | -4.97 | -3.18 | -7.23 | -4.58 |
| 2026-09-18 | -5.26 | -5.54 | -2.76 | -9.65 | -4.61 |
| 2026-09-21 | -4.24 | -4.04 | -2.36 | -7.10 | -4.21 |
| 2026-09-22 | -5.19 | -4.84 | -2.20 | -6.07 | -6.09 |
| 2026-09-23 | -5.23 | -5.68 | -2.29 | -9.11 | -6.54 |
| 2026-09-24 | -5.74 | -5.65 | -3.02 | -10.88 | -6.55 |
| 2026-09-25 | -5.27 | -5.65 | -2.10 | -11.25 | -6.02 |
| 2026-09-28 | -7.29 | -7.72 | -3.05 | -12.77 | -7.14 |
| 2026-09-29 | -7.27 | -8.13 | -2.85 | -12.63 | -7.45 |
| 2026-09-30 | -8.21 | -8.88 | -4.09 | -13.20 | -8.49 |
| 2026-10-01 | -7.83 | -8.75 | -3.13 | -13.79 | -8.39 |
| 2026-10-02 | -7.94 | -8.16 | -2.38 | -13.80 | -8.34 |
| 2026-10-05 | -8.30 | -8.87 | -2.29 | -12.97 | -7.67 |
| 2026-10-06 | -7.54 | -7.61 | -1.14 | -8.56 | -7.12 |
| Factor | Return | Z-Score | 5d Z | 20d Z | 63d Z | Category | Direction |
|---|---|---|---|---|---|---|---|
| Short Interest | -0.30% | -1.79 | -0.72 | -1.31 | -1.69 | Style-Positioning | Most-shorted names lagged |
| Leverage | +0.21% | +1.27 | -0.83 | -2.33 | -2.90 | Style | More-levered names outperformed |
| Long-Term Momentum | -0.54% | -0.84 | -0.03 | +0.77 | -0.26 | Style-Momentum | 1-year laggards outperformed |
| Beta | +0.52% | +0.54 | +0.75 | +0.91 | +0.31 | Style-Risk | High-beta names outperformed |
| Growth | +0.24% | +0.98 | +0.8 | +0.7 | +0.7 | Style | High-growth names outperformed |
| Hedge-Fund Ownership | -0.10% | -0.92 | -1.34 | -1.25 | -0.68 | Style-Positioning | Hedge-fund-heavy names lagged |
| Treasury (Duration) | -0.09% | -0.29 | -1.29 | -1.69 | -0.92 | Thematic | Rate-sensitive names lagged |
12-month momentum (Long-Term Momentum in the table) is down -0.54% at z=-0.8. The whole move came from the losers' end. The worst 1-year performers are up +2.0% as a group, led by Rigetti (RGTI), Nano Nuclear (NNE), Centrus Energy (LEU), Oklo (OKLO) and D-Wave (QBTS). Three of those five are nuclear names, so part of the dip in momentum is the Google deal reaching last year's laggards.
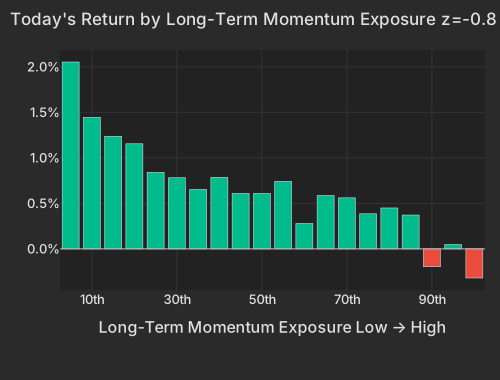
| Bucket | Avg Ret Pct |
|---|---|
| 1 | 2.05 |
| 2 | 1.45 |
| 3 | 1.24 |
| 4 | 1.15 |
| 5 | 0.84 |
| 6 | 0.78 |
| 7 | 0.65 |
| 8 | 0.79 |
| 9 | 0.61 |
| 10 | 0.61 |
| 11 | 0.74 |
| 12 | 0.28 |
| 13 | 0.59 |
| 14 | 0.56 |
| 15 | 0.39 |
| 16 | 0.45 |
| 17 | 0.37 |
| 18 | -0.20 |
| 19 | 0.05 |
| 20 | -0.32 |
The 1-year winners paid for it. Dell (DELL) is up +5.83% after launching an expanded AI Data Platform in a Business Wire release, but its 12-month-winner status cost it about 1.3 points. Beta is up +0.52%, and the highest-beta bucket is up +2.46% on AI and data-center hardware such as Wolfspeed (WOLF) and Ouster (OUST). Super Micro's (SMCI) +2.79% gain comes entirely from its factor exposures, with a slightly negative stock-specific piece. Marvell (MRVL) is up +8.09% after CEO Matt Murphy told its investor day the company sees a $400 billion addressable market by 2030, Investing.com reported. Nvidia (NVDA) is up +1.35%, staying close to a $6 trillion valuation behind a $150 billion buyback Bloomberg. Separately, Option Care Health (OPCH) is up +32.88% on McKesson and CD&R's $5.8 billion agreement to buy it WSJ.
Short Interest is down -0.30% at z=-1.8: the most-shorted names are trailing the least-shorted while the market rises. That return ranks in the lowest 3.4% of sessions since 2020. Measured against its own past year, the factor also explains an unusually large share of today's stock moves, in its top tenth. The pressure on the most-shorted names has built over weeks: -0.97% over 20 sessions and -1.99% over 60.
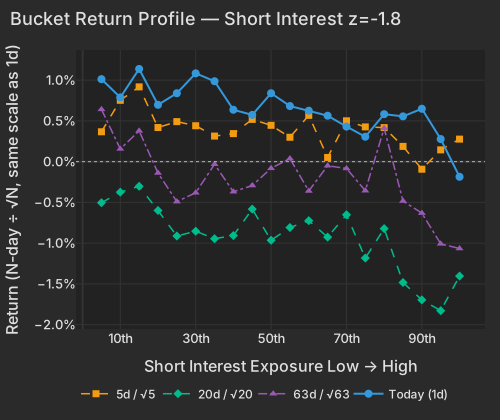
| Bucket | Ret 1D Pct | Ret 5D Norm Pct | Ret 20D Norm Pct | Ret 63D Norm Pct |
|---|---|---|---|---|
| 1 | 1.01 | 0.37 | -0.50 | 0.64 |
| 2 | 0.79 | 0.75 | -0.37 | 0.16 |
| 3 | 1.14 | 0.92 | -0.30 | 0.38 |
| 4 | 0.70 | 0.42 | -0.60 | -0.14 |
| 5 | 0.84 | 0.49 | -0.91 | -0.49 |
| 6 | 1.08 | 0.44 | -0.85 | -0.38 |
| 7 | 0.99 | 0.31 | -0.95 | -0.03 |
| 8 | 0.64 | 0.34 | -0.91 | -0.37 |
| 9 | 0.57 | 0.52 | -0.58 | -0.29 |
| 10 | 0.84 | 0.45 | -0.96 | -0.08 |
| 11 | 0.68 | 0.30 | -0.81 | 0.04 |
| 12 | 0.62 | 0.57 | -0.72 | -0.36 |
| 13 | 0.56 | 0.05 | -0.93 | -0.05 |
| 14 | 0.43 | 0.50 | -0.65 | -0.08 |
| 15 | 0.31 | 0.43 | -1.18 | -0.36 |
| 16 | 0.58 | 0.42 | -0.82 | 0.41 |
| 17 | 0.56 | 0.19 | -1.48 | -0.48 |
| 18 | 0.65 | -0.09 | -1.70 | -0.63 |
| 19 | 0.28 | 0.14 | -1.83 | -1.01 |
| 20 | -0.19 | 0.28 | -1.40 | -1.07 |
Vaxcyte (PCVX), one of the model's most heavily shorted names, is down -12.29% after launching a $1 billion stock and convertible-note offering, Investing.com reported. Most-shorted names lagging a rising market usually goes with fresh short sales placed alongside new long positions. Goldman Sachs Prime Brokerage data showed six straight weeks of hedge-fund net equity selling through late September. Citadel Securities estimated that US equity CTA positioning fell to -0.80 standard deviations as of the October 2 session. Today's print is a single session after those desk windows close.
XLU is up +1.99% at 2.3× its typical session pace. Bonds gave the sector no help: the 30-year yield is 0.4 bp higher at 5.668% CNBC. The 10-year yield is at 5.303%, down just 0.8 bp CNBC. Treasury Secretary Scott Bessent told Axios over the weekend that he cannot control the bond market, after the 10-year touched 5.34%, its highest since 2002. The Treasury (Duration) factor is down -0.09%, its fifth straight losing session, and has lost -2.43% over 20 sessions. Utilities are rising while rate-sensitive stocks keep losing ground, which marks today's sector gain as a bet on power demand.
That bet starts from a deep hole. XLU's 63-session loss through Monday, -11.89%, ranked in the worst 3.0% of such windows since 2019. Leverage is up +0.21% at z=+1.3, with the more-levered names, Annaly (NLY) and KKR among them, outperforming. That cuts against a 63-day z of -2.9 and a -3.63% loss over 60 sessions, a slide that ran alongside the 10-year's climb. With the 10-year barely moving today, the bounce has no rate move behind it. The open question is whether the nuclear names can hold today's gains while long-term yields stay near their highest levels since 2002.
The New York Fed's Global Supply Chain Pressure Index (GSCPI), released at 10:00 AM ET, showed September at 1.06 standard deviations above its historical mean, unchanged from August.
Variance decomposition: live intraday — 20261006 session, bracketed against its trailing-year range. Factor returns are trailing through last close. Total cross-sectional dispersion: 5.2%ile of the past year.
Variance mix — % of total, today vs 1d ago vs 1-yr avg
market 75%ile style 39%ile thematic 22%ile idiosyncratic 48%ile
Variance explained — today vs. factor's trailing-year range
Marker = the factor's share of today's total variance, placed in its own trailing-year range (box 25–75%ile, ticks 90%ile and max). Amber marker = unusually load-bearing today (≥90%ile of its own year). Factor name green = up today / red = down.
Correlation & dispersion — realized vs implied
Pairwise realized correlation (20d): 10.16% 9.5%ile since 2020 · 95.2%ile 3m
Top-500 pairwise: 13.85% 20%ile since 2020 · 100.0%ile 3m · implied (Cboe COR1M): 8.48 2.2%ile of its own history (gap +5.4pp)
Realized 20d vol (ann. pts): all stocks 37 vs VIXEQ 39 · index 10 vs VIX 15 · style factors 16 50%ile
20-day window (19 completed days + today); percentiles vs model history since 2020; '3m' tokens rank vs the trailing 63 trading days; definitions in Terms below. Implied prints (Cboe) are delayed ~15 min. as of 09:58 ET
High-beta momentum cohort (eq-wt, since-2020 rank): +1.1% 67%ile · rest of market +0.4%
| Factor | Today | 1d | 5d | 20d | 60d |
|---|---|---|---|---|---|
| Style-Risk | |||||
| International | -0.21% z-0.7 | +0.41% | -0.24% | -0.47% | +0.50% |
| Beta | +0.52% z+0.5 | -0.21% | +1.62% | +3.93% | +3.73% |
| Residual Volatility | -0.01% z-0.0 | +0.51% | +0.85% | +1.35% | +3.61% |
| Style | |||||
| Leverage | +0.21% z+1.3 | -0.13% | -0.31% | -1.75% | -3.63% |
| Growth | +0.24% z+1.0 | +0.13% | +0.44% | +0.75% | +1.38% |
| Value | -0.13% z-0.6 | -0.31% | +0.05% | -0.33% | +0.21% |
| Dividend Yield | -0.09% z-0.5 | -0.44% | -0.67% | -0.94% | -0.30% |
| Profitability | -0.08% z-0.4 | +0.02% | +0.04% | +0.61% | -1.02% |
| Liquidity | +0.06% z+0.2 | -0.13% | -0.45% | -0.66% | +2.41% |
| Size | -0.04% z-0.1 | +0.14% | +0.08% | +2.64% | +2.39% |
| Style-Momentum | |||||
| Long-Term Momentum | -0.54% z-0.8 | -0.16% | -0.04% | +2.23% | -0.67% |
| Medium-Term Momentum | +0.18% z+0.6 | -0.00% | +0.13% | -0.08% | +0.44% |
| One-Day Momentum | -0.15% z-0.5 | +0.05% | -0.08% | -1.68% | -2.60% |
| Short-Term Momentum | +0.14% z+0.5 | +0.20% | +0.35% | -0.06% | -7.23% |
| Style-Positioning | |||||
| Short Interest | -0.30% z-1.8 | +0.08% | -0.27% | -0.97% | -1.99% |
| Hedge-Fund Ownership | -0.10% z-0.9 | +0.07% | -0.33% | -0.62% | -0.61% |
| Style-Flow | |||||
| Short-Sale Activity | +0.05% z+0.4 | +0.01% | +0.07% | +0.18% | +0.88% |
| Morning Activity | +0.00% z+0.0 | +0.06% | -0.33% | -1.22% | +1.19% |
| Thematic | |||||
| Gold | -0.22% z-0.7 | +0.10% | -0.83% | -1.87% | +3.05% |
| Bitcoin / Crypto | -0.17% z-0.6 | +0.42% | +0.12% | +0.14% | +1.86% |
| Oil | -0.26% z-0.6 | +0.39% | +0.84% | +0.79% | +4.81% |
| China | -0.17% z-0.4 | +0.33% | -0.18% | +0.13% | +1.04% |
| Treasury (Duration) | -0.09% z-0.3 | -0.10% | -0.93% | -2.43% | -2.63% |
| Semiconductors | -0.15% z-0.2 | -0.41% | +0.09% | +0.52% | -2.11% |
5/20/60d windows include today's session; 1d is the previous session.
Factor z-score. Today's factor return divided by its daily-return standard deviation over ~1,600 trading days.
Stock-specific (idiosyncratic) return. The part of a stock's move not explained by market, style, or thematic factors in our decomposition.
Data compiled by FactorPulse AI; edited and verified by Jeff Klein. For informational purposes only. Does not constitute financial advice, an investment recommendation, or an offer to buy or sell any securities. Always consult a qualified financial professional before making investment decisions.
For more on factor construction methodology, see www.factorpulse.com/glossary.