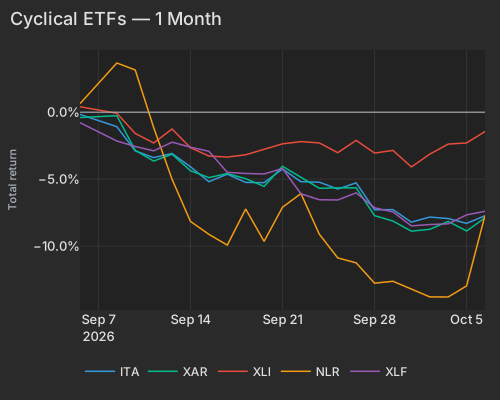
Google's agreement to buy nuclear power from Constellation Energy for the next 20 years set off a rally in power and uranium stocks that had been sliding for a month. Under the deal, Google will take 890 megawatts of added output from Constellation's existing reactors in Illinois, and the two signed a separate 15-year agreement covering another 2,700 megawatts. Constellation will spend $4.3 billion to squeeze more power out of those plants, and its shares jumped about 12%, adding roughly $12 billion in market value. Fellow power producers Talen Energy and Vistra rose more than 10%, uranium miner Cameco gained 7%, and nuclear developer Oklo climbed too. The nuclear-power fund NLR rose about 5.5% but won back less than half of what it lost over the past month. The utilities fund XLU gained about 3% and is still down about 12% over three months.
The S&P 500 rose about half a percent to its first record close since August, helped by a breather in the bond market. The 10-year Treasury yield eased to about 5.28% after touching 5.34%, its highest since 2002, and Treasury Secretary Scott Bessent conceded he cannot control the bond market. The dip gave a lift to heavily indebted companies such as mortgage investor Annaly and investment firm KKR, and the homebuilder fund ITB and real-estate fund XLRE also rose. The relief was thin, though: the 30-year yield barely moved, and a small dip in rates does little to undo three months of damage. In deal news, health-care company Option Care Health soared about a third after agreeing to a $5.8 billion takeover by McKesson and CD&R.
Not everything rose. Investors sold last year's biggest winners, and biotech was hit hardest, with the biotech fund XBI falling more than 3% on about twice its usual trading volume. South Korean memory-chip maker SK hynix fell about 6%, erasing roughly $86 billion in market value. The Economic Times tied the drop to the 5.3% 10-year yield and the expiry of an IPO lock-up. The memory-chip fund DRAM and the South Korea fund EWY each fell between 2.5% and 3.5% after strong runs last week. Chip investors are now watching Samsung's preliminary third-quarter results on Thursday, when analysts expect a record quarterly operating profit above 100 trillion won.
Google and Constellation signed a 20-year contract for 890 MW from uprates (added output from existing reactors) at Constellation's Illinois plants. They also signed a 15-year agreement covering another 2,700 MW in the PJM grid region Morningstar. Constellation will spend $4.3 billion on the uprates WSJ. CEG's +12.19% session gain was +11.25% its own move, with less than one percentage point coming from factors. Other power producers followed: Talen Energy (TLN) rose +12.53% and Vistra (VST) +10.77% MarketWatch. Uranium miner Cameco (CCJ) added +7.04%, again almost entirely stock-specific. The model has no nuclear factor, so a single trade across power producers and uranium shows up as a string of separate stock-specific moves.
The deal hit a group that was already under pressure. Before today, NLR's 20-day loss ranked in the 2.9th percentile of its history since 2018, and the fund sat 33% below its January 28 peak. XLU's 63-day loss ranked in the 3.0th percentile. Its session gain was about three times its typical daily swing and still leaves the fund roughly 12% below its February peak. The Global X Uranium ETF (URA) traded at 6.1× its typical session pace and the AI power-infrastructure fund AIPO at 2.6×. That much volume in niche funds shows real buying, not a thin drift higher.
| ETF | Theme | Today (session) | 1d Ago | 5d Ago | 20d Ago | 63d Ago |
|---|---|---|---|---|---|---|
| NLR | nuclear power | +5.54% | +0.96% | -0.23% | -13.52% | -6.36% |
| URA | uranium | +3.97% | +1.01% | +0.15% | -12.74% | -3.74% |
| AIPO | AI power infrastructure | +3.61% | +0.38% | +2.84% | -0.31% | -5.23% |
| XLU | utilities | +2.96% | +0.35% | +1.83% | -6.53% | -11.89% |
| ITB | homebuilders | +1.65% | -1.22% | -3.57% | -8.10% | -13.58% |
| XLRE | real estate | +1.12% | -0.34% | -1.64% | -6.65% | -8.65% |
| SPY | large cap | +0.57% | +0.67% | +1.20% | +0.85% | +3.88% |
| EWY | south korea | -2.63% | -0.22% | +4.29% | +1.37% | +5.61% |
| XBI | biotech | -3.37% | +1.14% | -0.27% | -4.65% | -4.69% |
| DRAM | memory chips & storage | -3.49% | -0.18% | +3.30% | +3.32% | +1.78% |
Nuclear, utilities and rate-sensitive funds rose today but remain deep in the red over 20 and 63 days. Memory chips and Korea, both up strongly over the past week, gave ground.
| T | Ita | Xar | Xli | Nlr | Xlf |
|---|---|---|---|---|---|
| 2026-09-04 | -0.16 | -0.40 | 0.41 | 0.64 | -0.79 |
| 2026-09-08 | -1.08 | -0.26 | -0.08 | 3.67 | -2.15 |
| 2026-09-09 | -2.89 | -2.85 | -1.59 | 3.15 | -2.56 |
| 2026-09-10 | -3.39 | -3.65 | -2.30 | -1.14 | -2.89 |
| 2026-09-11 | -3.08 | -3.14 | -1.25 | -5.01 | -2.24 |
| 2026-09-14 | -4.08 | -4.37 | -2.65 | -8.16 | -2.61 |
| 2026-09-15 | -5.19 | -4.88 | -3.27 | -9.12 | -2.92 |
| 2026-09-16 | -4.63 | -4.58 | -3.35 | -9.93 | -4.49 |
| 2026-09-17 | -5.24 | -4.97 | -3.18 | -7.23 | -4.58 |
| 2026-09-18 | -5.26 | -5.54 | -2.76 | -9.65 | -4.61 |
| 2026-09-21 | -4.24 | -4.04 | -2.36 | -7.10 | -4.21 |
| 2026-09-22 | -5.19 | -4.84 | -2.20 | -6.07 | -6.09 |
| 2026-09-23 | -5.23 | -5.68 | -2.29 | -9.11 | -6.54 |
| 2026-09-24 | -5.74 | -5.65 | -3.02 | -10.88 | -6.55 |
| 2026-09-25 | -5.27 | -5.65 | -2.10 | -11.25 | -6.02 |
| 2026-09-28 | -7.29 | -7.72 | -3.05 | -12.77 | -7.14 |
| 2026-09-29 | -7.27 | -8.13 | -2.85 | -12.63 | -7.45 |
| 2026-09-30 | -8.21 | -8.88 | -4.09 | -13.20 | -8.49 |
| 2026-10-01 | -7.83 | -8.75 | -3.13 | -13.79 | -8.39 |
| 2026-10-02 | -7.94 | -8.16 | -2.38 | -13.80 | -8.34 |
| 2026-10-05 | -8.30 | -8.87 | -2.29 | -12.97 | -7.67 |
| 2026-10-06 | -7.73 | -7.88 | -1.44 | -7.71 | -7.40 |
Long-Term Momentum, the 12-month factor, fell -0.82% at z=-1.27. It was the day's largest style driver, at 5.6% of the variance in stock returns. The stocks that lagged most over the past year gained +1.00% as a group, which includes nuclear developers Oklo (OKLO), NANO Nuclear (NNE) and Centrus (LEU). The past year's biggest winners fell -2.24%, and the biotech names among them, including Iovance (IOVA), MBX Biosciences (MBX) and Alumis (ALMS), fell -4.35%. XBI closed -3.37% on 2.2× its usual volume. Twist Bioscience (TWST) was marked down -18.3%. Factor exposures accounted for nearly half of Vaxcyte's (PCVX) -10.1% drop. Today was the factor's first down day in five, and it is still up +1.95% over 20 sessions. That makes this a one-day give-back inside a positive month, with the nuclear rally supplying part of the bid for laggards.
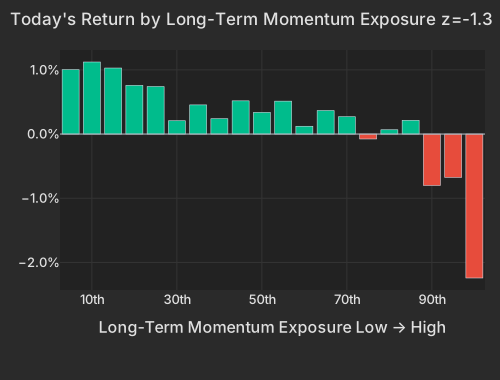
| Bucket | Avg Ret Pct |
|---|---|
| 1 | 1.00 |
| 2 | 1.12 |
| 3 | 1.03 |
| 4 | 0.76 |
| 5 | 0.74 |
| 6 | 0.21 |
| 7 | 0.45 |
| 8 | 0.24 |
| 9 | 0.52 |
| 10 | 0.34 |
| 11 | 0.51 |
| 12 | 0.12 |
| 13 | 0.37 |
| 14 | 0.27 |
| 15 | -0.08 |
| 16 | 0.07 |
| 17 | 0.21 |
| 18 | -0.80 |
| 19 | -0.67 |
| 20 | -2.24 |
Short Interest fell -0.58% at z=-3.48, a 0.4th-percentile daily return since 2020. The factor also explained more of the day's stock-by-stock variation than on any session in the past year. The most-shorted bucket fell -1.28% while the least-shorted rose +1.01%. Most-shorted names underperforming is the factor's normal direction, and it has held for weeks: -1.25% over 20 sessions and -2.27% over 60. On a day the S&P 500 set its first record close since August Bloomberg, that drag fits a risk-appetite session. It usually pays when new shorts are being added alongside new longs.
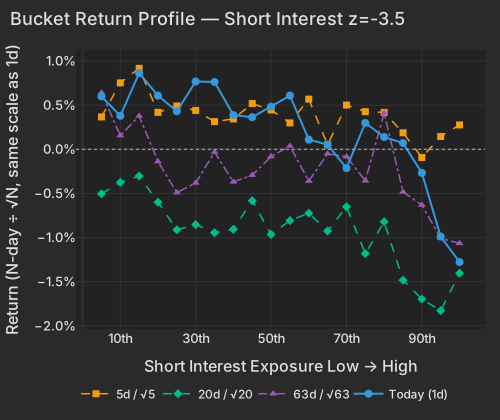
| Bucket | Ret 1D Pct | Ret 5D Norm Pct | Ret 20D Norm Pct | Ret 63D Norm Pct |
|---|---|---|---|---|
| 1 | 0.60 | 0.37 | -0.50 | 0.64 |
| 2 | 0.38 | 0.75 | -0.37 | 0.16 |
| 3 | 0.86 | 0.92 | -0.30 | 0.38 |
| 4 | 0.61 | 0.42 | -0.60 | -0.14 |
| 5 | 0.43 | 0.49 | -0.91 | -0.49 |
| 6 | 0.77 | 0.44 | -0.85 | -0.38 |
| 7 | 0.76 | 0.31 | -0.95 | -0.03 |
| 8 | 0.39 | 0.34 | -0.91 | -0.37 |
| 9 | 0.36 | 0.52 | -0.58 | -0.29 |
| 10 | 0.48 | 0.45 | -0.96 | -0.08 |
| 11 | 0.61 | 0.30 | -0.81 | 0.04 |
| 12 | 0.11 | 0.57 | -0.72 | -0.36 |
| 13 | 0.05 | 0.05 | -0.93 | -0.05 |
| 14 | -0.21 | 0.50 | -0.65 | -0.08 |
| 15 | 0.30 | 0.43 | -1.18 | -0.36 |
| 16 | 0.14 | 0.42 | -0.82 | 0.41 |
| 17 | 0.07 | 0.19 | -1.48 | -0.48 |
| 18 | -0.27 | -0.09 | -1.70 | -0.63 |
| 19 | -0.99 | 0.14 | -1.83 | -1.01 |
| 20 | -1.28 | 0.28 | -1.40 | -1.07 |
The two fast trend factors split by horizon. Short-Term Momentum rose +0.46% at z=+1.52 as last week's winners kept leading. One-Day Momentum fell -0.41% at z=-1.48 as yesterday's winners gave ground. Today's 5-day trend print runs against a three-month stretch, at a 63-day z=-2.88, in which last week's movers mostly reverted.
The index barely mattered for stock selection today. The broad market explained 2.4% of the variation in stock returns, against a 9.5% one-year average, and stock-specific moves explained 78.6%. Implied single-stock correlation (Cboe COR1M) remains at 8.36, in the lowest 2.0% of its 20-year history. In that kind of market, one contract can move CEG by double digits while the index barely registers.
| Factor | Return | Z-Score | 5d Z | 20d Z | 63d Z | Category | Direction |
|---|---|---|---|---|---|---|---|
| Short Interest | -0.58% | -3.48 | -1.47 | -1.69 | -1.90 | Positioning | Most-shorted lagged (continuation) |
| Leverage | +0.32% | +1.93 | -0.53 | -2.18 | -2.82 | Style | Levered names led (break from trend) |
| Short-Term Momentum | +0.46% | +1.52 | 0.99 | 0.19 | -2.88 | Momentum | 5-day trend |
| One-Day Momentum | -0.41% | -1.48 | -0.6 | -1.6 | -1.5 | Momentum | Yesterday's winners lagged |
| Long-Term Momentum | -0.82% | -1.27 | -0.22 | 0.68 | -0.31 | Momentum | 12-month laggards led |
| Treasury (Duration) | -0.28% | -0.86 | -1.5 | -1.8 | -1.0 | Thematic | Fifth straight decline |
The 10-year Treasury yield stood at 5.281% at 4:12 PM, down 3.0 bp, while the two-year fell 3.8 bp to 4.795% CNBC. The 10-year had touched 5.34%, its highest since 2002, and Treasury Secretary Scott Bessent conceded he cannot control the bond market NYT Bloomberg. Leverage rose +0.32% at z=+1.93, a 97.4th-percentile day since 2020. That breaks against a -3.52% slide over 60 sessions, a 63-day z=-2.82. The most-levered bucket rose +1.45%, led by Annaly (NLY) and KKR (KKR), and homebuilder and REIT funds rose with it (table above). The relief did not spread to rate sensitivity in general. The Treasury (Duration) factor still fell -0.28%, its fifth decline in five sessions, and the 30-year yield eased just 0.9 bp. So the bounce stayed with heavily indebted companies, and a 3 bp dip has not repaired a three-month drawdown.
SK hynix (SKHY) closed -6.37%, erasing about $86B of market value, almost entirely as a stock-specific move. The Economic Times tied the drop to the 5.3% ten-year yield and an IPO lock-up expiry. The same report said AMD plans to raise its AI chip supply substantially in 2027 Economic Times. Option Care Health (OPCH) closed +32.68% after agreeing to a $5.8 billion takeover by McKesson and CD&R WSJ. Ciena (CIEN) closed +13.95% on a move almost entirely its own, and Cisco (CSCO) added +4.52%. Separately, the Economic Times reported that Marvell raised its 2028 revenue forecast, citing AI data-center demand. The next test for memory chips is Samsung's preliminary third-quarter results on Thursday, October 8. The Korea Herald reported that analysts expect a record quarterly operating profit above 100 trillion won.
The New York Fed's Global Supply Chain Pressure Index, released at 10:00 AM ET, held at 1.06 standard deviations above its historical mean in September, unchanged from August and well below its April peak of 1.82.
Variance decomposition: live intraday — 20261006 session, bracketed against its trailing-year range. Factor returns are trailing through last close. Total cross-sectional dispersion: 33%ile of the past year.
Variance mix — % of total, today vs 1d ago vs 1-yr avg
market 34%ile style 50%ile thematic 52%ile idiosyncratic 68%ile
Variance explained — today vs. factor's trailing-year range
Marker = the factor's share of today's total variance, placed in its own trailing-year range (box 25–75%ile, ticks 90%ile and max). Amber marker = unusually load-bearing today (≥90%ile of its own year). Factor name green = up today / red = down.
Correlation & dispersion — realized vs implied
Pairwise realized correlation (20d): 9.69% 7.8%ile since 2020 · 90.5%ile 3m
Top-500 pairwise: 13.29% 18%ile since 2020 · 100.0%ile 3m · implied (Cboe COR1M): 8.36 2.0%ile of its own history (gap +4.9pp)
Realized 20d vol (ann. pts): all stocks 37 vs VIXEQ 38 · index 10 vs VIX 15 · style factors 16 52%ile
20-day window (19 completed days + today); percentiles vs model history since 2020; '3m' tokens rank vs the trailing 63 trading days; definitions in Terms below. Implied prints (Cboe) are delayed ~15 min. as of 15:58 ET
Top 50 high-beta momentum names (eq-wt, since-2020 rank): -0.7% 34%ile · rest of market +0.3%
| Factor | Today | 1d | 5d | 20d | 60d |
|---|---|---|---|---|---|
| Style-Risk | |||||
| Residual Volatility | -0.31% z-0.6 | +0.51% | +0.55% | +1.05% | +3.30% |
| International | -0.08% z-0.2 | +0.41% | -0.10% | -0.33% | +0.63% |
| Beta | +0.20% z+0.2 | -0.21% | +1.29% | +3.61% | +3.41% |
| Style | |||||
| Leverage | +0.32% z+1.9 | -0.13% | -0.20% | -1.64% | -3.52% |
| Growth | +0.27% z+1.1 | +0.13% | +0.47% | +0.78% | +1.41% |
| Liquidity | +0.18% z+0.7 | -0.13% | -0.32% | -0.53% | +2.54% |
| Profitability | +0.11% z+0.6 | +0.02% | +0.23% | +0.80% | -0.83% |
| Size | +0.17% z+0.5 | +0.14% | +0.29% | +2.84% | +2.60% |
| Value | +0.08% z+0.3 | -0.31% | +0.26% | -0.12% | +0.42% |
| Dividend Yield | +0.06% z+0.3 | -0.44% | -0.53% | -0.79% | -0.15% |
| Style-Momentum | |||||
| Short-Term Momentum | +0.46% z+1.5 | +0.20% | +0.67% | +0.26% | -6.91% |
| One-Day Momentum | -0.41% z-1.5 | +0.05% | -0.35% | -1.95% | -2.86% |
| Long-Term Momentum | -0.82% z-1.3 | -0.16% | -0.32% | +1.95% | -0.94% |
| Medium-Term Momentum | -0.11% z-0.4 | -0.00% | -0.16% | -0.36% | +0.15% |
| Style-Positioning | |||||
| Short Interest | -0.58% z-3.5 | +0.08% | -0.55% | -1.25% | -2.27% |
| Hedge-Fund Ownership | -0.12% z-1.1 | +0.07% | -0.35% | -0.63% | -0.62% |
| Style-Flow | |||||
| Morning Activity | +0.09% z+0.8 | +0.06% | -0.24% | -1.13% | +1.28% |
| Short-Sale Activity | +0.02% z+0.2 | +0.01% | +0.05% | +0.16% | +0.86% |
| Thematic | |||||
| Bitcoin / Crypto | -0.47% z-1.6 | +0.42% | -0.18% | -0.16% | +1.56% |
| Treasury (Duration) | -0.28% z-0.9 | -0.10% | -1.12% | -2.61% | -2.81% |
| China | -0.34% z-0.8 | +0.33% | -0.36% | -0.04% | +0.87% |
| Gold | -0.25% z-0.8 | +0.10% | -0.85% | -1.90% | +3.03% |
| Oil | -0.24% z-0.5 | +0.39% | +0.86% | +0.82% | +4.83% |
| Semiconductors | -0.00% z-0.0 | -0.41% | +0.24% | +0.66% | -1.97% |
5/20/60d windows include today's session; 1d is the previous session.
Factor z-score. Today's factor return divided by its daily-return standard deviation over ~1,600 trading days.
Stock-specific (idiosyncratic) return. The part of a stock's move not explained by market, style, or thematic factors in our decomposition.
VIXEQ / DSPX / COR1M. Cboe implied indices: single-stock volatility, dispersion, and 1-month implied correlation (top-50 S&P names). Quotes delayed ~15 minutes.
Data compiled by FactorPulse AI; edited and verified by Jeff Klein. For informational purposes only. Does not constitute financial advice, an investment recommendation, or an offer to buy or sell any securities. Always consult a qualified financial professional before making investment decisions.
For more on factor construction methodology, see www.factorpulse.com/glossary.