Flávio Bolsonaro's first-round finish ahead of President Lula in Sunday's election sent Brazilian stocks traded in New York up between 11% and 31% on Monday. Bolsonaro took about 47% of the vote to Lula's roughly 45%, and he is now seen as the heavy favorite in the October 25 runoff. Financial stocks led the rally. Brokerage XP jumped 31%, and lenders Banco Bradesco and Itaú Unibanco gained about 19% and 15%. The stocks moved together as one bet on the country, and the gains now depend on how the runoff goes.
Rising interest rates dragged on dividend stocks. The 10-year Treasury yield climbed to 5.31%, within a few hundredths of the 24-year high it hit Thursday. That pushed high-dividend stocks lower in every sector, not just real estate, where funds were already down about 7% over the past month. A September survey of service businesses showed the prices they pay rising at the fastest pace since July 2022, which added to the pressure on rates. In Europe, Spanish Prime Minister Pedro Sánchez called a snap election for November 29, and the euro fell to a 16-month low while the dollar touched its highest level in a year. Oil dropped about 2%, to roughly $89 a barrel, after the G7 nations pledged to release 100 million barrels from reserves.
The broader market climbed. The S&P 500 rose about 0.6%, and gains in Nvidia and Microsoft pushed the Nasdaq to record intraday highs. Vaccine developer Vaxcyte surged about 31% after its pneumococcal vaccine met its main goals in a late-stage trial. Chipmaker TSMC rose about 3% on reports that it is in talks to join Elon Musk's Terafab chip venture in Texas. Intel, already a partner in that venture, fell more than 4% before the opening bell on the news. Treasury auctions and Wednesday's release of the Federal Reserve's meeting minutes are the next tests for bond yields.
Brazil's election produced the session's biggest moves. Flávio Bolsonaro took about 47% of Sunday's first-round vote to Lula's roughly 45%. He is now seen as the heavy favorite in the October 25 runoff. CNBC Brazilian financials led the move, and the broker XP closed +31.16%. The table splits each name's move into the part the factor model can explain and the part it assigns to the stock itself.
| Stock | Move today (incl. late trading) | Stock-specific portion |
|---|---|---|
| XP Inc. (XP) | +31.54% | +29.87% |
| StoneCo (STNE) | +21.73% | +20.04% |
| PagSeguro (PAGS) | +21.29% | +21.04% |
| Banco Bradesco (BBD) | +19.28% | +17.00% |
| Sabesp (SBS) | +16.10% | +14.52% |
| Itaú Unibanco (ITUB) | +15.37% | +12.96% |
| Petrobras (PBR) | +11.53% | +8.75% |
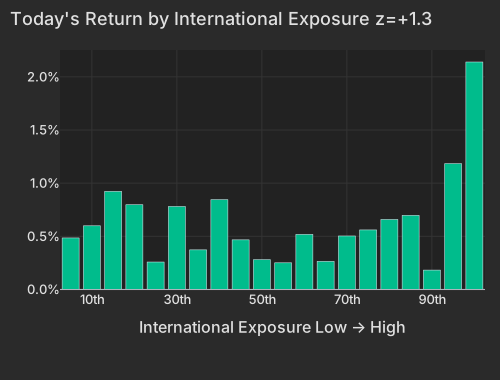
For every name in the table, the market and the factors explain less than 3 points of the move. The International factor (US-listed foreign names) rose +0.40% at z=+1.35 and added about 0.7 points each to Itaú, XP and Petrobras. Everything else went into the stock-specific column.
| Bucket | Avg Ret Pct |
|---|---|
| 1 | 0.48 |
| 2 | 0.60 |
| 3 | 0.92 |
| 4 | 0.80 |
| 5 | 0.26 |
| 6 | 0.78 |
| 7 | 0.37 |
| 8 | 0.84 |
| 9 | 0.47 |
| 10 | 0.28 |
| 11 | 0.25 |
| 12 | 0.52 |
| 13 | 0.26 |
| 14 | 0.50 |
| 15 | 0.56 |
| 16 | 0.66 |
| 17 | 0.70 |
| 18 | 0.18 |
| 19 | 1.18 |
| 20 | 2.14 |
Style factors explained 7% of stock-level variance today, against a 22% one-year average, which puts the day in the 6th percentile of the past year. Stock-specific moves took 85%, against a 65% norm. Brazilian names were five of the eight largest stock-specific moves. The other three were PTC, Vaxcyte (PCVX) and Option Care Health (OPCH), whose roughly 28% jump does not yet have a reported driver.
| Factor | Return | Z-Score | 5d Z | 20d Z | 63d Z | Category | Direction |
|---|---|---|---|---|---|---|---|
| Dividend Yield | -0.44% | -2.49 | -1.33 | -0.74 | 0.00 | Style | High-payout names lagged |
| International | +0.40% | +1.35 | -0.13 | -0.23 | +0.50 | Style-Risk | US-listed foreign names led |
| Bitcoin / Crypto | +0.41% | +1.35 | +0.36 | +0.14 | +0.70 | Thematic | Crypto-linked names led |
| Value | -0.31% | -1.33 | +0.4 | -0.4 | +0.5 | Style | Cheaper names lagged |
| Residual Volatility | +0.50% | +1.00 | +0.76 | +0.49 | +0.96 | Style-Risk | More volatile names led |
| Oil | +0.39% | +0.82 | +0.91 | +0.87 | +1.74 | Thematic | Oil-exposed names led |
| Semiconductors | -0.40% | -0.66 | +0.3 | +0.7 | -0.1 | Thematic | Chip names lagged |
The factor model shows the seven Brazilian names as seven separate stock stories. Today they traded as one country position, so a portfolio holding several of them carries more correlated risk than its stock-specific line suggests.
Buying in US-listed foreign stocks went well beyond Brazil. Lithium Americas (LAC), HSBC and ASML led the top International bucket. The China internet fund KWEB rose +3.08% at 2.1× its typical session pace, after losing -6.58% over the prior 20 sessions. Brazil also did little for the US index. The S&P 500 fund SPY closed +0.62%, and Nvidia (+2.04%) and Microsoft (+1.42%) lifted the Nasdaq Composite to record intraday highs. WSJ
Company news accounted for the other big moves. Schneider Electric is paying $205 a share in cash for PTC, valuing it at about $22.6 billion. WSJ Vaxcyte closed +30.77% after its VAX-31 pneumococcal vaccine met its primary endpoints in a Phase 3 trial. Intel fell more than 4% before the open on reports that TSMC is in talks to join Elon Musk's Terafab chip venture in Texas, where Intel is already a partner. TSMC (TSM) closed +2.84%, and the model assigns about 1.4 points of that to the stock itself.
Stocks are moving on their own stories, and that shows up in correlation. Realized correlation between stocks is 9.53% over 20 days. That is the 7.4th percentile since 2020, but near the top of the past three months (90.5th percentile). Implied correlation (Cboe COR1M) is 8.7, in the lowest 2.4% of its 20-year history, so options prices assume stocks will keep moving independently.
The ten-year Treasury yield rose 3.4 bps to 5.31% and the 30-year rose 3.6 bps to 5.67%, while the two-year slipped 0.2 bp. Long rates rising while short rates held steady means the yield curve steepened. CNBC The ten-year is now within 4 bps of the 24-year high of 5.344% it reached Thursday. WSJ
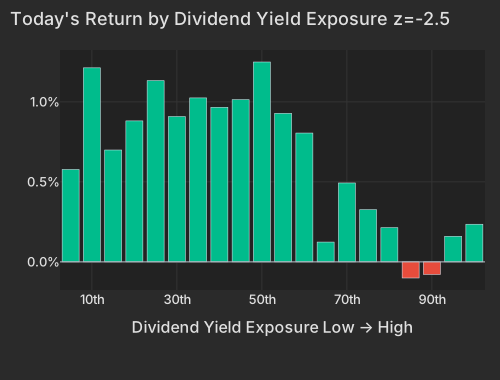
Across sectors, high-payout stocks lagged low-payout ones. Dividend Yield fell -0.44% at z=-2.49, a return in the 0.6th percentile since 2020. Today's drop is most of the factor's -0.58% loss over 20 days, and its 63-day z-score is flat at 0.0. Real-estate funds had been falling for weeks while the payout factor stayed flat: IYR's 20-session loss is in the 6.6th percentile of its history since 2019. Today the pressure on these bond substitutes spread from real estate to high-payout stocks in every sector. XLRE traded at 1.9× its typical session pace.
| ETF | Theme | Today | 1d Ago | 5d Ago | 20d Ago | 63d Ago |
|---|---|---|---|---|---|---|
| TLT | long-term Treasuries | -0.52% | -0.30% | -1.93% | -5.21% | -8.25% |
| IYR | real estate | -0.41% | +0.32% | -1.92% | -7.20% | -7.51% |
| XLRE | real estate | -0.38% | +0.32% | -1.80% | -7.01% | -7.09% |
| ITB | homebuilders | -1.24% | -0.84% | -3.12% | -6.67% | -13.76% |
| FXE | euro | -0.26% | +0.15% | -1.18% | -3.14% | -1.42% |
| FEZ | euro-zone stocks | -0.40% | +1.39% | -2.40% | -4.93% | -3.48% |
| XOP | oil producers | +1.31% | +0.34% | +1.89% | -3.45% | +20.61% |
| USO | crude oil | -2.30% | -1.77% | -0.65% | +3.72% | +41.23% |
Rate-sensitive funds fell together across the 5-, 20- and 63-day columns, and today's losses added to that run. Spain added to the dollar's gains. Prime Minister Pedro Sánchez called a snap election for November 29, FT and the euro fell to a 16-month low. WSJ The euro fund FXE traded at 4.0× its usual pace. The dollar index touched 102.54, its highest in a year, and stood at 102.15 at 4:13 PM ET. CNBC WTI crude was $89.35 at 4:02 PM ET, down -1.93%, after G7 nations pledged to release 100 million barrels from reserves. Economic Times CNBC Oil producers rose anyway, with the Oil factor up +0.39%.
| Bucket | Avg Ret Pct |
|---|---|
| 1 | 0.58 |
| 2 | 1.21 |
| 3 | 0.70 |
| 4 | 0.88 |
| 5 | 1.13 |
| 6 | 0.91 |
| 7 | 1.02 |
| 8 | 0.97 |
| 9 | 1.01 |
| 10 | 1.25 |
| 11 | 0.93 |
| 12 | 0.80 |
| 13 | 0.12 |
| 14 | 0.49 |
| 15 | 0.33 |
| 16 | 0.21 |
| 17 | -0.10 |
| 18 | -0.08 |
| 19 | 0.16 |
| 20 | 0.24 |
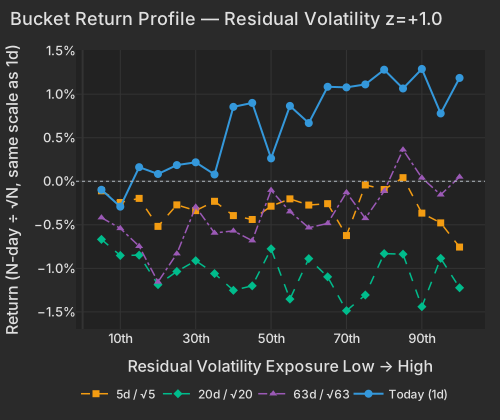
Residual Volatility, which rose +0.50% at z=+1.0, is the other side of the same move. Measured before the model separates the factors, high-payout stocks are mostly the calmer ones. That factor is up +3.63% over 60 sessions.
| Bucket | Ret 1D Pct | Ret 5D Norm Pct | Ret 20D Norm Pct | Ret 63D Norm Pct |
|---|---|---|---|---|
| 1 | -0.10 | -0.11 | -0.67 | -0.42 |
| 2 | -0.29 | -0.24 | -0.85 | -0.54 |
| 3 | 0.16 | -0.20 | -0.85 | -0.75 |
| 4 | 0.08 | -0.52 | -1.19 | -1.16 |
| 5 | 0.19 | -0.27 | -1.04 | -0.83 |
| 6 | 0.22 | -0.34 | -0.91 | -0.29 |
| 7 | 0.08 | -0.23 | -1.06 | -0.59 |
| 8 | 0.85 | -0.39 | -1.25 | -0.57 |
| 9 | 0.90 | -0.44 | -1.20 | -0.68 |
| 10 | 0.26 | -0.29 | -0.78 | -0.10 |
| 11 | 0.87 | -0.20 | -1.35 | -0.35 |
| 12 | 0.67 | -0.27 | -0.89 | -0.53 |
| 13 | 1.09 | -0.26 | -1.10 | -0.48 |
| 14 | 1.08 | -0.62 | -1.49 | -0.13 |
| 15 | 1.11 | -0.04 | -1.31 | -0.43 |
| 16 | 1.28 | -0.09 | -0.83 | -0.11 |
| 17 | 1.07 | 0.04 | -0.84 | 0.36 |
| 18 | 1.29 | -0.37 | -1.44 | 0.04 |
| 19 | 0.78 | -0.48 | -0.89 | -0.15 |
| 20 | 1.19 | -0.76 | -1.22 | 0.05 |
Treasury coupon auctions and Wednesday's release of the FOMC minutes are the next tests for the ten-year federalreserve.gov. WSJ The Brazil gains now depend on the October 25 runoff.
The ISM Non-Manufacturing index for September came out at 10:00 AM ET. The headline fell to 54.9, below the 55.1 forecast, while the prices-paid gauge rose to 74.0, its highest since July 2022. The ten-year yield went from 5.28% at the open to 5.33% by the afternoon. WSJ
Variance decomposition: live intraday — 20261005 session, bracketed against its trailing-year range. Factor returns are trailing through last close. Total cross-sectional dispersion: 54%ile of the past year.
Variance mix — % of total, today vs 1d ago vs 1-yr avg
market 59%ile style 5.6%ile thematic 28%ile idiosyncratic 88%ile
Variance explained — today vs. factor's trailing-year range
Marker = the factor's share of today's total variance, placed in its own trailing-year range (box 25–75%ile, ticks 90%ile and max). Amber marker = unusually load-bearing today (≥90%ile of its own year). Factor name green = up today / red = down.
Correlation & dispersion — realized vs implied
Pairwise realized correlation (20d): 9.53% 7.4%ile since 2020 · 90.5%ile 3m
Top-500 pairwise: 12.31% 14%ile since 2020 · 95.2%ile 3m · implied (Cboe COR1M): 8.70 2.4%ile of its own history (gap +3.6pp)
Realized 20d vol (ann. pts): all stocks 37 vs VIXEQ 38 · index 10 vs VIX 16 · style factors 17 56%ile
20-day window (19 completed days + today); percentiles vs model history since 2020; '3m' tokens rank vs the trailing 63 trading days; definitions in Terms below. Implied prints (Cboe) are delayed ~15 min. as of 15:58 ET
Top 50 high-beta momentum names (eq-wt, since-2020 rank): -0.2% 42%ile · rest of market +0.7%
| Factor | Today | 1d | 5d | 20d | 60d |
|---|---|---|---|---|---|
| Style-Risk | |||||
| International | +0.40% z+1.4 | +0.01% | -0.08% | -0.30% | +0.78% |
| Residual Volatility | +0.50% z+1.0 | -0.34% | +0.85% | +1.10% | +3.63% |
| Beta | -0.18% z-0.2 | +0.84% | +1.81% | +4.86% | +0.69% |
| Style | |||||
| Dividend Yield | -0.44% z-2.5 | -0.08% | -0.52% | -0.58% | -0.31% |
| Value | -0.31% z-1.3 | -0.02% | +0.23% | -0.39% | +0.48% |
| Growth | +0.15% z+0.6 | -0.20% | +0.20% | +0.23% | +1.08% |
| Leverage | -0.10% z-0.6 | +0.12% | -0.41% | -1.61% | -3.99% |
| Liquidity | -0.13% z-0.5 | -0.41% | -0.53% | -0.37% | +2.38% |
| Size | +0.14% z+0.4 | +0.12% | +0.21% | +2.79% | +2.36% |
| Profitability | +0.03% z+0.2 | -0.13% | +0.24% | +0.49% | -1.04% |
| Style-Momentum | |||||
| Short-Term Momentum | +0.19% z+0.6 | +0.27% | +0.15% | -0.27% | -7.24% |
| Long-Term Momentum | -0.19% z-0.3 | +0.23% | +0.67% | +3.84% | -0.46% |
| One-Day Momentum | +0.04% z+0.1 | -0.16% | +0.01% | -1.43% | -2.45% |
| Medium-Term Momentum | +0.01% z+0.0 | +0.21% | -0.04% | -0.73% | +0.10% |
| Style-Positioning | |||||
| Hedge-Fund Ownership | +0.05% z+0.5 | -0.14% | -0.24% | -0.52% | -0.53% |
| Short Interest | +0.07% z+0.4 | -0.11% | -0.04% | -0.91% | -1.76% |
| Style-Flow | |||||
| Morning Activity | +0.08% z+0.6 | -0.19% | -0.40% | -1.09% | +1.31% |
| Short-Sale Activity | -0.01% z-0.1 | +0.08% | -0.07% | +0.05% | +0.90% |
| Thematic | |||||
| Bitcoin / Crypto | +0.41% z+1.4 | -0.47% | +0.25% | +0.19% | +1.92% |
| Oil | +0.39% z+0.8 | +0.10% | +0.97% | +1.84% | +5.66% |
| China | +0.31% z+0.8 | -0.44% | -0.11% | +0.10% | +1.39% |
| Semiconductors | -0.40% z-0.7 | +0.48% | +0.38% | +1.98% | -2.31% |
| Treasury (Duration) | -0.08% z-0.2 | -0.36% | -0.88% | -2.56% | -2.29% |
| Gold | +0.08% z+0.2 | +0.10% | -0.69% | -1.67% | +3.64% |
5/20/60d windows include today's session; 1d is the previous session.
Factor z-score. Today's factor return divided by its daily-return standard deviation over ~1,600 trading days.
Stock-specific (idiosyncratic) return. The part of a stock's move not explained by market, style, or thematic factors in our decomposition.
VIXEQ / DSPX / COR1M. Cboe implied indices: single-stock volatility, dispersion, and 1-month implied correlation (top-50 S&P names). Quotes delayed ~15 minutes.
Data compiled by FactorPulse AI; edited and verified by Jeff Klein. For informational purposes only. Does not constitute financial advice, an investment recommendation, or an offer to buy or sell any securities. Always consult a qualified financial professional before making investment decisions.
For more on factor construction methodology, see www.factorpulse.com/glossary.