Employers added just 29,000 jobs in September, far short of the more than 80,000 economists expected. Traders read the miss as a reason to delay the Federal Reserve's next rate hike, not cancel it. Odds of a hike at the late-October meeting fell to about 17% from 36% a week earlier, while bets on a December move held near 75%. That kept Treasuries under pressure: the two-year yield rose about 5 basis points to roughly 4.83%, and the 10-year climbed to about 5.3%. Gold initially jumped above $4,200 before reversing to around $4,140. Stocks cheered the softer data, with chip stocks up about 2%, large U.S. stocks up about 0.7%, and Wall Street's fear gauge easing to about 15. Rate-sensitive corners kept lagging for a fifth straight day, and utility and real-estate stocks are now down about 6% over the past month.
The day's biggest casualties were hard-drive makers Seagate and Western Digital, which each fell about 10%, erasing roughly $40 billion in combined market value. The trigger was a Nikkei report that Japan's Toshiba will spend ¥60 billion to double its hard-drive capacity for AI data centers by fiscal 2027, aiming to triple its market share to 30%. It is the first named challenge to the supply shortage that has powered storage stocks' recent run. Morgan Stanley stood by its bullish call on Seagate, arguing the new capacity won't close the gap through 2028.
SpaceX rose 7.5%, adding about $138 billion in value, after TD Cowen started coverage with a Buy rating and the company confirmed a $920 million-a-month AI computing deal with Google parent Alphabet. Consulting giant Accenture gave back about 6% a day after its record rally of roughly 20%. Nike fell about 3.5% after cutting its fiscal 2027 revenue outlook and announcing layoffs. In private credit, Blue Owl again capped quarterly withdrawals at 5% at two of its funds after requests reached as high as 39% of shares. Oil slipped 1.5% to about $91.50 a barrel as France proposed a new release of European and international emergency reserves.
The Bureau of Labor Statistics said nonfarm payrolls rose 29,000 in September, below the prior 12-month average of 45,000 bls.gov. BLS Consensus was above 80,000. CME FedWatch odds of a hike at the October 27–28 meeting fell to 17% from 36% a week earlier. CNBC The same pricing still puts the odds of a December hike at 75%. CNBC
That December number explains the bond market. At 4:13 PM ET the two-year yield was 4.833%, up 4.6 bps. CNBC The middle of the curve moved most: the three-year rose 5.8 bps, while the 30-year added only 2.5 bps to 5.628%. CNBC Earlier this week the 30-year drove the selloff while the front end held. Today the maturities that price the next few Fed meetings led, which reads as a hike postponed, not cancelled.
The first reaction went the other way and did not last. Spot gold traded as high as $4,223.95, then slid to $4,142.13 by 4:13 PM ET, down -0.85%. CNBC The dollar index slipped to 101.90 (-0.19%), just below Thursday's one-year high of 102.21. CNBC
| Factor | Return | Z-Score | 5d Z | 20d Z | 63d Z | Category | Direction |
|---|---|---|---|---|---|---|---|
| Beta | +0.85% | 0.88 | +0.5 | +1.5 | -0.1 | Style-Risk | High-beta names led |
| Semiconductors | +0.48% | 0.80 | +0.8 | +1.3 | -0.2 | Thematic | Chip-exposed names led |
| Treasury (Duration) | -0.33% | -1.04 | -1.54 | -1.65 | -0.95 | Thematic | Bond-sensitive names lagged |
| Hedge-Fund Ownership | -0.15% | -1.34 | -1.20 | -1.04 | -0.31 | Style-Positioning | Hedge-fund-crowded names lagged |
| Bitcoin / Crypto | -0.48% | -1.60 | -0.45 | -0.45 | 0.66 | Thematic | Crypto-exposed names lagged |
| Liquidity | -0.41% | -1.53 | -1.01 | 0.13 | 1.28 | Style | Low-turnover beat high-turnover |
| Morning Activity | -0.18% | -1.41 | -1.93 | -2.30 | 1.07 | Style-Flow | Habitually morning-heavy names lagged |
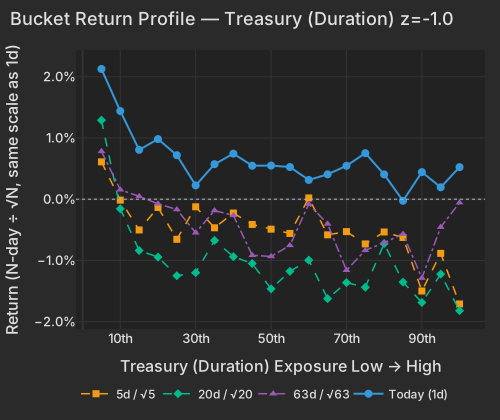
The Treasury-duration factor fell -0.33% at z=-1.0. It has now fallen in each of the last five sessions, today included, for a 20-day loss of -2.38%. The stocks least sensitive to bond prices gained +2.13% as a group, led by AI and data-center hardware names. So the rally went to the names furthest from the rates debate. The Beta factor returned +0.85%, and the high-beta momentum cohort rose +2.94% against +0.22% for the rest of the market.
| Bucket | Ret 1D Pct | Ret 5D Norm Pct | Ret 20D Norm Pct | Ret 63D Norm Pct |
|---|---|---|---|---|
| 1 | 2.13 | 0.61 | 1.29 | 0.78 |
| 2 | 1.44 | -0.01 | -0.16 | 0.15 |
| 3 | 0.81 | -0.50 | -0.84 | 0.05 |
| 4 | 0.98 | -0.13 | -0.95 | -0.07 |
| 5 | 0.72 | -0.65 | -1.25 | -0.17 |
| 6 | 0.23 | -0.12 | -1.20 | -0.55 |
| 7 | 0.57 | -0.47 | -0.67 | -0.19 |
| 8 | 0.74 | -0.23 | -0.94 | -0.26 |
| 9 | 0.55 | -0.41 | -1.05 | -0.92 |
| 10 | 0.55 | -0.49 | -1.46 | -0.93 |
| 11 | 0.53 | -0.56 | -1.18 | -0.75 |
| 12 | 0.31 | 0.02 | -0.99 | -0.08 |
| 13 | 0.41 | -0.58 | -1.62 | -0.40 |
| 14 | 0.55 | -0.53 | -1.36 | -1.16 |
| 15 | 0.75 | -0.73 | -1.44 | -0.83 |
| 16 | 0.41 | -0.54 | -0.73 | -0.71 |
| 17 | -0.03 | -0.62 | -1.35 | -0.57 |
| 18 | 0.44 | -1.50 | -1.69 | -1.29 |
| 19 | 0.20 | -0.88 | -1.22 | -0.46 |
| 20 | 0.52 | -1.71 | -1.82 | -0.06 |
| ETF | Theme | Today (session) | 1d Ago | 5d Ago | 20d Ago | 63d Ago |
|---|---|---|---|---|---|---|
| SMH | semiconductors | +2.10% | +1.45% | +2.88% | +12.23% | +4.31% |
| QQQ | large cap growth | +0.98% | +0.31% | +0.13% | +4.73% | +4.24% |
| IWM | small cap | +0.87% | +0.41% | -0.94% | -4.85% | -5.99% |
| SPY | large cap | +0.74% | +0.18% | -0.42% | +0.09% | +2.83% |
| XLRE | real estate | +0.37% | -0.56% | -2.33% | -6.20% | -8.19% |
| XLU | utilities | +0.35% | +0.61% | +0.81% | -6.32% | -12.65% |
| TLT | long-term bonds | -0.32% | +0.31% | -1.76% | -4.79% | -8.04% |
| MUB | municipal bonds | -0.41% | +0.51% | +0.03% | -2.50% | -4.95% |
| DRAM | memory chips & storage | -0.46% | +2.77% | +2.16% | +10.35% | +2.31% |
The table splits cleanly: chips are up double digits over a month, while utilities, real estate and bonds are down by similar amounts. The rate-sensitive funds are near the edge of their own histories. XLU's 63-day loss through Thursday is in the worst 2.7% of 63-day stretches since 2019. MUB's 20-day loss ranks at the 3.6th percentile on the same basis.
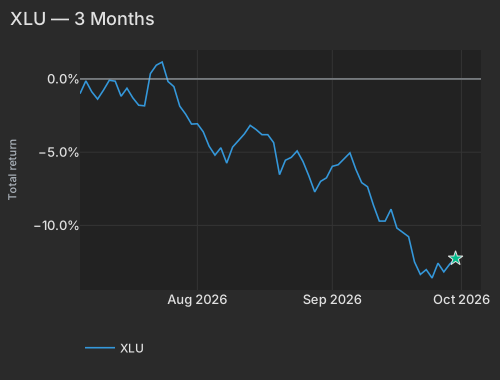
| Date | Ret Pct |
|---|---|
| 2026-07-06 | -1.01 |
| 2026-07-07 | -0.13 |
| 2026-07-08 | -0.87 |
| 2026-07-09 | -1.38 |
| 2026-07-10 | -0.76 |
| 2026-07-13 | -0.09 |
| 2026-07-14 | -0.15 |
| 2026-07-15 | -1.18 |
| 2026-07-16 | -0.63 |
| 2026-07-17 | -1.29 |
| 2026-07-20 | -1.79 |
| 2026-07-21 | -1.84 |
| 2026-07-22 | 0.37 |
| 2026-07-23 | 0.94 |
| 2026-07-24 | 1.16 |
| 2026-07-27 | -0.17 |
| 2026-07-28 | -0.52 |
| 2026-07-29 | -1.86 |
| 2026-07-30 | -2.40 |
| 2026-07-31 | -3.08 |
| 2026-08-03 | -3.06 |
| 2026-08-04 | -3.61 |
| 2026-08-05 | -4.59 |
| 2026-08-06 | -5.20 |
| 2026-08-07 | -4.70 |
| 2026-08-10 | -5.75 |
| 2026-08-11 | -4.65 |
| 2026-08-12 | -4.20 |
| 2026-08-13 | -3.76 |
| 2026-08-14 | -3.17 |
| 2026-08-17 | -3.45 |
| 2026-08-18 | -3.80 |
| 2026-08-19 | -3.80 |
| 2026-08-20 | -4.35 |
| 2026-08-21 | -6.53 |
| 2026-08-24 | -5.55 |
| 2026-08-25 | -5.35 |
| 2026-08-26 | -4.92 |
| 2026-08-27 | -5.64 |
| 2026-08-28 | -6.62 |
| 2026-08-31 | -7.71 |
| 2026-09-01 | -6.99 |
| 2026-09-02 | -6.75 |
| 2026-09-03 | -5.97 |
| 2026-09-04 | -5.86 |
| 2026-09-08 | -5.05 |
| 2026-09-09 | -6.16 |
| 2026-09-10 | -7.08 |
| 2026-09-11 | -7.36 |
| 2026-09-14 | -8.61 |
| 2026-09-15 | -9.70 |
| 2026-09-16 | -9.70 |
| 2026-09-17 | -8.89 |
| 2026-09-18 | -10.18 |
| 2026-09-21 | -10.49 |
| 2026-09-22 | -10.77 |
| 2026-09-23 | -12.49 |
| 2026-09-24 | -13.35 |
| 2026-09-25 | -13.02 |
| 2026-09-28 | -13.59 |
| 2026-09-29 | -12.58 |
| 2026-09-30 | -13.17 |
| 2026-10-01 | -12.65 |
| 2026-10-02 | -12.26 |
The bond pressure is weighing on which stocks win, not on the index's level. SPY closed +0.74% and the VIX fell to 15.41. A z of -1.0 on the duration factor is an ordinary daily move. Utilities rose +0.35% in absolute terms, trading at about twice their typical session volume.
Seagate closed -10.14% and Western Digital -10.25%, together erasing about $40B of market value. The trigger was a Nikkei report that Toshiba will spend ¥60 billion to double its AI data-center hard-drive capacity by fiscal 2027. Toshiba is also targeting a 30% market share, up from 10%. WSJ The factor model gave each stock about +1.2% from its beta, chip and 12-month momentum exposures. That puts the stock-specific damage near -12% each.
The memory-chip and storage ETF DRAM closed -0.46% while SMH gained, after a 20-day run of +10.35%. This is the first named supply response to the shortage behind those gains: a competitor now has a capacity date on the calendar. Morgan Stanley kept its Overweight rating on Seagate, arguing the added capacity will not close the supply gap through 2028. WSJ
SpaceX (SPCX) closed +7.50%, adding roughly $138B of market value. TD Cowen started coverage at Buy, and the company confirmed a $920 million-a-month AI computing deal with Alphabet. GLOBAL Synaptics (SYNA) rose +14.05% after ON Semiconductor switched its offer to $123 a share in cash. WSJ Accenture (ACN) closed -6.17% a day after its record roughly 20% rally, a pullback described as profit-taking. WSJ Nike (NKE) closed -3.52% after cutting its fiscal 2027 revenue outlook and announcing layoffs. Bloomberg
In private credit, Blue Owl again limited quarterly redemptions to 5% at two non-traded funds, Bloomberg and Reuters reported Friday. Withdrawal requests reached 39% of shares at the tech-focused OTIC and 16.8% at the flagship OCIC. Blackstone Secured Lending (BXSL) closed -1.23% on a rising market, then recovered +0.64% after the bell. WTI crude was $91.48 at 4:03 PM ET, down -1.50%. CNBC France proposed a new release of EU and IEA diesel and crude reserves. Bloomberg
The Employment Situation report, released at 8:30 AM ET, showed weak detail beneath the 29,000 headline. Health care added 17,000 jobs against its 12-month average of 33,000, and the unemployment rate was 4.2%. BLS The New York Fed's Staff Nowcast, released at 12:45 PM ET, cut its fourth-quarter 2026 growth estimate to 2.5% from 2.6% and raised the third quarter to 2.5% from 2.3%.
Variance decomposition: live intraday — 20261002 session, bracketed against its trailing-year range. Factor returns are trailing through last close. Total cross-sectional dispersion: 19%ile of the past year.
Variance mix — % of total, today vs 1d ago vs 1-yr avg
market 68%ile style 46%ile thematic 82%ile idiosyncratic 44%ile
Variance explained — today vs. factor's trailing-year range
Marker = the factor's share of today's total variance, placed in its own trailing-year range (box 25–75%ile, ticks 90%ile and max). Amber marker = unusually load-bearing today (≥90%ile of its own year). Factor name green = up today / red = down.
Correlation & dispersion — realized vs implied
Pairwise realized correlation (20d): 9.02% 6.3%ile since 2020 · 79%ile 3m
Top-500 pairwise: 11.13% 11%ile since 2020 · 84%ile 3m · implied (Cboe COR1M): 8.21 1.8%ile of its own history (gap +2.9pp)
Realized 20d vol (ann. pts): all stocks 37 vs VIXEQ 38 · index 10 vs VIX 15 · style factors 18 61%ile
20-day window (19 completed days + today); percentiles vs model history since 2020; '3m' tokens rank vs the trailing 63 trading days; definitions in Terms below. Implied prints (Cboe) are delayed ~15 min. as of 15:58 ET
High-beta momentum cohort (eq-wt, since-2020 rank): +2.9% 90.7%ile · rest of market +0.2%
| Factor | Today | 1d | 5d | 20d | 60d |
|---|---|---|---|---|---|
| Style-Risk | |||||
| Beta | +0.85% z+0.9 | +0.30% | +0.99% | +6.54% | +0.50% |
| Residual Volatility | -0.32% z-0.6 | +0.28% | +0.15% | +0.24% | +2.67% |
| International | +0.01% z+0.0 | -0.46% | -0.47% | -0.74% | +0.54% |
| Style | |||||
| Liquidity | -0.41% z-1.5 | +0.06% | -0.60% | +0.16% | +2.45% |
| Growth | -0.21% z-0.9 | +0.21% | +0.11% | +0.06% | +0.82% |
| Leverage | +0.14% z+0.8 | -0.22% | -0.48% | -1.26% | -3.83% |
| Profitability | -0.11% z-0.6 | +0.34% | +0.45% | +0.74% | -0.54% |
| Dividend Yield | -0.06% z-0.3 | +0.10% | -0.09% | -0.06% | +0.33% |
| Size | +0.11% z+0.3 | -0.19% | +0.19% | +2.43% | +2.45% |
| Value | -0.02% z-0.1 | +0.49% | +0.38% | +0.13% | +1.12% |
| Style-Momentum | |||||
| Short-Term Momentum | +0.25% z+0.8 | -0.20% | +0.23% | -0.41% | -7.57% |
| Medium-Term Momentum | +0.20% z+0.7 | -0.03% | -0.25% | -1.52% | -0.10% |
| One-Day Momentum | -0.19% z-0.7 | +0.27% | -0.10% | -1.91% | -2.66% |
| Long-Term Momentum | +0.21% z+0.3 | +0.30% | +1.32% | +4.64% | -0.80% |
| Style-Positioning | |||||
| Hedge-Fund Ownership | -0.15% z-1.4 | -0.19% | -0.30% | -0.51% | -0.60% |
| Short Interest | -0.11% z-0.7 | -0.20% | -0.01% | -1.20% | -1.93% |
| Style-Flow | |||||
| Morning Activity | -0.17% z-1.4 | -0.28% | -0.53% | -1.28% | +1.16% |
| Short-Sale Activity | +0.08% z+0.8 | +0.02% | -0.18% | -0.03% | +0.92% |
| Thematic | |||||
| Bitcoin / Crypto | -0.48% z-1.6 | +0.06% | -0.30% | -0.61% | +1.19% |
| Treasury (Duration) | -0.34% z-1.0 | -0.30% | -1.11% | -2.38% | -1.98% |
| China | -0.41% z-1.0 | -0.11% | -0.25% | -0.11% | +1.31% |
| Semiconductors | +0.48% z+0.8 | +0.36% | +1.08% | +3.65% | -1.78% |
| Gold | +0.11% z+0.3 | -0.58% | -0.79% | -2.26% | +3.44% |
| Oil | +0.07% z+0.1 | +0.25% | +0.66% | +1.35% | +5.02% |
5/20/60d windows include today's session; 1d is the previous session.
Factor z-score. Today's factor return divided by its daily-return standard deviation over ~1,600 trading days.
High-beta momentum cohort. US names above $2B market cap in the top quintile of both raw beta and 12-month momentum; membership frozen at each month's first business day. “Top 50” = the 50 strongest by combined rank.
Stock-specific (idiosyncratic) return. The part of a stock's move not explained by market, style, or thematic factors in our decomposition.
Data compiled by FactorPulse AI; edited and verified by Jeff Klein. For informational purposes only. Does not constitute financial advice, an investment recommendation, or an offer to buy or sell any securities. Always consult a qualified financial professional before making investment decisions.
For more on factor construction methodology, see www.factorpulse.com/glossary.