A far weaker-than-expected September jobs report sent stocks higher before Friday's opening bell, with chipmakers and smaller companies leading the way. Employers added just 29,000 jobs, about a third of the 90,000 economists expected. Revisions cut another 60,000 from July and August, wages barely rose and unemployment stood at 4.2%. The report locked in expectations that the Federal Reserve will hold rates steady at its Oct. 27-28 meeting. Most of the market's roughly 0.7% pre-market gain came after the 8:30 a.m. release. Nvidia rose about 2%, adding roughly $125 billion in market value, homebuilders were among the biggest gainers, and the dollar slipped a day after hitting a 52-week high.
The bond rally was concentrated in short-term Treasurys. The two-year yield fell to about 4.7%, while the 30-year barely budged from about 5.6%, the third time this week that pattern has shown up. That left little help for utilities and heavily indebted companies, which usually benefit most from lower rates. Utilities, near one of their worst three-month slumps in years, rose only modestly. Oil went the other way: U.S. crude fell nearly 4% to about $89 a barrel after France proposed that the European Union and the International Energy Agency release diesel and crude stockpiles as a hedge against a possible U.S. energy-export ban. That outweighed China's move to bring back curbs on fuel exports, and energy was the only sector in the red.
Disk-drive maker Seagate fell nearly 11%, erasing about $24 billion in value, and rival Western Digital dropped about 7.5% after Nikkei Asia reported that Toshiba will spend roughly $380 million on its Philippines plants to double hard-disk supply for AI data centers by fiscal 2027. Nike slid 8% after its quarterly report, as it cut its fiscal 2027 outlook to a high-single-digit revenue decline and announced a $2.5 billion restructuring plan. In private credit, Blue Owl again capped withdrawals at 5% in two funds after $4.2 billion of redemption requests.
Nonfarm payrolls rose 29,000 in September against a 90,000 consensus, and unemployment is 4.2% bls.gov. BLS Revisions took 60,000 jobs out of July and August, and average hourly earnings rose only 0.1% on the month. BLS The weak report locked in expectations that the Fed will hold at its October 27–28 meeting. BLS
The two-year yield is down 5.8 bps at 4.73%. CNBC The 30-year is down only 2.5 bps, at 5.58%, so the curve is steepening from the short end. CNBC This is the third time this week that relief has shown up in short-dated yields while the long bond stays heavy. The dollar index is -0.22% at 101.87 as of 8:51 AM ET, one day after hitting its 52-week high. CNBC The broad market was up +0.30% at its 8:05 low and +0.74% by 8:40. Most of the pre-market gain came after the 8:30 release.
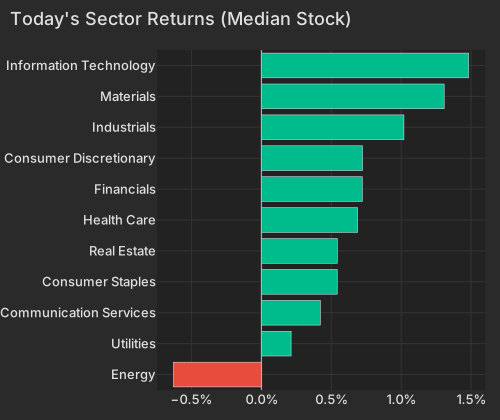
Beta is up +0.75% (z=+0.78), meaning the most market-sensitive names are beating the defensive ones. That adds to a +6.45% run over the past 20 sessions. Lower yields would normally help long-duration growth stocks and utilities. Instead, Growth is -0.06% and the Treasury (Duration) factor is +0.02%. The median utility is up only +0.21%, the second-weakest of 11 sectors.
| Factor | Return | Z-Score | 5d Z | 20d Z | 63d Z | Category | Direction |
|---|---|---|---|---|---|---|---|
| Beta | +0.75% | +0.78 | +0.42 | +1.5 | -0.07 | Style-Risk | High-beta names beating low-beta |
| Oil | -0.40% | -0.83 | +0.19 | +0.42 | +1.59 | Thematic | Oil-exposed names lagging |
| Growth | -0.06% | -0.26 | +0.5 | +0.2 | +0.8 | Style | Flat |
| Treasury (Duration) | +0.02% | +0.06 | -1.0 | -1.4 | -0.8 | Thematic | Flat despite lower yields |
| Leverage | +0.05% | +0.28 | -1.52 | -1.79 | -2.99 | Style | Barely bouncing after a three-month slide |
| Short-Term Momentum | +0.12% | +0.39 | +0.13 | -0.40 | -3.56 | Style-Momentum | Last week's winners roughly holding |
Nvidia is up +2.22%, adding $125.3B of market value. The gain is split between the market, its factor exposures and its own move. More of Arm's (ARM) +4.01% gain comes from its factor exposures than from company news. Almost all of Wolfspeed's (WOLF) +3.53% gain comes from those exposures. The index-wide move already explains 22% of stock-level variance before the open, against a 9% one-year average, so the jobs report is moving nearly everything in the same direction. The high-beta momentum cohort is up +1.83%, against +0.51% for the rest of the market. The VIX has eased to 16.04 from 16.39.
| Sector | Median Ret Pct |
|---|---|
| Energy | -0.63 |
| Utilities | 0.21 |
| Communication Services | 0.42 |
| Consumer Staples | 0.54 |
| Real Estate | 0.54 |
| Health Care | 0.69 |
| Financials | 0.72 |
| Consumer Discretionary | 0.72 |
| Industrials | 1.02 |
| Materials | 1.31 |
| Information Technology | 1.48 |
Homebuilders are the one part of the equity market where the bond rally shows up. ITB and XHB are near the top of the ETF table, though both are still down double digits over 63 days.
| ETF | Theme | Today | 1d Ago | 5d Ago | 20d Ago | 63d Ago |
|---|---|---|---|---|---|---|
| SMH | semiconductors | +2.38% | +1.45% | +2.88% | +12.23% | +4.31% |
| ITB | homebuilders | +2.13% | +0.40% | -1.06% | -5.08% | -14.37% |
| IWM | small cap | +1.56% | +0.41% | -0.94% | -4.85% | -5.99% |
| QQQ | large cap growth | +1.26% | +0.31% | +0.13% | +4.73% | +4.24% |
| DRAM | memory chips & storage | +1.05% | +2.77% | +2.16% | +10.35% | +2.31% |
| XLU | utilities | +0.74% | +0.61% | +0.81% | -6.32% | -12.65% |
| TLT | long-term bonds | +0.59% | +0.31% | -1.76% | -4.79% | -8.04% |
| XLE | energy | -1.24% | +1.95% | +0.16% | -3.10% | +18.53% |
| VXX | volatility | -1.77% | +1.02% | +1.25% | -1.28% | -19.28% |
| USO | oil | -4.13% | +2.99% | -2.01% | +6.28% | +44.28% |
WTI crude is at $89.30 as of 8:41 AM ET, down -3.84%. CNBC France has proposed that the EU and the IEA release diesel and crude stocks, as a hedge against a possible U.S. energy export ban. That proposal outweighed China's move to bring back curbs on fuel exports. Bloomberg The Oil factor is -0.40% (z=-0.83), and energy is the only sector whose median stock is down, at -0.63%. Equinor (EQNR) and APA (APA) are lower because of their oil exposure, not company news.
Seagate is down -10.70%, erasing $23.6B of market value. Western Digital (WDC) is down -7.49%, erasing $12.7B. Nikkei Asia reported that Toshiba will invest about ¥60 billion ($380 million) in its Philippines plants to double hard-disk supply for AI data centers by fiscal 2027. Almost all of Seagate's drop is its own move, an unusually large stock-specific decline for the name, so investors are pricing the Toshiba report directly. Western Digital is falling even though its beta exposure alone would have added +1.37%. The memory-chip ETF (DRAM) is higher, so investors are treating this as a disk-drive supply problem.
Nike (NKE) is down -8.07%, erasing $4.2B, after its fiscal first-quarter report. Forbes reported that Nike cut its fiscal 2027 outlook to a high-single-digit revenue decline and announced a $2.5 billion restructuring plan. Synaptics (SYNA) is up +14.25%, trading just under onsemi's revised all-cash offer of $123 a share. WSJ Bloomberg and Reuters reported Friday that Blue Owl again capped quarterly redemptions at 5% in two private-credit funds, OCIC and OTIC, after $4.2 billion of withdrawal requests. Requests at the flagship OCIC fund slowed to 16.8% of shares from 18.8%. HYG and BXSL are little changed.
Leverage has lost -3.92% over the trailing 60 sessions, a 63-day z-score of z=-3.0. Over the same stretch, long bonds sold off, as TLT's 63-day loss shows. Today's yield drop has lifted the factor just +0.05% (z=+0.28). Debt-heavy companies getting nothing from a 5.8 bp drop in the two-year yield points to the 30-year as the real source of their pressure, and the 30-year has barely moved.
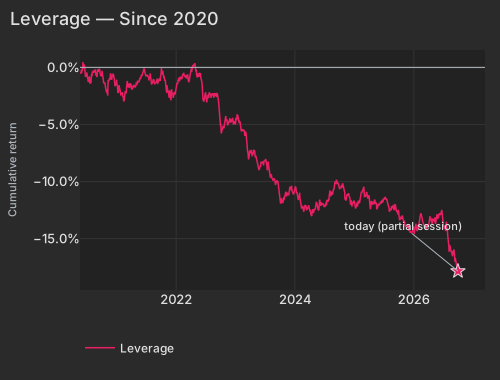
| Date | Cumret Pct |
|---|---|
| 2020-05-20 | -0.45 |
| 2020-06-12 | 0.15 |
| 2020-07-07 | -0.95 |
| 2020-07-29 | -0.62 |
| 2020-08-20 | -0.38 |
| 2020-09-14 | -0.29 |
| 2020-10-06 | -0.51 |
| 2020-10-28 | -1.98 |
| 2020-11-19 | -1.03 |
| 2020-12-14 | -0.86 |
| 2021-01-07 | -2.17 |
| 2021-02-01 | -2.31 |
| 2021-02-24 | -2.15 |
| 2021-03-18 | -1.62 |
| 2021-04-12 | -1.71 |
| 2021-05-04 | -1.51 |
| 2021-05-26 | -0.97 |
| 2021-06-18 | -0.14 |
| 2021-07-13 | -0.87 |
| 2021-08-04 | -1.51 |
| 2021-08-26 | -1.37 |
| 2021-09-20 | -1.05 |
| 2021-10-12 | -0.31 |
| 2021-11-03 | -1.87 |
| 2021-11-26 | -2.43 |
| 2021-12-20 | -2.40 |
| 2022-01-12 | -1.38 |
| 2022-02-04 | -0.98 |
| 2022-03-01 | -0.79 |
| 2022-03-23 | -1.06 |
| 2022-04-14 | 0.19 |
| 2022-05-09 | -0.66 |
| 2022-06-01 | -0.56 |
| 2022-06-24 | -2.75 |
| 2022-07-19 | -2.43 |
| 2022-08-10 | -2.31 |
| 2022-09-01 | -2.45 |
| 2022-09-26 | -4.14 |
| 2022-10-18 | -5.12 |
| 2022-11-09 | -4.68 |
| 2022-12-02 | -4.82 |
| 2022-12-27 | -4.70 |
| 2023-01-20 | -4.49 |
| 2023-02-13 | -5.37 |
| 2023-03-08 | -5.72 |
| 2023-03-30 | -7.38 |
| 2023-04-24 | -7.51 |
| 2023-05-16 | -8.48 |
| 2023-06-08 | -8.26 |
| 2023-07-03 | -8.14 |
| 2023-07-26 | -8.66 |
| 2023-08-17 | -9.75 |
| 2023-09-11 | -10.09 |
| 2023-10-03 | -11.70 |
| 2023-10-25 | -11.59 |
| 2023-11-16 | -10.98 |
| 2023-12-11 | -10.65 |
| 2024-01-04 | -10.60 |
| 2024-01-29 | -11.45 |
| 2024-02-21 | -12.23 |
| 2024-03-14 | -12.46 |
| 2024-04-08 | -12.51 |
| 2024-04-30 | -12.49 |
| 2024-05-22 | -12.28 |
| 2024-06-14 | -11.90 |
| 2024-07-10 | -12.12 |
| 2024-08-01 | -11.22 |
| 2024-08-23 | -10.79 |
| 2024-09-17 | -9.97 |
| 2024-10-09 | -10.47 |
| 2024-10-31 | -10.62 |
| 2024-11-22 | -11.17 |
| 2024-12-17 | -12.00 |
| 2025-01-13 | -12.20 |
| 2025-02-05 | -11.72 |
| 2025-02-28 | -10.50 |
| 2025-03-24 | -11.25 |
| 2025-04-15 | -12.17 |
| 2025-05-08 | -11.68 |
| 2025-06-02 | -12.09 |
| 2025-06-25 | -11.80 |
| 2025-07-18 | -11.53 |
| 2025-08-11 | -12.45 |
| 2025-09-03 | -12.41 |
| 2025-09-25 | -12.66 |
| 2025-10-17 | -13.12 |
| 2025-11-10 | -13.68 |
| 2025-12-03 | -14.08 |
| 2025-12-26 | -14.40 |
| 2026-01-21 | -14.15 |
| 2026-02-12 | -12.89 |
| 2026-03-09 | -13.88 |
| 2026-03-31 | -13.96 |
| 2026-04-23 | -13.29 |
| 2026-05-15 | -13.58 |
| 2026-06-09 | -12.80 |
| 2026-07-02 | -13.69 |
| 2026-07-27 | -13.96 |
| 2026-08-18 | -16.00 |
| 2026-09-10 | -16.29 |
| 2026-10-02 | -17.85 |
Utilities show the same pattern in ETF form. XLU's three-month loss ranks among the worst 3% of three-month stretches in its history, and today's gain has made little difference to it.
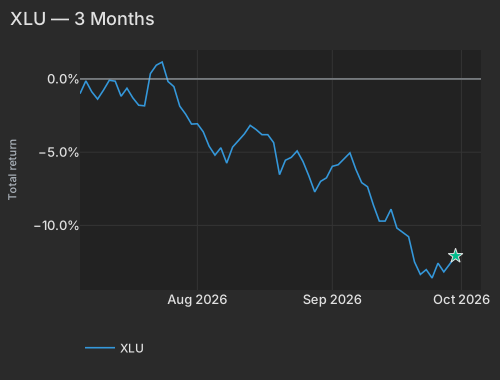
| Date | Ret Pct |
|---|---|
| 2026-07-06 | -1.01 |
| 2026-07-07 | -0.13 |
| 2026-07-08 | -0.87 |
| 2026-07-09 | -1.38 |
| 2026-07-10 | -0.76 |
| 2026-07-13 | -0.09 |
| 2026-07-14 | -0.15 |
| 2026-07-15 | -1.18 |
| 2026-07-16 | -0.63 |
| 2026-07-17 | -1.29 |
| 2026-07-20 | -1.79 |
| 2026-07-21 | -1.84 |
| 2026-07-22 | 0.37 |
| 2026-07-23 | 0.94 |
| 2026-07-24 | 1.16 |
| 2026-07-27 | -0.17 |
| 2026-07-28 | -0.52 |
| 2026-07-29 | -1.86 |
| 2026-07-30 | -2.40 |
| 2026-07-31 | -3.08 |
| 2026-08-03 | -3.06 |
| 2026-08-04 | -3.61 |
| 2026-08-05 | -4.59 |
| 2026-08-06 | -5.20 |
| 2026-08-07 | -4.70 |
| 2026-08-10 | -5.75 |
| 2026-08-11 | -4.65 |
| 2026-08-12 | -4.20 |
| 2026-08-13 | -3.76 |
| 2026-08-14 | -3.17 |
| 2026-08-17 | -3.45 |
| 2026-08-18 | -3.80 |
| 2026-08-19 | -3.80 |
| 2026-08-20 | -4.35 |
| 2026-08-21 | -6.53 |
| 2026-08-24 | -5.55 |
| 2026-08-25 | -5.35 |
| 2026-08-26 | -4.92 |
| 2026-08-27 | -5.64 |
| 2026-08-28 | -6.62 |
| 2026-08-31 | -7.71 |
| 2026-09-01 | -6.99 |
| 2026-09-02 | -6.75 |
| 2026-09-03 | -5.97 |
| 2026-09-04 | -5.86 |
| 2026-09-08 | -5.05 |
| 2026-09-09 | -6.16 |
| 2026-09-10 | -7.08 |
| 2026-09-11 | -7.36 |
| 2026-09-14 | -8.61 |
| 2026-09-15 | -9.70 |
| 2026-09-16 | -9.70 |
| 2026-09-17 | -8.89 |
| 2026-09-18 | -10.18 |
| 2026-09-21 | -10.49 |
| 2026-09-22 | -10.77 |
| 2026-09-23 | -12.49 |
| 2026-09-24 | -13.35 |
| 2026-09-25 | -13.02 |
| 2026-09-28 | -13.59 |
| 2026-09-29 | -12.58 |
| 2026-09-30 | -13.17 |
| 2026-10-01 | -12.65 |
| 2026-10-02 | -12.08 |
The 5-day reversion factor (Short-Term Momentum in the table) has lost -7.70% over 60 sessions, a 63-day z-score of z=-3.6. That means each week's leaders have reliably lagged the following week for three months. Its +0.12% this morning leaves that pattern intact. As long as the 30-year stays close to its highs, today's beta-led gains have to hold up against that reversal pattern, with no help from the rate-sensitive stocks.
The Employment Situation report, released at 8:30 AM ET, showed payrolls up 29,000 against a 90,000 consensus, with unemployment at 4.2%. BLS Two-year yields led the bond rally, and equities added to their pre-market gains in the following ten minutes. The New York Fed Staff Nowcast is due at 12:45 PM ET and is expected to move lower after the payroll miss.
Variance decomposition: live intraday — 20261002 session, bracketed against its trailing-year range. Factor returns are trailing through last close. Total cross-sectional dispersion: 2.4%ile of the past year.
Variance mix — % of total, today vs 1d ago vs 1-yr avg
market 90%ile style 75%ile thematic 64%ile idiosyncratic 13%ile
Variance explained — today vs. factor's trailing-year range
Marker = the factor's share of today's total variance, placed in its own trailing-year range (box 25–75%ile, ticks 90%ile and max). Amber marker = unusually load-bearing today (≥90%ile of its own year). Factor name green = up today / red = down.
Correlation & dispersion — realized vs implied
Pairwise realized correlation (20d): 9.51% 7.3%ile since 2020 · 89%ile 3m
Top-500 pairwise: 11.75% 13%ile since 2020 · 89%ile 3m · implied (Cboe COR1M): 9.60 3.7%ile of its own history (gap +2.1pp)
Realized 20d vol (ann. pts): all stocks 37 vs VIXEQ 39 · index 10 vs VIX 16 · style factors 18 60%ile
20-day window (19 completed days + today); percentiles vs model history since 2020; '3m' tokens rank vs the trailing 63 trading days; definitions in Terms below. Implied prints (Cboe) are delayed ~15 min. as of 08:41 ET
High-beta momentum cohort (eq-wt, since-2020 rank): +1.8% 78%ile · rest of market +0.5%
| Factor | Today | 1d | 5d | 20d | 60d |
|---|---|---|---|---|---|
| Style-Risk | |||||
| Beta | +0.75% z+0.8 | +0.30% | +0.90% | +6.45% | +0.40% |
| International | -0.14% z-0.5 | -0.46% | -0.61% | -0.89% | +0.40% |
| Residual Volatility | -0.01% z-0.0 | +0.28% | +0.45% | +0.55% | +2.98% |
| Style | |||||
| Profitability | -0.10% z-0.5 | +0.34% | +0.47% | +0.75% | -0.52% |
| Liquidity | -0.10% z-0.4 | +0.06% | -0.30% | +0.47% | +2.76% |
| Leverage | +0.05% z+0.3 | -0.22% | -0.57% | -1.35% | -3.92% |
| Growth | -0.06% z-0.3 | +0.21% | +0.26% | +0.21% | +0.97% |
| Value | +0.03% z+0.1 | +0.49% | +0.43% | +0.18% | +1.17% |
| Dividend Yield | -0.01% z-0.1 | +0.10% | -0.05% | -0.02% | +0.38% |
| Size | +0.02% z+0.1 | -0.19% | +0.10% | +2.34% | +2.36% |
| Style-Momentum | |||||
| Long-Term Momentum | -0.30% z-0.5 | +0.30% | +0.81% | +4.13% | -1.31% |
| Short-Term Momentum | +0.12% z+0.4 | -0.20% | +0.09% | -0.55% | -7.70% |
| Medium-Term Momentum | +0.11% z+0.4 | -0.03% | -0.34% | -1.61% | -0.20% |
| One-Day Momentum | -0.02% z-0.1 | +0.27% | +0.07% | -1.74% | -2.49% |
| Style-Positioning | |||||
| Hedge-Fund Ownership | +0.07% z+0.6 | -0.19% | -0.08% | -0.29% | -0.38% |
| Short Interest | +0.01% z+0.1 | -0.20% | +0.11% | -1.08% | -1.81% |
| Style-Flow | |||||
| Morning Activity | -0.09% z-0.7 | -0.28% | -0.45% | -1.20% | +1.25% |
| Short-Sale Activity | +0.07% z+0.7 | +0.02% | -0.19% | -0.04% | +0.91% |
| Thematic | |||||
| Oil | -0.40% z-0.8 | +0.25% | +0.20% | +0.88% | +4.56% |
| Gold | +0.20% z+0.6 | -0.58% | -0.71% | -2.17% | +3.53% |
| China | -0.11% z-0.3 | -0.11% | +0.05% | +0.18% | +1.61% |
| Semiconductors | -0.07% z-0.1 | +0.36% | +0.53% | +3.09% | -2.33% |
| Treasury (Duration) | +0.02% z+0.1 | -0.30% | -0.75% | -2.02% | -1.63% |
| Bitcoin / Crypto | -0.01% z-0.0 | +0.06% | +0.17% | -0.14% | +1.66% |
5/20/60d windows include today's session; 1d is the previous session.
Factor z-score. Today's factor return divided by its daily-return standard deviation over ~1,600 trading days.
High-beta momentum cohort. US names above $2B market cap in the top quintile of both raw beta and 12-month momentum; membership frozen at each month's first business day. “Top 50” = the 50 strongest by combined rank.
Stock-specific (idiosyncratic) return. The part of a stock's move not explained by market, style, or thematic factors in our decomposition.
Data compiled by FactorPulse AI; edited and verified by Jeff Klein. For informational purposes only. Does not constitute financial advice, an investment recommendation, or an offer to buy or sell any securities. Always consult a qualified financial professional before making investment decisions.
For more on factor construction methodology, see www.factorpulse.com/glossary.