A cooler-than-expected inflation reading pulled down short-term Treasury yields but did nothing to stop the climb in long-term rates. The Fed's preferred gauge, core PCE, rose 3% in August against the 3.3% economists expected, and traders scaled back bets on an October rate hike. Three-month bill yields slipped, yet the 30-year yield rose again to about 5.6%, pushing past Tuesday's highest level since 2002. Oil climbing to roughly $91 a barrel took some of the shine off the inflation relief. Stocks followed the long bond. The S&P 500 finished essentially flat, while the typical stock gave up an early gain to close lower, with real estate and homebuilders among the weakest groups.
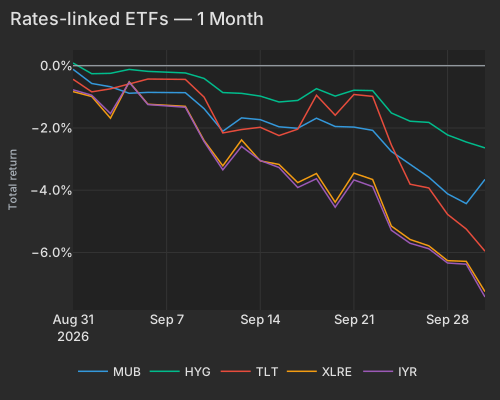
Higher long-term rates kept wearing on companies that borrow heavily, a pattern that has been building for months. Mortgage investors such as Annaly and Blackstone Mortgage Trust lost about 2% as a group. Municipal bonds bounced nearly 1% on the quarter's last day, but an exchange-traded fund of municipal bonds still ended September down about 3.5%, its worst month in a record that begins in 2018. On the jobs front, the ADP employment report showed private employers added 90,000 workers in September, more than forecast. Pay growth for people staying in their jobs was the slowest in three years.
Company news did most of the talking beneath the surface. In Delaware, Judge Richard Andrews ruled that Liquidia's Yutrepia inhaler infringes a United Therapeutics patent. Liquidia fell 57%, erasing about $3.5 billion in market value, while United Therapeutics jumped about 13%. Liquidia said it will appeal, and both sides must propose remedies by Oct. 7. After the bell, memory-chip maker Micron issued a forecast that beat estimates and said demand for its high-bandwidth memory is outrunning what it can produce. The shares barely moved in late trading. The results are now the main test of whether the AI chip trade can hold up as the 30-year yield keeps rising.
CNBC reported that the Fed's preferred inflation gauge, core PCE, rose 3.0% year on year in August, well below the 3.3% consensus bea.gov. Bloomberg reported that traders scaled back bets on an October rate hike afterwards. Only the short end responded. The 3-month yield fell 4.9 bps to 4.12% and the 2-year was flat at 4.89% CNBC. The 10-year rose 4.3 bps to 5.30%, and the 30-year added 4.8 bps to 5.64% CNBC. That is a bear steepener: the gap between 3-month and 30-year yields widened by almost 10 bps in one session. The 30-year also went past Tuesday's highest level since 2002. WTI crude rose +1.36% to $90.60 at 4:03 PM ET CNBC, which took away part of the relief on inflation expectations that the PCE print had offered.
Stocks followed the long bond rather than the bills. The S&P 500 ETF (SPY) closed -0.07%. The equal-weighted market's fade into the close shows the average stock losing ground all afternoon. The rate-sensitive funds make up most of the losers' side of the table:
| ETF | Theme | Session | 1d Ago | 5d Ago | 20d Ago | 63d Ago |
|---|---|---|---|---|---|---|
| MUB | municipal bonds | +0.80% | -0.33% | -2.40% | -4.32% | -6.06% |
| USO | oil | +1.62% | -4.44% | -0.51% | +7.22% | +34.68% |
| SPY | large cap | -0.07% | -0.18% | -1.19% | -0.12% | +2.59% |
| TLT | long-term Treasuries | -0.61% | -0.50% | -4.31% | -4.83% | -8.42% |
| KRE | regional banks | -0.57% | -1.02% | -1.91% | -4.53% | -6.17% |
| XLRE | real estate | -0.95% | -0.02% | -2.73% | -5.50% | -5.33% |
| XLF | financials | -1.01% | -0.33% | -1.44% | -6.08% | +1.10% |
| XLP | consumer staples | -1.41% | -0.52% | -1.06% | -3.05% | -0.82% |
| ITB | homebuilders | -1.49% | -0.42% | -2.91% | -5.87% | -14.69% |
Munis were the exception. MUB gained +0.80% on the quarter's last session, a large move for that fund. It is still -3.54% month to date, the worst of 93 complete months in its record, and its 20-day loss is the deepest since April 2020.
| T | Mub | Hyg | Tlt | Xlre | Iyr |
|---|---|---|---|---|---|
| 2026-08-31 | -0.11 | 0.09 | -0.43 | -0.83 | -0.77 |
| 2026-09-01 | -0.57 | -0.26 | -0.84 | -0.99 | -0.95 |
| 2026-09-02 | -0.68 | -0.24 | -0.74 | -1.69 | -1.54 |
| 2026-09-03 | -0.88 | -0.12 | -0.60 | -0.52 | -0.53 |
| 2026-09-04 | -0.86 | -0.18 | -0.43 | -1.24 | -1.25 |
| 2026-09-08 | -0.87 | -0.23 | -0.44 | -1.30 | -1.33 |
| 2026-09-09 | -1.38 | -0.41 | -1.01 | -2.41 | -2.44 |
| 2026-09-10 | -2.10 | -0.86 | -2.16 | -3.21 | -3.35 |
| 2026-09-11 | -1.68 | -0.89 | -2.05 | -2.38 | -2.59 |
| 2026-09-14 | -1.73 | -0.98 | -1.98 | -3.06 | -3.05 |
| 2026-09-15 | -1.96 | -1.16 | -2.24 | -3.17 | -3.27 |
| 2026-09-16 | -2.01 | -1.11 | -2.04 | -3.75 | -3.91 |
| 2026-09-17 | -1.69 | -0.74 | -0.95 | -3.46 | -3.63 |
| 2026-09-18 | -1.95 | -0.98 | -1.59 | -4.38 | -4.55 |
| 2026-09-21 | -1.97 | -0.79 | -0.92 | -3.45 | -3.67 |
| 2026-09-22 | -2.08 | -0.80 | -0.98 | -3.66 | -3.88 |
| 2026-09-23 | -2.75 | -1.52 | -2.55 | -5.15 | -5.29 |
| 2026-09-24 | -3.18 | -1.78 | -3.81 | -5.58 | -5.70 |
| 2026-09-25 | -3.58 | -1.82 | -3.93 | -5.79 | -5.88 |
| 2026-09-28 | -4.12 | -2.22 | -4.78 | -6.26 | -6.34 |
| 2026-09-29 | -4.43 | -2.45 | -5.25 | -6.29 | -6.38 |
| 2026-09-30 | -3.65 | -2.64 | -5.96 | -7.26 | -7.43 |
The factor model's clearest multi-week signal pointed the same way as the long end. Leverage fell -0.24% at z=-1.4: the most indebted companies lagged the least indebted. The factor has lost -3.75% over 60 sessions, with a 63-day z-score of z=-3.0, so today continues a run that started months ago. Mortgage REITs did the most damage. The REIT names at the top of the Leverage ranking, including Annaly (NLY), Blackstone Mortgage Trust (BXMT) and KKR, lost -2.21% on a weighted basis. Orchid Island Capital (ORC) fell -2.86%, almost entirely from its factor exposures.
| Factor | Return | Z-Score | 5d Z | 20d Z | 63d Z | Category | Direction |
|---|---|---|---|---|---|---|---|
| Leverage | -0.24% | -1.45 | -1.29 | -1.58 | -3.04 | Style | More levered names lagged |
| Short Interest | +0.20% | +1.20 | +0.37 | -1.35 | -0.98 | Positioning | Most-shorted names outperformed |
| Profitability | -0.22% | -1.16 | +0.33 | -0.07 | -1.02 | Style | More profitable names lagged |
| Bitcoin / Crypto | +0.33% | +1.09 | -0.74 | +0.22 | +1.00 | Thematic | Crypto-exposed names outperformed |
| Oil | +0.35% | +0.74 | +0.08 | +0.36 | +1.49 | Thematic | Oil-exposed names outperformed |
| Gold | -0.27% | -0.82 | -0.4 | -0.6 | +1.8 | Thematic | Gold-exposed names lagged |
| Treasury (Duration) | -0.12% | -0.36 | -1.1 | -1.3 | -0.7 | Thematic | Bond-sensitive names lagged |
| Hedge-Fund Ownership | +0.04% | +0.39 | +0.16 | -0.65 | +0.09 | Positioning | Flat |
Treasury (Duration) fell only -0.12% today, but it has now lost five sessions out of five and -1.94% over 20 days. It and Leverage are both in the top decile of their own past year for how much of stock returns they explain. For a book, that matters more than either day's size: exposure to rates is the risk actually driving P&L right now.
The magnitude is still small. Leverage's move today was a 1.45-sigma day, and style factors as a group explained only 6% of stock-level variance. Higher yields are wearing levered balance sheets down steadily rather than in one sharp drop.
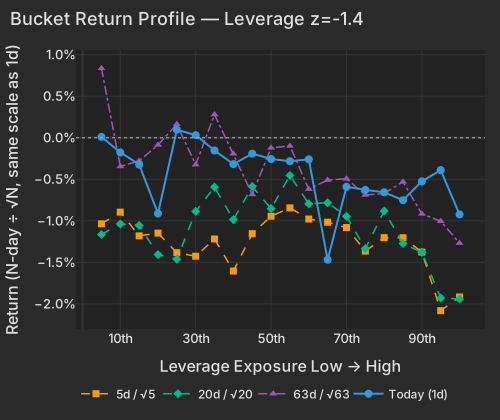
| Bucket | Ret 1D Pct | Ret 5D Norm Pct | Ret 20D Norm Pct | Ret 63D Norm Pct |
|---|---|---|---|---|
| 1 | 0.01 | -1.04 | -1.16 | 0.84 |
| 2 | -0.18 | -0.90 | -1.04 | -0.35 |
| 3 | -0.32 | -1.18 | -1.06 | -0.28 |
| 4 | -0.91 | -1.15 | -1.41 | -0.09 |
| 5 | 0.10 | -1.38 | -1.46 | 0.16 |
| 6 | 0.03 | -1.43 | -0.89 | -0.32 |
| 7 | -0.15 | -1.22 | -0.59 | 0.28 |
| 8 | -0.32 | -1.60 | -0.99 | -0.19 |
| 9 | -0.19 | -1.15 | -0.59 | -0.68 |
| 10 | -0.26 | -0.94 | -0.85 | -0.12 |
| 11 | -0.28 | -0.84 | -0.45 | -0.10 |
| 12 | -0.26 | -0.98 | -0.79 | -0.62 |
| 13 | -1.47 | -1.02 | -0.78 | -0.51 |
| 14 | -0.59 | -1.08 | -0.95 | -0.49 |
| 15 | -0.63 | -1.36 | -1.34 | -0.69 |
| 16 | -0.66 | -1.20 | -0.88 | -0.67 |
| 17 | -0.75 | -1.20 | -1.27 | -0.53 |
| 18 | -0.52 | -1.38 | -1.38 | -0.92 |
| 19 | -0.39 | -2.08 | -1.93 | -1.00 |
| 20 | -0.92 | -1.92 | -1.94 | -1.27 |
Two other factor moves stood out. Short Interest gained +0.20% at z=+1.2, meaning the most-shorted names outperformed. That usually runs the other way, and it happened even with heavily shorted Liquidia among the day's worst stocks. It recovers part of a 20-day loss of -1.01%. Profitability fell -0.22% at z=-1.2. High-margin large caps fell alongside it: Visa (V) closed -1.56%, and Walmart (WMT) closed -2.59% on a move that was mostly its own.
Stock-specific moves explained 85% of stock-level variance, against a one-year average of 66% (88th percentile of the past year). Style factors explained 6%, in the 4th percentile. The largest move was the result of a court ruling. According to Liquidia's litigation update, Judge Richard G. Andrews in Delaware found claims 1 and 14 of United Therapeutics' '327 patent valid and infringed by Yutrepia. Liquidia said it will appeal, and both sides must propose remedies by October 7. Liquidia closed -57.19%, erasing about $3.5B of market value. United Therapeutics closed +12.74%, adding $2.7B. For both names, almost all of the move was company-specific.
Mortgage insurers fell together without a reported catalyst: MGIC (MTG) -8.51%, Essent (ESNT) -8.38% and Radian (RDN) -6.49%, most of each move stock-specific. The cause has not yet shown up in any reporting. Jabil (JBL) closed -9.54% after reporting fiscal fourth-quarter results before the open. Alphabet (GOOGL) closed the session +0.95% and then added +2.62% in late trading. No reported driver for the after-hours move has appeared yet.
Micron (MU) reported after the bell, and its forecast beat estimates. The company said demand for high-bandwidth memory is exceeding its production capacity Bloomberg. The first reaction was small. MU closed +0.13% and was up another +0.29% in late trading. The Roundhill Memory ETF (DRAM) closed -1.58% and recovered +0.62% after the bell. Micron's guidance is now the main test of whether the AI chip trade can hold up while the 30-year yield keeps rising.
The ADP National Employment Report, released at 8:15 AM ET, showed private payrolls up 90,000 in September, above consensus adpemploymentreport.com. Pay growth for workers who stayed in their jobs slowed to its weakest pace in three years. The Dallas Fed Energy Survey, released at 10:30 AM ET, showed the business activity index falling to 38.8 from 46.1. Respondents expect WTI crude to average $88 at year-end.
Variance decomposition: live intraday — 20260930 session, bracketed against its trailing-year range. Factor returns are trailing through last close. Total cross-sectional dispersion: 8.0%ile of the past year.
Variance mix — % of total, today vs 1d ago vs 1-yr avg
market 51%ile style 4.4%ile thematic 75%ile idiosyncratic 88%ile
Variance explained — today vs. factor's trailing-year range
Marker = the factor's share of today's total variance, placed in its own trailing-year range (box 25–75%ile, ticks 90%ile and max). Amber marker = unusually load-bearing today (≥90%ile of its own year). Factor name green = up today / red = down.
Correlation & dispersion — realized vs implied
Pairwise realized correlation (20d): 9.68% 7.6%ile since 2020 · 87%ile 3m
Top-500 pairwise: 12.49% 15%ile since 2020 · 92.1%ile 3m · implied (Cboe COR1M): 8.98 2.7%ile of its own history (gap +3.5pp)
Realized 20d vol (ann. pts): all stocks 38 vs VIXEQ 40 · index 10 vs VIX 16 · style factors 18 60%ile
20-day window (19 completed days + today); percentiles vs model history since 2020; '3m' tokens rank vs the trailing 63 trading days; definitions in Terms below. Implied prints (Cboe) are delayed ~15 min. as of 15:58 ET
High-beta momentum cohort (eq-wt, since-2020 rank): -0.0% 46%ile · rest of market -0.4%
| Factor | Today | 1d | 5d | 20d | 60d |
|---|---|---|---|---|---|
| Style-Risk | |||||
| Residual Volatility | +0.33% z+0.7 | +0.01% | -0.57% | +0.38% | +3.30% |
| Beta | +0.18% z+0.2 | +0.68% | +0.25% | +6.31% | +1.31% |
| International | +0.04% z+0.1 | -0.05% | -0.12% | -0.03% | +1.25% |
| Style | |||||
| Leverage | -0.24% z-1.4 | +0.07% | -0.48% | -1.19% | -3.75% |
| Profitability | -0.22% z-1.2 | +0.12% | +0.14% | -0.06% | -0.64% |
| Dividend Yield | -0.10% z-0.6 | +0.06% | -0.21% | -0.17% | +0.48% |
| Size | +0.14% z+0.4 | +0.10% | +0.75% | +2.58% | +2.74% |
| Value | +0.05% z+0.2 | +0.06% | -0.18% | -0.07% | +0.84% |
| Liquidity | -0.04% z-0.2 | -0.02% | -0.12% | +0.53% | +3.09% |
| Growth | +0.02% z+0.1 | -0.03% | +0.26% | +0.03% | +0.95% |
| Style-Momentum | |||||
| Medium-Term Momentum | -0.18% z-0.6 | +0.00% | -0.61% | -0.96% | -0.84% |
| Short-Term Momentum | -0.15% z-0.5 | -0.05% | +0.01% | -0.90% | -8.56% |
| One-Day Momentum | -0.11% z-0.4 | -0.04% | -0.46% | -2.10% | -3.11% |
| Long-Term Momentum | +0.04% z+0.1 | +0.19% | +1.02% | +3.43% | -0.19% |
| Style-Positioning | |||||
| Short Interest | +0.20% z+1.2 | -0.05% | +0.14% | -1.01% | -1.88% |
| Hedge-Fund Ownership | +0.04% z+0.4 | +0.00% | +0.04% | -0.32% | -0.16% |
| Style-Flow | |||||
| Morning Activity | +0.10% z+0.8 | -0.09% | -0.15% | -0.65% | +1.52% |
| Short-Sale Activity | -0.03% z-0.3 | -0.09% | -0.43% | +0.35% | +0.60% |
| Thematic | |||||
| Bitcoin / Crypto | +0.33% z+1.1 | -0.03% | -0.50% | +0.30% | +1.75% |
| Gold | -0.27% z-0.8 | -0.07% | -0.29% | -0.92% | +3.36% |
| Oil | +0.35% z+0.7 | -0.13% | +0.08% | +0.76% | +5.80% |
| China | +0.24% z+0.6 | -0.08% | +0.41% | +0.05% | +2.07% |
| Semiconductors | -0.27% z-0.5 | +0.14% | +0.24% | +1.88% | -1.08% |
| Treasury (Duration) | -0.12% z-0.4 | -0.07% | -0.77% | -1.94% | -1.79% |
5/20/60d windows include today's session; 1d is the previous session.
Factor z-score. Today's factor return divided by its daily-return standard deviation over ~1,600 trading days.
Stock-specific (idiosyncratic) return. The part of a stock's move not explained by market, style, or thematic factors in our decomposition.
Data compiled by FactorPulse AI; edited and verified by Jeff Klein. For informational purposes only. Does not constitute financial advice, an investment recommendation, or an offer to buy or sell any securities. Always consult a qualified financial professional before making investment decisions.
For more on factor construction methodology, see www.factorpulse.com/glossary.