Consulting giant Accenture jumped about 23% in early trading Thursday, adding roughly $26 billion in market value, after forecasting 3% to 6% revenue growth for its 2027 fiscal year. Analysts had expected about 4%. The outlook eased fears that artificial intelligence is eating into demand for IT consulting, and rivals rallied with it: Cognizant gained about 12%, while Indian outsourcer Infosys and Canadian firm CGI each rose about 8%. Investors who had bet against the group were caught off guard. Software stocks rose about 1.5% even as Alphabet rolled out its latest Gemini AI model. Not every strong report was rewarded, though. Memory-chip maker Micron slipped about 1% despite a record quarter and a forecast that the chip shortage will last through 2028, pulled down along with other recent high-flyers.
In the bond market, the 10-year Treasury yield touched about 5.34%, its highest since April 2002, before easing slightly. Traders pointed to an upward revision to second-quarter economic growth, a strong ADP private-payrolls report and Brent crude above $100 a barrel. The 30-year yield rose to about 5.67%, and long-term U.K. yields hit 6% for the first time since 1998. Weekly jobless claims fell to 197,000, the lowest since mid-July, and yields stayed near their highs. Richmond Fed President Tom Barkin said inflation risks still outweigh risks to employment. A closely watched manufacturing report was due at 10 a.m.
The broad stock market barely moved, but rising rates hit the most rate-sensitive corners. A fund tracking junk bonds fell about 0.8%, more than three times its typical daily move. Homebuilder stocks fell nearly 2%, while real estate and regional banks each fell about 1%. Heavily indebted companies lagged, led lower by Blackstone Mortgage Trust, mortgage investor Annaly, private-equity firm KKR and consumer lender OneMain. Municipal bonds have had one of their worst monthly stretches in years. Nike edged up about 1% ahead of its earnings report after the close.
Accenture (ACN) is up +22.55% after fiscal fourth-quarter EPS of $3.29 beat the $3.18 estimate. WSJ The outlook did more of the work. Guidance for 3–6% revenue growth in fiscal 2027 beat the 3.9% consensus, and 141 client contracts were each worth more than $100M. WSJ The guidance points to steady consulting demand despite concerns that AI is eroding the business, and peers traded it as news for the whole industry.
The peer gains are company-specific, not factor-driven. About 10.9 points of Cognizant's (CTSH) +12.27% gain is the stock's own move. Infosys (INFY) at +8.18% and CGI (GIB) at +8.00% show the same split. Infosys and Wipro ADRs rose 5–8% on the read-through from Accenture's results. Bloomberg
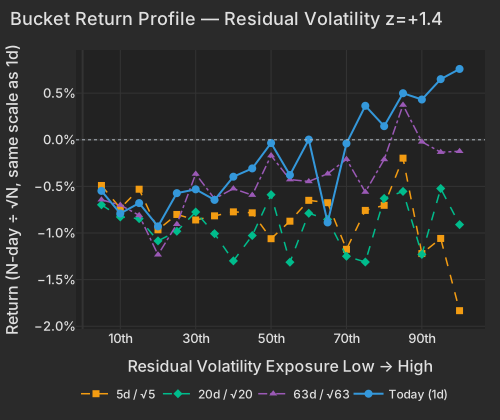
The little factor movement there is runs through the same stocks. Residual Volatility is up +0.69% at z=+1.4, meaning the most volatile stocks are beating the calmest. ACN and CTSH both score high on that exposure. Short Interest is +0.21% at z=+1.2: the most heavily shorted names are beating those with little short interest, against the factor's usual drag. CTSH is one of the more heavily shorted IT-services names, so this looks like short sellers in the group getting caught by the Accenture print. Over the past 20 sessions the factor is still down -0.88%. Biotech supplied the rest of the most-volatile group: Capricor (CAPR) rose 10.5% on Duchenne muscular dystrophy data. Nasdaq
| Bucket | Ret 1D Pct | Ret 5D Norm Pct | Ret 20D Norm Pct | Ret 63D Norm Pct |
|---|---|---|---|---|
| 1 | -0.55 | -0.49 | -0.70 | -0.64 |
| 2 | -0.79 | -0.73 | -0.83 | -0.70 |
| 3 | -0.68 | -0.53 | -0.85 | -0.81 |
| 4 | -0.93 | -0.97 | -1.08 | -1.23 |
| 5 | -0.57 | -0.80 | -0.98 | -0.91 |
| 6 | -0.53 | -0.86 | -0.77 | -0.37 |
| 7 | -0.64 | -0.82 | -1.01 | -0.63 |
| 8 | -0.40 | -0.77 | -1.30 | -0.52 |
| 9 | -0.31 | -0.78 | -1.03 | -0.59 |
| 10 | -0.03 | -1.06 | -0.59 | -0.17 |
| 11 | -0.38 | -0.87 | -1.31 | -0.43 |
| 12 | 0.00 | -0.65 | -0.79 | -0.45 |
| 13 | -0.89 | -0.67 | -0.85 | -0.36 |
| 14 | -0.04 | -1.17 | -1.25 | -0.21 |
| 15 | 0.36 | -0.76 | -1.31 | -0.56 |
| 16 | 0.15 | -0.70 | -0.63 | -0.21 |
| 17 | 0.50 | -0.20 | -0.55 | 0.37 |
| 18 | 0.43 | -1.22 | -1.23 | -0.02 |
| 19 | 0.65 | -1.06 | -0.52 | -0.13 |
| 20 | 0.76 | -1.83 | -0.91 | -0.12 |
Stock-specific moves are explaining 94% of the variance across individual stocks, the highest share of the past year. Style factors are at 6% against a 22% average, and the broad market is explaining 0.2%. Options prices point the same way. Implied single-stock volatility (Cboe VIXEQ) is 39.83, the top of its 20-session range, while implied index volatility (Cboe VIX) is 16.52.
| Factor | Return | Z-Score | 5d Z | 20d Z | 63d Z | Category | Direction |
|---|---|---|---|---|---|---|---|
| Residual Volatility | +0.69% | +1.39 | +0.09 | +0.63 | +0.99 | Style-Risk | Most volatile stocks led |
| Leverage | -0.21% | -1.27 | -1.52 | -1.92 | -3.15 | Style | Most indebted stocks lagged |
| Short Interest | +0.21% | +1.25 | +1.06 | -1.19 | -0.95 | Style-Positioning | Most-shorted stocks outperformed |
| Profitability | +0.16% | +0.83 | +1.57 | +0.45 | -0.65 | Style | More profitable stocks led |
| Short-Term Momentum | +0.14% | +0.45 | -0.03 | -0.20 | -3.49 | Style-Momentum | Last week's movers roughly flat |
| Treasury (Duration) | -0.04% | -0.12 | -1.0 | -1.6 | -0.8 | Thematic | Flat |
Not every strong report is being rewarded. Micron (MU) is down -1.33%, erasing $16.0B of market value, after a record quarter and a forecast that the memory-chip shortage will last through 2028. WSJ Only -0.71% of that drop is stock-specific. Most of the rest comes from MU's heavy exposure to 12-month momentum, which is down -0.16%.
Corteva's (CTVA) -83.13% is a mechanical price adjustment for spinning off its seed business as Vylor (VYLR), not a real loss for shareholders. SEC That adjustment distorts the Materials sector's -1.47% reading. Drug distributors McKesson (MCK, +7.46%) and Cardinal Health (CAH, +5.96%) are moving almost entirely on their own, and no news explaining it has surfaced yet. Alphabet launched Gemini 4 Argon at $2 per million input tokens Bloomberg, and software stocks show no sign of pricing pressure: IGV is up +1.51%. Nike (NKE) is up +1.07% ahead of its report after the close.
The 10-year Treasury yield touched 5.342% early Thursday, its highest since April 2002. Reasons cited include an upward revision to second-quarter GDP, a strong ADP jobs report and Brent crude above $100 bea.gov adpemploymentreport.com. WSJ At 9:47 ET the 10-year was at 5.319%, up 2.6 bps, while the 2-year was down 2.5 bps. CNBC Long-dated bonds are still leading the selloff, with the 30-year up 3.4 bps at 5.673%. CNBC UK long-term yields reached 6% for the first time since 1998. Bloomberg
The Treasury (Duration) factor is flat at -0.04%, so stocks are not sorting on interest-rate sensitivity. The losses are showing up in specific funds instead:
| ETF | Theme | Today | 1d Ago | 5d Ago | 20d Ago | 63d Ago |
|---|---|---|---|---|---|---|
| IGV | software | +1.51% | +1.20% | -1.50% | +0.28% | +14.08% |
| XLK | technology | +0.73% | +0.64% | +0.21% | +6.72% | +5.58% |
| SPY | large cap | +0.15% | -0.21% | -0.67% | +0.36% | +2.52% |
| TLT | long-term Treasuries | -0.57% | -0.58% | -3.33% | -5.00% | -8.33% |
| LQD | investment-grade credit | -0.76% | -0.22% | -1.65% | -2.89% | -4.98% |
| HYG | high-yield credit | -0.76% | -0.19% | -1.14% | -2.39% | -1.98% |
| XLU | utilities | -0.77% | -0.68% | -0.78% | -6.65% | -11.25% |
| XLRE | real estate | -1.06% | -1.04% | -2.22% | -6.33% | -6.63% |
| KRE | regional banks | -1.13% | -0.56% | -1.34% | -3.83% | -8.33% |
| ITB | homebuilders | -1.76% | -1.54% | -1.99% | -4.98% | -14.08% |
HYG's drop is more than three times its typical daily move, and XLRE is trading at 2.2× its usual volume pace. Interest-rate stress is reaching high-yield credit while stock factors barely react, which is the main caveat to reading today as a company-news day. Municipal bonds show how long this has been building. MUB's -3.10% over 20 sessions ranks in the worst 1.2% of 20-day stretches since its data begin in 2018.
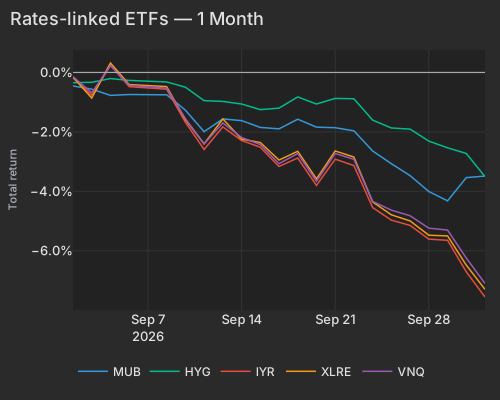
| T | Mub | Hyg | Iyr | Xlre | Vnq |
|---|---|---|---|---|---|
| 2026-09-01 | -0.46 | -0.34 | -0.18 | -0.16 | -0.15 |
| 2026-09-02 | -0.56 | -0.33 | -0.77 | -0.86 | -0.68 |
| 2026-09-03 | -0.77 | -0.21 | 0.24 | 0.32 | 0.23 |
| 2026-09-04 | -0.74 | -0.27 | -0.48 | -0.41 | -0.44 |
| 2026-09-08 | -0.75 | -0.32 | -0.57 | -0.48 | -0.53 |
| 2026-09-09 | -1.27 | -0.50 | -1.68 | -1.59 | -1.56 |
| 2026-09-10 | -1.99 | -0.95 | -2.59 | -2.40 | -2.41 |
| 2026-09-11 | -1.56 | -0.97 | -1.83 | -1.56 | -1.70 |
| 2026-09-14 | -1.62 | -1.06 | -2.29 | -2.24 | -2.19 |
| 2026-09-15 | -1.85 | -1.25 | -2.52 | -2.36 | -2.43 |
| 2026-09-16 | -1.90 | -1.20 | -3.16 | -2.95 | -3.07 |
| 2026-09-17 | -1.57 | -0.82 | -2.88 | -2.65 | -2.73 |
| 2026-09-18 | -1.84 | -1.06 | -3.80 | -3.58 | -3.66 |
| 2026-09-21 | -1.86 | -0.87 | -2.92 | -2.64 | -2.73 |
| 2026-09-22 | -1.96 | -0.89 | -3.13 | -2.85 | -2.92 |
| 2026-09-23 | -2.64 | -1.60 | -4.55 | -4.36 | -4.34 |
| 2026-09-24 | -3.07 | -1.87 | -4.97 | -4.79 | -4.63 |
| 2026-09-25 | -3.47 | -1.91 | -5.15 | -5.00 | -4.82 |
| 2026-09-28 | -4.01 | -2.31 | -5.61 | -5.48 | -5.24 |
| 2026-09-29 | -4.32 | -2.54 | -5.65 | -5.50 | -5.30 |
| 2026-09-30 | -3.54 | -2.73 | -6.71 | -6.48 | -6.24 |
| 2026-10-01 | -3.49 | -3.50 | -7.55 | -7.30 | -7.10 |
Leverage is the only style factor tracking the bond market. It is down -0.21% at z=-1.3 as the most indebted companies lag. That extends a slide that now totals -4.06% over 60 sessions, with a 63-day z of -3.15. Blackstone Mortgage Trust (BXMT), Annaly (NLY), KKR and OneMain (OMF) lead the most-levered group lower, and the REITs in that group are averaging -1.95%.
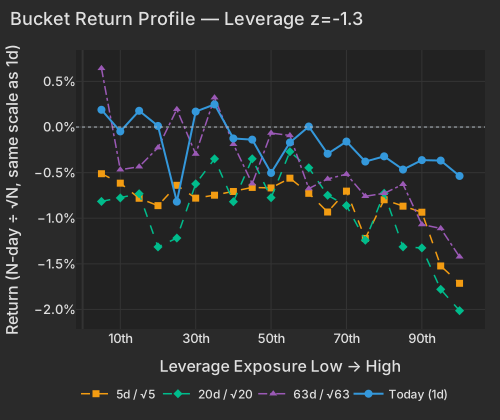
| Bucket | Ret 1D Pct | Ret 5D Norm Pct | Ret 20D Norm Pct | Ret 63D Norm Pct |
|---|---|---|---|---|
| 1 | 0.19 | -0.51 | -0.82 | 0.64 |
| 2 | -0.05 | -0.62 | -0.78 | -0.47 |
| 3 | 0.18 | -0.78 | -0.73 | -0.43 |
| 4 | 0.01 | -0.86 | -1.31 | -0.23 |
| 5 | -0.82 | -0.64 | -1.22 | 0.19 |
| 6 | 0.17 | -0.78 | -0.62 | -0.30 |
| 7 | 0.25 | -0.75 | -0.35 | 0.32 |
| 8 | -0.13 | -0.71 | -0.82 | -0.19 |
| 9 | -0.14 | -0.66 | -0.35 | -0.62 |
| 10 | -0.50 | -0.67 | -0.77 | -0.07 |
| 11 | -0.17 | -0.56 | -0.27 | -0.09 |
| 12 | 0.01 | -0.73 | -0.45 | -0.67 |
| 13 | -0.29 | -0.93 | -0.75 | -0.57 |
| 14 | -0.16 | -0.70 | -0.86 | -0.52 |
| 15 | -0.38 | -1.22 | -1.24 | -0.76 |
| 16 | -0.32 | -0.80 | -0.73 | -0.73 |
| 17 | -0.47 | -0.87 | -1.31 | -0.63 |
| 18 | -0.36 | -0.93 | -1.33 | -1.07 |
| 19 | -0.37 | -1.52 | -1.78 | -1.11 |
| 20 | -0.54 | -1.71 | -2.01 | -1.42 |
One summer pattern has stopped adding. Short-Term Momentum, which measures 5-day trend or reversion, still has a 63-day z of -3.49 and a -7.55% loss over 60 sessions. Its 5- and 20-day z-scores are now close to zero, so last week's winners and losers are no longer reliably reversing. With that pattern quiet and style factors at about a quarter of their normal share, the 10-year yield's climb is hitting specific balance sheets: indebted companies and high-yield bonds, not rate-sensitive stocks across the board.
Initial jobless claims, released at 8:30 AM ET, fell to 197,000 against a 200,000 consensus, the lowest since mid-July, and Treasury yields stayed near their highs dol.gov. Fed Presidents Barkin, Collins and Schmid spoke on a 9:05 AM ET panel. Barkin said inflation risks still outweigh risks to employment.
The ISM Manufacturing index is due at 10:00 AM ET, with consensus at 54.8 against August's 54.6. With the prices sub-index last at 71.1, a hot reading would add to the pressure on the long end of the Treasury curve.
Variance decomposition: live intraday — 20261001 session, bracketed against its trailing-year range. Factor returns are trailing through last close. Total cross-sectional dispersion: 67%ile of the past year.
Variance mix — % of total, today vs 1d ago vs 1-yr avg
market 12%ile style 3.6%ile thematic 2.0%ile idiosyncratic 100.0%ile
Variance explained — today vs. factor's trailing-year range
Marker = the factor's share of today's total variance, placed in its own trailing-year range (box 25–75%ile, ticks 90%ile and max). Amber marker = unusually load-bearing today (≥90%ile of its own year). Factor name green = up today / red = down.
Correlation & dispersion — realized vs implied
Pairwise realized correlation (20d): 9.52% 7.3%ile since 2020 · 87%ile 3m
Top-500 pairwise: 12.79% 16%ile since 2020 · 93.7%ile 3m · implied (Cboe COR1M): 9.09 2.8%ile of its own history (gap +3.7pp)
Realized 20d vol (ann. pts): all stocks 38 vs VIXEQ 40 · index 10 vs VIX 17 · style factors 18 60%ile
20-day window (19 completed days + today); percentiles vs model history since 2020; '3m' tokens rank vs the trailing 63 trading days; definitions in Terms below. Implied prints (Cboe) are delayed ~15 min. as of 09:41 ET
Top 50 high-beta momentum names (eq-wt, since-2020 rank): +0.6% 55%ile · rest of market +0.2%
| Factor | Today | 1d | 5d | 20d | 60d |
|---|---|---|---|---|---|
| Style-Risk | |||||
| Residual Volatility | +0.69% z+1.4 | +0.41% | +0.10% | +1.40% | +3.53% |
| International | -0.13% z-0.4 | +0.01% | -0.11% | -0.39% | +0.80% |
| Beta | -0.02% z-0.0 | +0.18% | +0.25% | +5.97% | +0.94% |
| Style | |||||
| Leverage | -0.21% z-1.3 | -0.29% | -0.57% | -1.44% | -4.06% |
| Profitability | +0.16% z+0.8 | -0.12% | +0.66% | +0.38% | -0.56% |
| Growth | +0.17% z+0.7 | +0.07% | +0.25% | +0.24% | +1.05% |
| Value | +0.09% z+0.4 | +0.01% | +0.16% | -0.34% | +0.86% |
| Liquidity | -0.09% z-0.3 | -0.03% | -0.30% | +0.27% | +2.47% |
| Size | +0.12% z+0.3 | +0.05% | +0.51% | +2.85% | +2.45% |
| Dividend Yield | -0.04% z-0.2 | -0.16% | -0.21% | -0.19% | +0.22% |
| Style-Momentum | |||||
| One-Day Momentum | +0.25% z+0.9 | -0.10% | -0.18% | -2.04% | -2.76% |
| Short-Term Momentum | +0.14% z+0.5 | -0.06% | -0.02% | -0.28% | -7.55% |
| Medium-Term Momentum | +0.10% z+0.4 | -0.23% | -0.64% | -1.27% | -0.02% |
| Long-Term Momentum | -0.16% z-0.2 | +0.14% | +0.58% | +3.38% | -1.28% |
| Style-Positioning | |||||
| Short Interest | +0.21% z+1.2 | +0.26% | +0.40% | -0.88% | -1.49% |
| Hedge-Fund Ownership | +0.03% z+0.2 | +0.03% | +0.03% | -0.24% | -0.20% |
| Style-Flow | |||||
| Morning Activity | -0.06% z-0.5 | +0.07% | -0.34% | -0.88% | +1.50% |
| Short-Sale Activity | -0.04% z-0.3 | -0.08% | -0.27% | +0.07% | +0.60% |
| Thematic | |||||
| Bitcoin / Crypto | +0.28% z+0.9 | +0.29% | -0.30% | +0.57% | +1.80% |
| Gold | -0.30% z-0.9 | -0.21% | -0.61% | -1.46% | +3.47% |
| China | +0.31% z+0.8 | +0.20% | +0.61% | +0.60% | +2.04% |
| Semiconductors | -0.30% z-0.5 | -0.19% | +0.04% | +1.86% | -2.64% |
| Oil | -0.08% z-0.2 | +0.36% | -0.24% | +0.67% | +4.39% |
| Treasury (Duration) | -0.04% z-0.1 | -0.08% | -0.73% | -2.29% | -1.53% |
5/20/60d windows include today's session; 1d is the previous session.
Factor z-score. Today's factor return divided by its daily-return standard deviation over ~1,600 trading days.
Stock-specific (idiosyncratic) return. The part of a stock's move not explained by market, style, or thematic factors in our decomposition.
VIXEQ / DSPX / COR1M. Cboe implied indices: single-stock volatility, dispersion, and 1-month implied correlation (top-50 S&P names). Quotes delayed ~15 minutes.
Data compiled by FactorPulse AI; edited and verified by Jeff Klein. For informational purposes only. Does not constitute financial advice, an investment recommendation, or an offer to buy or sell any securities. Always consult a qualified financial professional before making investment decisions.
For more on factor construction methodology, see www.factorpulse.com/glossary.