Record bookings at consulting giant Accenture sent its shares up about 15% Thursday, adding roughly $18 billion in market value and pulling its rivals along. The company signed a record $22 billion in new business, beat revenue and profit estimates, and forecast 3% to 6% sales growth for next fiscal year, ahead of the roughly 4% Wall Street expected. That is a sign that demand for consultants is holding up despite fears that artificial intelligence will shrink it. Outsourcing peers Infosys, Cognizant and Globant rose between 7% and 10%. Elsewhere, toymaker Mattel jumped 19% after The Wall Street Journal reported that a suitor is weighing a roughly $6 billion takeover bid. Google parent Alphabet slipped about 2% on a Bloomberg report that its own staff doubt how well its Gemini 4 Argon AI handles real-world coding. For all that, the S&P 500 finished barely higher, up about 0.1%.
The bond market delivered the day's whiplash. The 10-year Treasury yield touched 5.34% early on, its highest since April 2002, then fell back to about 5.23% by late afternoon. The 30-year yield eased too, ending four days of selling in long-term bonds, and the 2-year led the rally with a drop of about a tenth of a percentage point. The economic news gave little reason for relief: jobless claims fell to 197,000, the lowest since mid-July, a gauge of prices paid by factories jumped to nearly 78, and the Fed's Barkin said inflation risks still outweigh risks to jobs. Rate-sensitive investments didn't join the bounce. Real-estate stocks and mortgage lenders such as Annaly fell about 2%, and junk bonds slid on heavy trading. Real estate has now lost about 7% over the past month.
The bond pressure hit Europe harder. The STOXX 600 fell 1%, and long-term British government bond yields reached 6% for the first time since 1998. The dollar rose about 0.6%, just shy of the one-year high it set earlier in the day, and U.S. crude climbed about 3% to $93 a barrel. Gold gained about 0.5% to roughly $4,180 an ounce, yet gold-mining stocks fell, a sign investors were dumping the shares rather than betting against the metal. Memory-chip maker Micron rose about 3% after a record quarter and a forecast that the chip shortage will last through 2028. Even so, nearly all of its gain reflected investors' appetite for hot, volatile stocks rather than the results themselves. Across the market, cheap and profitable companies beat pricey and money-losing ones, and biotech stocks fell about 2%.
Accenture closed +15.46%, adding roughly $18B of market value. Fourth-quarter revenue of $18.7B and EPS of $3.29 both beat estimates WSJ. Its 3–6% revenue growth forecast for fiscal 2027 beat the 3.9% consensus, a sign that consulting demand is holding up despite fears that AI will shrink it WSJ.
Peers followed. On the day's marks, which include late trading, Infosys ADRs (INFY) were up +6.84% and Kyndryl (KD) +9.32%. The Journal reported Globant up 10% and Cognizant up 8% WSJ. Infosys's stock-specific gain was +7.74%, more than its whole move, because its international exposure pulled the other way. The model has no IT-services factor. So the market's reassessment of AI risk to the whole industry shows up as a string of separate stock-specific moves, and part of today's 91% is really one trade.
| Stock | Session | Driver |
|---|---|---|
| Mattel (MAT) | +19.20% | The Wall Street Journal reported Authentic Brands Group is weighing a roughly $6B takeover bid |
| Synopsys (SNPS) | +12.99% | No catalyst in cited sources |
| Nektar (NKTR) | -22.43% | No catalyst in cited sources |
| Johnson & Johnson (JNJ) | -2.02% | No catalyst in cited sources |
| Alphabet (GOOG) | -1.72% | Bloomberg reported staff doubts about Gemini 4 Argon on real-world coding Bloomberg |
| Corteva (CTVA) | -84.04% | Price reset after separating its seed business SEC |
Corteva's drop is an accounting effect of the spin-off, not lost value, and all of it counts as stock-specific. That makes the 91% somewhat higher than the real amount of company news. The options market points the same way. Implied single-stock volatility (Cboe VIXEQ) is at 39.2, the top of its 20-session range, while implied index volatility (Cboe VIX) is at 16.35.
Micron is the exception. Revenue was a record, and management expects the memory-chip shortage to last through 2028 WSJ. Even so, style exposures explain +2.15% of the stock's move, and the stock-specific part was only +0.06%. Investors paid for Micron's high beta and 12-month momentum, not for the quarter itself.
| Factor | Return | Z-Score | 5d Z | 20d Z | 63d Z | Category | Direction |
|---|---|---|---|---|---|---|---|
| Value | +0.47% | z=+2.0 | 1.03 | 0.04 | 0.51 | Style | Cheapest beat most expensive |
| Profitability | +0.38% | z=+2.0 | 2.10 | 0.72 | -0.50 | Style | Profitable beat unprofitable |
| Gold | -0.61% | z=-1.9 | -1.27 | -1.22 | 1.11 | Thematic | Miners lagged |
| Hedge-Fund Ownership | -0.17% | z=-1.5 | -0.66 | -0.88 | -0.17 | Positioning | Fund-held names lagged |
| Morning Activity | -0.18% | z=-1.4 | -1.65 | -1.80 | 1.32 | Flow | Morning-heavy names lagged |
| International | -0.42% | z=-1.4 | -0.6 | -0.5 | +0.5 | Risk | Foreign exposure lagged |
| Short Interest | -0.18% | z=-1.1 | 0.02 | -1.71 | -1.24 | Positioning | Most-shorted lagged |
| Treasury (Duration) | -0.31% | z=-1.0 | -1.4 | -1.8 | -0.9 | Thematic | Bond-sensitive stocks lagged |
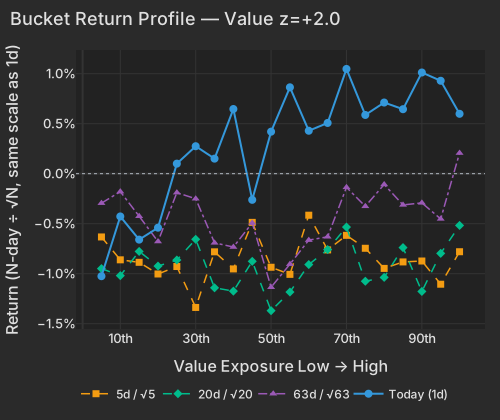
Value returned +0.47% at z=+2.0, with the cheapest names beating the most expensive. That return ranks in the 97.7th percentile since 2020. Winners included cheap cyclicals such as STMicro (STM), Stellantis (STLA), Magna (MGA) and ZIM. The most expensive names fell -1.02% as a group. The 20-day and 63-day z-scores are near zero, so this is a one-day bounce against a multi-year stretch in which cheap stocks have lagged.
| Bucket | Ret 1D Pct | Ret 5D Norm Pct | Ret 20D Norm Pct | Ret 63D Norm Pct |
|---|---|---|---|---|
| 1 | -1.03 | -0.63 | -0.95 | -0.29 |
| 2 | -0.43 | -0.86 | -1.02 | -0.18 |
| 3 | -0.66 | -0.89 | -0.78 | -0.43 |
| 4 | -0.54 | -1.00 | -0.92 | -0.68 |
| 5 | 0.10 | -0.93 | -0.86 | -0.19 |
| 6 | 0.27 | -1.34 | -0.66 | -0.25 |
| 7 | 0.15 | -0.78 | -1.14 | -0.69 |
| 8 | 0.65 | -0.95 | -1.17 | -0.73 |
| 9 | -0.26 | -0.49 | -0.88 | -0.49 |
| 10 | 0.42 | -0.94 | -1.37 | -1.14 |
| 11 | 0.86 | -1.01 | -1.18 | -0.90 |
| 12 | 0.43 | -0.42 | -0.91 | -0.66 |
| 13 | 0.51 | -0.76 | -0.76 | -0.63 |
| 14 | 1.05 | -0.62 | -0.53 | -0.14 |
| 15 | 0.59 | -0.75 | -1.08 | -0.33 |
| 16 | 0.71 | -0.95 | -1.04 | -0.11 |
| 17 | 0.64 | -0.88 | -0.74 | -0.31 |
| 18 | 1.01 | -0.87 | -1.18 | -0.29 |
| 19 | 0.93 | -1.11 | -0.80 | -0.45 |
| 20 | 0.60 | -0.78 | -0.52 | 0.21 |
Profitability has more of a trend behind it. Today's +0.38% ranks in the 98.0th percentile since 2020, and its five-day z of 2.1 comes from a +0.89% week. Unprofitable biotech was on the losing side: Insmed (INSM), Madrigal (MDGL) and Rhythm (RYTM) fell -2.01% as a group, and XBI closed -1.96%. Rhythm's factor exposures took off -3.44%, so nearly all of its loss came from its tilts rather than its own news.
The 10-year yield peaked at 5.342% early in the day, and the 30-year at 5.683% WSJ. By 4:14 PM the 2-year was at 4.781%, down 10.6 bps, the largest fall on the curve CNBC. The 30-year eased 3.3 bps to 5.606%, ending its streak of daily rises CNBC. So day four of the long-bond selloff ended with yields lower and the curve steeper.
Stocks that trade like bonds did not join the rally. The Treasury (Duration) factor fell -0.31%, its fifth straight decline, bringing its 20-session loss to -2.57%. In the highest-leverage group, REITs such as Annaly (NLY) and Blackstone Mortgage Trust (BXMT) fell -1.95%. High-yield credit (HYG) traded at 1.9× its typical session pace while falling. Bond-sensitive stocks and credit are still pricing the weeks of rising yields, not today's bounce.
| ETF | Theme | Today | 1d Ago | 5d Ago | 20d Ago | 63d Ago |
|---|---|---|---|---|---|---|
| DRAM | memory chips | +2.85% | -1.52% | -2.49% | +9.63% | -8.35% |
| XOP | oil producers | +2.78% | +0.39% | -1.82% | -6.57% | +17.12% |
| IGV | software | +1.61% | +1.20% | -1.50% | +0.28% | +14.08% |
| SMH | semiconductors | +1.56% | +0.35% | +1.26% | +11.70% | -1.85% |
| TLT | long-term Treasuries | +0.22% | -0.58% | -3.33% | -5.00% | -8.33% |
| HYG | high-yield credit | -0.38% | -0.19% | -1.14% | -2.39% | -1.98% |
| IYR | real estate | -0.60% | -1.12% | -2.26% | -6.54% | -6.78% |
| GDX | gold miners | -1.18% | -1.43% | -6.16% | -7.26% | +16.96% |
| FEZ | euro-area stocks | -1.85% | -1.31% | -0.96% | -3.67% | -0.71% |
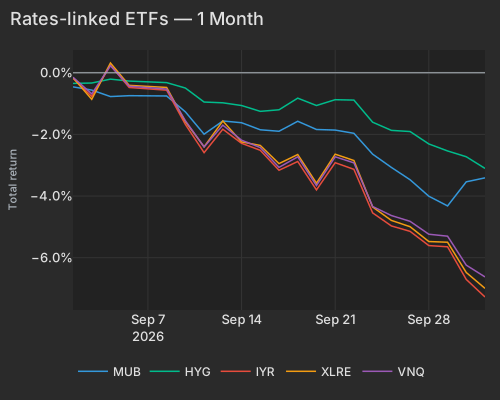
| T | Mub | Hyg | Iyr | Xlre | Vnq |
|---|---|---|---|---|---|
| 2026-09-01 | -0.46 | -0.34 | -0.18 | -0.16 | -0.15 |
| 2026-09-02 | -0.56 | -0.33 | -0.77 | -0.86 | -0.68 |
| 2026-09-03 | -0.77 | -0.21 | 0.24 | 0.32 | 0.23 |
| 2026-09-04 | -0.74 | -0.27 | -0.48 | -0.41 | -0.44 |
| 2026-09-08 | -0.75 | -0.32 | -0.57 | -0.48 | -0.53 |
| 2026-09-09 | -1.27 | -0.50 | -1.68 | -1.59 | -1.56 |
| 2026-09-10 | -1.99 | -0.95 | -2.59 | -2.40 | -2.41 |
| 2026-09-11 | -1.56 | -0.97 | -1.83 | -1.56 | -1.70 |
| 2026-09-14 | -1.62 | -1.06 | -2.29 | -2.24 | -2.19 |
| 2026-09-15 | -1.85 | -1.25 | -2.52 | -2.36 | -2.43 |
| 2026-09-16 | -1.90 | -1.20 | -3.16 | -2.95 | -3.07 |
| 2026-09-17 | -1.57 | -0.82 | -2.88 | -2.65 | -2.73 |
| 2026-09-18 | -1.84 | -1.06 | -3.80 | -3.58 | -3.66 |
| 2026-09-21 | -1.86 | -0.87 | -2.92 | -2.64 | -2.73 |
| 2026-09-22 | -1.96 | -0.89 | -3.13 | -2.85 | -2.92 |
| 2026-09-23 | -2.64 | -1.60 | -4.55 | -4.36 | -4.34 |
| 2026-09-24 | -3.07 | -1.87 | -4.97 | -4.79 | -4.63 |
| 2026-09-25 | -3.47 | -1.91 | -5.15 | -5.00 | -4.82 |
| 2026-09-28 | -4.01 | -2.31 | -5.61 | -5.48 | -5.24 |
| 2026-09-29 | -4.32 | -2.54 | -5.65 | -5.50 | -5.30 |
| 2026-09-30 | -3.54 | -2.73 | -6.71 | -6.48 | -6.24 |
| 2026-10-01 | -3.41 | -3.10 | -7.28 | -7.00 | -6.63 |
The pressure from bond yields was strongest in Europe. The STOXX 600 fell 1% as rising yields hurt appetite for risk Economic Times. FEZ traded at 2.6× its typical session pace. UK long-term gilt yields reached 6% for the first time since 1998 Bloomberg. The dollar index was at 102.03 at 4:14 PM, up +0.57% and just under the one-year high it set today CNBC. The International factor fell in step, at z=-1.4.
In commodities, WTI crude was at $93.10 at 4:04 PM ET, up +2.96% CNBC. Spot gold was at $4,177.29 at 4:14 PM, up +0.51% CNBC. Gold miners still fell: Harmony (HMY), Iamgold (IAG) and Eldorado (EGO) led the Gold factor to -0.61%. Miners falling while bullion rose is a sell-the-stocks move, not a bet against gold. Nike (NKE) closed -0.90% before its report and was up +0.49% in late trading.
Initial jobless claims, released at 8:30 AM ET, fell to 197,000 against a 200,000 consensus, the lowest since mid-July dol.gov. At the Fed panel at 9:05 AM ET with Presidents Barkin, Collins and Schmid, Barkin said inflation risks still outweigh employment risks.
The ISM Manufacturing index, released at 10:00 AM ET, came in at 54.5, just below the 55.0 consensus. Its prices-paid index jumped 6.8 points to 77.9 Economic Times. Short-dated Treasuries ended the day rallying anyway.
Variance decomposition: live intraday — 20261001 session, bracketed against its trailing-year range. Factor returns are trailing through last close. Total cross-sectional dispersion: 81%ile of the past year.
Variance mix — % of total, today vs 1d ago vs 1-yr avg
market 17%ile style 5.2%ile thematic 40%ile idiosyncratic 98.8%ile
Variance explained — today vs. factor's trailing-year range
Marker = the factor's share of today's total variance, placed in its own trailing-year range (box 25–75%ile, ticks 90%ile and max). Amber marker = unusually load-bearing today (≥90%ile of its own year). Factor name green = up today / red = down.
Correlation & dispersion — realized vs implied
Pairwise realized correlation (20d): 9.32% 6.9%ile since 2020 · 84%ile 3m
Top-500 pairwise: 12.43% 15%ile since 2020 · 92.1%ile 3m · implied (Cboe COR1M): 9.35 3.2%ile of its own history (gap +3.1pp)
Realized 20d vol (ann. pts): all stocks 38 vs VIXEQ 39 · index 10 vs VIX 16 · style factors 18 61%ile
20-day window (19 completed days + today); percentiles vs model history since 2020; '3m' tokens rank vs the trailing 63 trading days; definitions in Terms below. Implied prints (Cboe) are delayed ~15 min. as of 15:58 ET
Top 50 high-beta momentum names (eq-wt, since-2020 rank): +1.7% 72%ile · rest of market +0.3%
| Factor | Today | 1d | 5d | 20d | 60d |
|---|---|---|---|---|---|
| Style-Risk | |||||
| International | -0.42% z-1.4 | +0.01% | -0.40% | -0.68% | +0.52% |
| Residual Volatility | +0.27% z+0.6 | +0.41% | -0.32% | +0.98% | +3.11% |
| Beta | +0.38% z+0.4 | +0.18% | +0.65% | +6.37% | +1.33% |
| Style | |||||
| Profitability | +0.38% z+2.0 | -0.12% | +0.89% | +0.61% | -0.34% |
| Value | +0.47% z+2.0 | +0.01% | +0.53% | +0.03% | +1.24% |
| Growth | +0.25% z+1.1 | +0.07% | +0.33% | +0.32% | +1.14% |
| Dividend Yield | +0.18% z+1.0 | -0.16% | +0.02% | +0.04% | +0.45% |
| Leverage | -0.13% z-0.8 | -0.29% | -0.49% | -1.36% | -3.98% |
| Size | -0.19% z-0.6 | +0.05% | +0.20% | +2.53% | +2.14% |
| Liquidity | +0.03% z+0.1 | -0.03% | -0.18% | +0.39% | +2.59% |
| Style-Momentum | |||||
| One-Day Momentum | +0.28% z+1.0 | -0.10% | -0.15% | -2.01% | -2.73% |
| Short-Term Momentum | -0.12% z-0.4 | -0.06% | -0.28% | -0.54% | -7.81% |
| Long-Term Momentum | +0.26% z+0.4 | +0.14% | +0.99% | +3.79% | -0.87% |
| Medium-Term Momentum | +0.04% z+0.1 | -0.23% | -0.70% | -1.34% | -0.08% |
| Style-Positioning | |||||
| Hedge-Fund Ownership | -0.17% z-1.6 | +0.03% | -0.17% | -0.44% | -0.40% |
| Short Interest | -0.18% z-1.1 | +0.26% | +0.01% | -1.26% | -1.87% |
| Style-Flow | |||||
| Morning Activity | -0.18% z-1.4 | +0.07% | -0.46% | -1.00% | +1.37% |
| Short-Sale Activity | -0.02% z-0.1 | -0.08% | -0.25% | +0.09% | +0.62% |
| Thematic | |||||
| Gold | -0.61% z-1.9 | -0.21% | -0.93% | -1.78% | +3.15% |
| Treasury (Duration) | -0.31% z-1.0 | -0.08% | -1.00% | -2.57% | -1.80% |
| Semiconductors | +0.29% z+0.5 | -0.19% | +0.63% | +2.45% | -2.05% |
| Oil | +0.20% z+0.4 | +0.36% | +0.04% | +0.95% | +4.67% |
| China | -0.06% z-0.1 | +0.20% | +0.24% | +0.24% | +1.68% |
| Bitcoin / Crypto | +0.02% z+0.1 | +0.29% | -0.57% | +0.31% | +1.53% |
5/20/60d windows include today's session; 1d is the previous session.
Factor z-score. Today's factor return divided by its daily-return standard deviation over ~1,600 trading days.
Stock-specific (idiosyncratic) return. The part of a stock's move not explained by market, style, or thematic factors in our decomposition.
VIXEQ / DSPX / COR1M. Cboe implied indices: single-stock volatility, dispersion, and 1-month implied correlation (top-50 S&P names). Quotes delayed ~15 minutes.
Data compiled by FactorPulse AI; edited and verified by Jeff Klein. For informational purposes only. Does not constitute financial advice, an investment recommendation, or an offer to buy or sell any securities. Always consult a qualified financial professional before making investment decisions.
For more on factor construction methodology, see www.factorpulse.com/glossary.