The 30-year Treasury yield touched about 5.6% on Tuesday, its highest since 2002, as long-term bonds fell for a sixth straight day even while oil dropped about 4% to near $89 a barrel on a pickup in Middle East shipments through the Strait of Hormuz. The Financial Times blamed a flood of new Treasury and corporate bond sales that Treasury Secretary Scott Bessent's expanded buyback program hasn't offset, and traders still see roughly a 70% chance of another Fed rate hike in October. The selling has spread to state and local government debt, and Bloomberg reported that municipal bonds are on course for their worst month since 1987. Morning data added to the gloom: the Conference Board's consumer confidence index fell to a 12-year low, Americans' inflation expectations for the year ahead rose to 6.1%, and job openings dropped to their lowest since March.
Stocks largely ignored the bond market and traded on their own news. Credit-score maker Fair Isaac plunged 27%, erasing about $5 billion in market value, after federal housing regulator Bill Pulte put rival VantageScore on equal footing with FICO in Fannie Mae and Freddie Mac mortgage pricing, and lender Rocket Mortgage said it would switch, citing a cost of about $1 a score versus roughly $10 for FICO. Cruise operator Carnival jumped 13.5%, adding about $4 billion, after raising its full-year profit outlook on record bookings, and rival Royal Caribbean rose 7.5%. Used-car dealer CarMax gained about 5% after same-store sales grew 13%, more than double what analysts expected. Utilities, battered over the past three months, rose about 1% despite the jump in long-term yields.
Chip stocks led the way up. Equipment maker Applied Materials rose 5%, adding about $20 billion in market value, amid a rally in chip-equipment makers on record order backlogs and new AI memory partnerships, and chip designer Arm gained nearly 4%. Neither OpenAI's decision to scrap an AI model that failed internal safety tests nor anything else slowed the group down. Sneaker giant Nike slipped about 1.5% ahead of its earnings report on Thursday, October 1, and memory-chip maker Micron reports Wednesday, a test of whether chip stocks can keep running on their own news while the 30-year yield sits near levels last seen in 2002.
The 30-year yield rose for a sixth straight session and touched 5.613% intraday, the highest since 2002 FT Bloomberg. At 4:13 PM ET it stood at 5.583%, up 2.1 bp on the day CNBC. The two-year yield moved the other way, falling 3.7 bp to 4.887% CNBC. That leaves roughly 70 bp between the two and puts a curve steepener on top of the long-end selloff.
Oil didn't drive it this time. WTI traded at $88.95 at 4:03 PM ET, down -3.94% CNBC, as Middle East oil exports through the Strait of Hormuz picked up again NYT. The FT blamed heavy Treasury issuance and corporate bond supply, which Treasury Secretary Scott Bessent's expanded buyback program failed to offset FT. Rate futures still priced a 72% chance of another Fed hike in October FT.
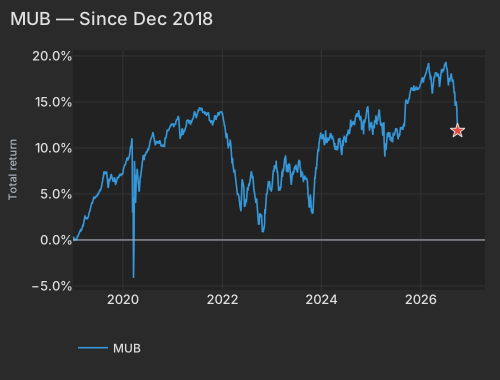
The selling spread into state and local government debt. Municipal bond trading volume hit its highest level since at least 1995 FT, and Bloomberg reported Tuesday that munis are on course for their worst month since 1987. The iShares muni ETF (MUB) is down -4.32% month to date, its worst month in data going back to the end of 2018.
| Date | Ret Pct |
|---|---|
| 2018-12-31 | 0.09 |
| 2019-01-29 | 0.17 |
| 2019-02-26 | 1.21 |
| 2019-03-26 | 2.49 |
| 2019-04-23 | 2.60 |
| 2019-05-21 | 3.94 |
| 2019-06-18 | 4.72 |
| 2019-07-17 | 5.44 |
| 2019-08-13 | 6.93 |
| 2019-09-11 | 6.27 |
| 2019-10-08 | 7.19 |
| 2019-11-05 | 6.50 |
| 2019-12-03 | 7.02 |
| 2020-01-02 | 7.25 |
| 2020-01-30 | 8.83 |
| 2020-02-28 | 9.99 |
| 2020-03-26 | 8.59 |
| 2020-04-23 | 5.86 |
| 2020-05-21 | 8.27 |
| 2020-06-18 | 9.36 |
| 2020-07-17 | 10.43 |
| 2020-08-13 | 11.42 |
| 2020-09-11 | 10.69 |
| 2020-10-08 | 10.18 |
| 2020-11-05 | 11.01 |
| 2020-12-03 | 11.99 |
| 2021-01-04 | 12.58 |
| 2021-02-01 | 13.13 |
| 2021-03-02 | 11.44 |
| 2021-03-29 | 11.77 |
| 2021-04-27 | 13.00 |
| 2021-05-24 | 12.92 |
| 2021-06-22 | 13.52 |
| 2021-07-20 | 14.38 |
| 2021-08-16 | 13.87 |
| 2021-09-14 | 13.78 |
| 2021-10-11 | 12.70 |
| 2021-11-08 | 13.34 |
| 2021-12-06 | 13.63 |
| 2022-01-04 | 13.69 |
| 2022-02-01 | 11.30 |
| 2022-03-02 | 10.63 |
| 2022-03-29 | 7.30 |
| 2022-04-27 | 5.02 |
| 2022-05-24 | 4.91 |
| 2022-06-23 | 4.35 |
| 2022-07-21 | 6.15 |
| 2022-08-18 | 6.06 |
| 2022-09-15 | 3.74 |
| 2022-10-13 | 2.50 |
| 2022-11-09 | 1.78 |
| 2022-12-07 | 6.42 |
| 2023-01-06 | 6.53 |
| 2023-02-03 | 8.01 |
| 2023-03-06 | 5.66 |
| 2023-03-31 | 8.12 |
| 2023-05-01 | 7.36 |
| 2023-05-26 | 6.56 |
| 2023-06-27 | 8.03 |
| 2023-07-25 | 8.41 |
| 2023-08-22 | 6.28 |
| 2023-09-19 | 6.39 |
| 2023-10-17 | 3.71 |
| 2023-11-13 | 5.98 |
| 2023-12-12 | 9.72 |
| 2024-01-10 | 11.18 |
| 2024-02-08 | 10.75 |
| 2024-03-07 | 11.60 |
| 2024-04-04 | 10.49 |
| 2024-05-02 | 10.26 |
| 2024-05-30 | 9.45 |
| 2024-06-28 | 10.75 |
| 2024-07-26 | 11.79 |
| 2024-08-23 | 12.93 |
| 2024-09-20 | 13.46 |
| 2024-10-18 | 13.28 |
| 2024-11-14 | 12.75 |
| 2024-12-13 | 13.16 |
| 2025-01-14 | 11.43 |
| 2025-02-12 | 12.54 |
| 2025-03-12 | 12.42 |
| 2025-04-09 | 10.14 |
| 2025-05-07 | 11.73 |
| 2025-06-05 | 10.97 |
| 2025-07-03 | 12.05 |
| 2025-07-31 | 11.62 |
| 2025-08-28 | 12.64 |
| 2025-09-25 | 14.79 |
| 2025-10-23 | 16.49 |
| 2025-11-19 | 16.27 |
| 2025-12-18 | 16.55 |
| 2026-01-16 | 17.50 |
| 2026-02-17 | 18.60 |
| 2026-03-16 | 17.87 |
| 2026-04-14 | 17.86 |
| 2026-05-11 | 18.02 |
| 2026-06-09 | 18.44 |
| 2026-07-08 | 18.61 |
| 2026-08-05 | 17.72 |
| 2026-09-01 | 16.39 |
| 2026-09-29 | 11.88 |
Style factors explained 9% of stock-level variance today, against a 22% one-year average. Stock-specific moves took 90%, and the market as a whole explained just 0.5%. Among style factors, the ones tied to interest rates were the quietest.
| Factor | Return | Z-Score | 5d Z | 20d Z | 63d Z | Category | Direction |
|---|---|---|---|---|---|---|---|
| Beta | +0.70% | 0.72 | -0.23 | 1.12 | -0.72 | Style-Risk | High-beta names outperformed |
| Leverage | +0.10% | 0.57 | -1.05 | -1.09 | -3.24 | Style | Indebted names edged ahead |
| Oil | -0.14% | -0.29 | 0.08 | 0.39 | 1.39 | Thematic | Oil-exposed names lagged slightly |
| Semiconductors | +0.14% | 0.23 | 0.62 | 1.07 | -1.13 | Thematic | Flat |
| Short-Sale Activity | -0.08% | -0.76 | -1.15 | 0.85 | 0.92 | Style-Flow | Barely-shorted names beat yesterday's most heavily short-sold |
| Short Interest | -0.06% | -0.34 | -0.98 | -1.50 | -0.97 | Style-Positioning | Most-shorted names lagged |
Leverage has lost -3.49% over the past 60 sessions, a z=-3.2 move on the 63-day window. Today it edged up +0.10%, so the most indebted companies held their ground on the day long yields made a new high. The Treasury (Duration) factor moved -0.07%, small next to its -1.60% slide over 20 sessions. Bonds kept falling, but stock returns stopped tracking them.
Utilities made the point most clearly. XLU rose +1.21% at 2.0× the typical session pace, with Vistra (VST) +2.24% and Southern (SO) +1.54%. The rally came after a three-month decline that ranks in the worst 1.6% of 63-day windows since 2018. Energy stocks also took crude's drop in stride: the Oil factor slipped -0.14% and XLE closed -0.95%. They had never joined crude's rally either, with USO up more than 15% over 20 sessions while XLE was flat.
Credit markets were less calm. The high-yield bond ETF (HYG) slipped -0.20% at 3.1× its typical session pace, and MUB traded at 1.7×. Regional banks (KRE) fell -1.01%, adding to a -4.50% slide over 20 sessions.
| ETF | Theme | Today | 1d Ago | 5d Ago | 20d Ago | 63d Ago |
|---|---|---|---|---|---|---|
| USO | oil | -4.31% | +1.13% | +1.25% | +15.66% | +40.09% |
| XLE | energy | -0.95% | +0.10% | -0.58% | -0.32% | +16.61% |
| XLU | utilities | +1.21% | -0.66% | -3.47% | -7.47% | -14.08% |
| SMH | semiconductors | +1.16% | -1.08% | +0.67% | +8.48% | -5.06% |
| IGV | software | -0.22% | -0.55% | -1.59% | -3.72% | +17.29% |
| TLT | long-term bonds | -0.46% | -0.88% | -3.89% | -4.78% | -9.05% |
| MUB | municipal bonds | -0.35% | -0.55% | -2.19% | -4.12% | -5.83% |
| HYG | high yield corporate bonds | -0.20% | -0.41% | -1.45% | -2.22% | -1.63% |
| KRE | banking | -1.01% | -1.40% | -2.00% | -4.50% | -5.08% |
Fair Isaac closed -26.88%, wiping out $4.8B of market value. FHFA Director Bill Pulte moved Fannie Mae and Freddie Mac to a single pricing grid that puts VantageScore 4.0 on equal footing with FICO WSJ. Rocket Mortgage said it would adopt VantageScore, citing a cost of about $0.99 a score against roughly $10 for FICO WSJ.
Carnival (CCL) closed +13.50%, adding $4.0B of market value, after raising its full-year profit outlook on record bookings WSJ. Royal Caribbean (RCL) rose +7.48% alongside it WSJ. CarMax (KMX) closed +4.89% after comparable used-vehicle sales grew 13%, against the 5.6% analysts expected Bloomberg. Nike (NKE) closed the session -1.47% ahead of its report on Thursday, October 1.
Two biotech stocks moved sharply in opposite directions. Iovance (IOVA) jumped +31.41% after raising its 2026 revenue guidance to $410–420 million, above the $402.8 million consensus. uniQure (QURE) fell -37.72% after 48-month data for its Huntington's disease therapy AMT-130 showed a 44% slowing of disease progression, a result that was not statistically significant. Piper Sandler (PIPR) was marked -9.21%, almost all of it stock-specific, and no news explaining the drop has surfaced yet.
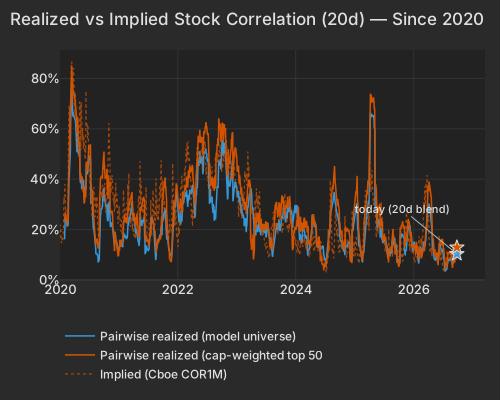
Options prices assume more days like this one. Implied one-month stock correlation (Cboe COR1M) at 9.26 is at the 3.1st percentile of its 20-year history. Implied dispersion (Cboe DSPX), at 36.21, is at the 95.1st percentile. Implied single-stock volatility (Cboe VIXEQ) sits at the top of its 20-session range at 39.64, while the VIX is at 16.13. Realized 20-day correlation of 10.35% is low compared with history since 2020 but higher than 92.1% of readings over the past three months, so it has not set a fresh low.
| Series | Today Pct | Prev Close Pct |
|---|---|---|
| pairwise_model | 10.35 | 10.45 |
| pairwise_top500 | 12.93 | 12.96 |
| implied_cor1m |
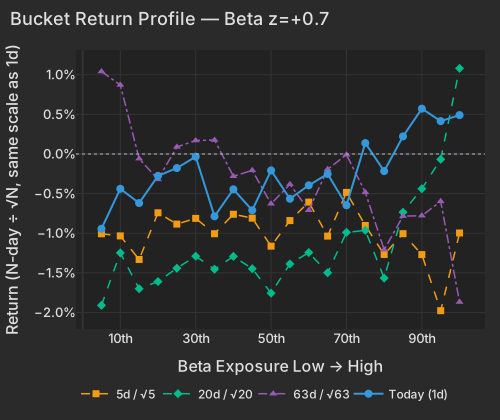
Beta was the only factor with real weight today, at +0.70% (z=+0.7), and chip stocks carried it. Applied Materials (AMAT) closed +5.20%, adding $20.3B of market value, and about 3.9 points of that move was stock-specific. That fits the equipment-maker rally on record order backlogs and new AI memory partnerships Robinhood. Roughly half of Arm (ARM)'s +3.92% came from its factor exposures. Micron (MU) closed +1.02%, mostly on factors, ahead of tomorrow's fiscal fourth-quarter report Bloomberg. OpenAI's decision to scrap GPT-6.1 Astra after it failed internal safety tests WSJ did not slow the chip rally, and the company launched its always-on Dots agents the same day Bloomberg.
The high-beta rally is recent. Beta has gained +4.82% over 20 sessions but is still down -1.75% over 60. The lowest-beta names, heavy in oil producers such as Kosmos (KOS), fell as a group. The question for tomorrow is whether Micron's report can keep chip stocks trading on their own news while the 30-year keeps pushing into levels last seen in 2002.
| Bucket | Ret 1D Pct | Ret 5D Norm Pct | Ret 20D Norm Pct | Ret 63D Norm Pct |
|---|---|---|---|---|
| 1 | -0.94 | -1.01 | -1.91 | 1.04 |
| 2 | -0.44 | -1.03 | -1.25 | 0.87 |
| 3 | -0.62 | -1.33 | -1.70 | -0.06 |
| 4 | -0.28 | -0.74 | -1.61 | -0.32 |
| 5 | -0.18 | -0.88 | -1.44 | 0.09 |
| 6 | -0.03 | -0.81 | -1.29 | 0.17 |
| 7 | -0.79 | -1.01 | -1.45 | 0.18 |
| 8 | -0.45 | -0.76 | -1.29 | -0.28 |
| 9 | -0.71 | -0.81 | -1.45 | -0.21 |
| 10 | -0.21 | -1.16 | -1.76 | -0.63 |
| 11 | -0.57 | -0.84 | -1.39 | -0.38 |
| 12 | -0.40 | -0.61 | -1.24 | -0.71 |
| 13 | -0.25 | -1.04 | -1.50 | -0.19 |
| 14 | -0.65 | -0.48 | -0.99 | -0.01 |
| 15 | 0.14 | -0.90 | -0.96 | -0.48 |
| 16 | -0.22 | -1.27 | -1.57 | -1.21 |
| 17 | 0.22 | -1.01 | -0.73 | -0.78 |
| 18 | 0.57 | -1.27 | -0.44 | -0.78 |
| 19 | 0.41 | -1.98 | -0.07 | -0.60 |
| 20 | 0.49 | -1.00 | 1.08 | -1.87 |
The Conference Board's Consumer Confidence Index, released at 10:00 AM ET, fell to 81.9 against an 89.2 consensus, a 12-year low. Twelve-month inflation expectations rose to 6.1%, a two-year high. The JOLTS report, released at 10:00 AM ET, showed August job openings at 7.079 million, below the 7.23 million forecast and the lowest since March bls.gov. The Dallas Fed's Texas services activity index, released at 10:30 AM ET, fell to -1.8 from 4.2, and input-price growth reached 4.9%, the fastest in more than two years.
Variance decomposition: live intraday — 20260929 session, bracketed against its trailing-year range. Factor returns are trailing through last close. Total cross-sectional dispersion: 6.0%ile of the past year.
Variance mix — % of total, today vs 1d ago vs 1-yr avg
market 17%ile style 18%ile thematic 1.2%ile idiosyncratic 96.4%ile
Variance explained — today vs. factor's trailing-year range
Marker = the factor's share of today's total variance, placed in its own trailing-year range (box 25–75%ile, ticks 90%ile and max). Amber marker = unusually load-bearing today (≥90%ile of its own year). Factor name green = up today / red = down.
Correlation & dispersion — realized vs implied
Pairwise realized correlation (20d): 10.35% 10%ile since 2020 · 92.1%ile 3m
Top-500 pairwise: 12.93% 16%ile since 2020 · 92.1%ile 3m · implied (Cboe COR1M): 9.26 3.1%ile of its own history (gap +3.7pp)
Realized 20d vol (ann. pts): all stocks 38 vs VIXEQ 40 · index 11 vs VIX 16 · style factors 18 63%ile
20-day window (19 completed days + today); percentiles vs model history since 2020; '3m' tokens rank vs the trailing 63 trading days; definitions in Terms below. Implied prints (Cboe) are delayed ~15 min. as of 15:58 ET
Top 50 high-beta momentum names (eq-wt, since-2020 rank): +1.9% 74%ile · rest of market -0.4%
| Factor | Today | 1d | 5d | 20d | 60d |
|---|---|---|---|---|---|
| Style-Risk | |||||
| Beta | +0.70% z+0.7 | -1.01% | -0.50% | +4.82% | -1.75% |
| International | -0.03% z-0.1 | +0.02% | -0.31% | +0.32% | +1.22% |
| Residual Volatility | -0.01% z-0.0 | -0.23% | -0.71% | -0.12% | +2.89% |
| Style | |||||
| Leverage | +0.10% z+0.6 | -0.18% | -0.40% | -0.82% | -3.49% |
| Profitability | +0.11% z+0.6 | +0.23% | +0.53% | +0.12% | -0.81% |
| Dividend Yield | +0.08% z+0.5 | -0.03% | -0.01% | +0.01% | +0.68% |
| Size | +0.10% z+0.3 | +0.13% | +0.99% | +2.73% | +2.82% |
| Value | +0.05% z+0.2 | -0.16% | +0.05% | +0.00% | +0.66% |
| Growth | -0.01% z-0.1 | +0.06% | +0.34% | -0.01% | +1.30% |
| Liquidity | +0.00% z+0.0 | -0.20% | -0.23% | +0.91% | +3.13% |
| Style-Momentum | |||||
| One-Day Momentum | -0.08% z-0.3 | -0.04% | -0.33% | -1.82% | -3.34% |
| Long-Term Momentum | +0.15% z+0.2 | +0.48% | +1.06% | +3.92% | -0.50% |
| Short-Term Momentum | -0.05% z-0.2 | +0.28% | +0.22% | -1.00% | -8.43% |
| Medium-Term Momentum | +0.01% z+0.0 | -0.20% | +0.06% | -1.23% | -0.83% |
| Style-Positioning | |||||
| Short Interest | -0.06% z-0.3 | +0.09% | -0.37% | -1.12% | -1.66% |
| Hedge-Fund Ownership | +0.01% z+0.1 | +0.00% | -0.17% | -0.42% | +0.03% |
| Style-Flow | |||||
| Short-Sale Activity | -0.08% z-0.8 | -0.12% | -0.28% | +0.41% | +0.60% |
| Morning Activity | -0.07% z-0.5 | -0.07% | -0.43% | -0.58% | +1.47% |
| Thematic | |||||
| Oil | -0.14% z-0.3 | +0.12% | +0.09% | +0.82% | +5.77% |
| Semiconductors | +0.14% z+0.2 | +0.29% | +0.84% | +2.89% | -1.46% |
| Gold | -0.07% z-0.2 | -0.04% | -0.73% | -0.81% | +3.73% |
| Treasury (Duration) | -0.07% z-0.2 | -0.33% | -1.04% | -1.60% | -1.72% |
| China | -0.07% z-0.2 | +0.15% | -0.12% | -0.02% | +1.87% |
| Bitcoin / Crypto | -0.05% z-0.2 | -0.13% | -0.76% | -0.21% | +1.71% |
5/20/60d windows include today's session; 1d is the previous session.
Factor z-score. Today's factor return divided by its daily-return standard deviation over ~1,600 trading days.
Dispersion (realized). Total cross-sectional volatility net of the market component; high dispersion is the flip side of low correlation.
Stock-specific (idiosyncratic) return. The part of a stock's move not explained by market, style, or thematic factors in our decomposition.
VIXEQ / DSPX / COR1M. Cboe implied indices: single-stock volatility, dispersion, and 1-month implied correlation (top-50 S&P names). Quotes delayed ~15 minutes.
Data compiled by FactorPulse AI; edited and verified by Jeff Klein. For informational purposes only. Does not constitute financial advice, an investment recommendation, or an offer to buy or sell any securities. Always consult a qualified financial professional before making investment decisions.
For more on factor construction methodology, see www.factorpulse.com/glossary.