President Trump's weekend rejection of Iran's offer to reopen the Strait of Hormuz sent the 10-year Treasury yield up to 5.23%, its highest since 2007, while the 30-year reached levels not seen since 2004. Brent crude topped $108 a barrel as talks in Qatar stalled, but the damage to markets came through interest rates rather than oil: shorter-dated yields rose even faster than long ones, a sign traders expect the Fed to raise rates sooner, possibly as early as its October 27–28 meeting. Gold dropped about 4% to a seven-week low and silver fell 5% as those rate-hike bets grew, and a Dallas Fed survey showing a jump in factory production and rising raw-material prices only added to the case for tighter policy. Energy stocks, oddly, barely moved: Saudi Arabia's East-West pipeline resumed exports at roughly half its capacity, taking some of the sting out of the supply threat. Trump told Axios he still expects indirect talks with Iran this week.
The stocks that swing hardest with the market took the brunt of it. The riskiest group fell about 3%, with AI data-center names down roughly 4% and bitcoin miners and solar companies sliding alongside them, while nuclear and quantum-computing hopefuls such as Oklo, NuScale and Rigetti were among the year's laggards that fell 3%. Memory-chip stocks gave back about 3.5% ahead of Micron's earnings report on Wednesday. The year's big winners were largely spared, with Nvidia rising nearly 2%. Bonds and credit felt the same pressure: junk-bond funds fell on about twice their normal volume, Goldman Sachs strategist Amanda Lynam warned that a flood of new high-yield issuance is overwhelming demand and pushing risk premiums to five-month highs, and Bloomberg reported that billions of dollars of municipal bond sales have stalled as yields rose.
Company news produced the day's biggest individual moves. Boeing fell about 7%, wiping out roughly $10.5 billion in market value, after the FAA delayed certification of its 737 MAX 10 over a software issue. Database company MongoDB plunged 18% after its chief executive left for Meta. Brazilian digital bank Nu dropped 10% on reports it is in talks to buy Britain's Monzo. Drugmaker Regeneron slid about 4.5% after a rival's experimental eye drug performed on par with its blockbuster Eylea. And gold miners were hammered twice over: Gold Fields lost 13% after Australia's Northern Star rejected its $27 billion takeover proposal, while Newmont and Agnico Eagle fell 4% to 5% as the metal itself sank.
Trump turned down Tehran's proposal to reopen the Strait of Hormuz, and Brent crude rose above $108 a barrel on Monday as talks in Qatar stalled Bloomberg. The 10-year Treasury yield rose 5.3 basis points to 5.234% CNBC. The 30-year yield hit its highest level since 2004 Bloomberg. Short-dated yields rose more than long-dated ones: the two-year added 6.4 basis points to 4.93% CNBC, which suggests traders are pricing Fed hikes sooner. Higher crude and higher yields together raised expectations of another hike Bloomberg, and the next Fed decision comes at the October 27–28 meeting.
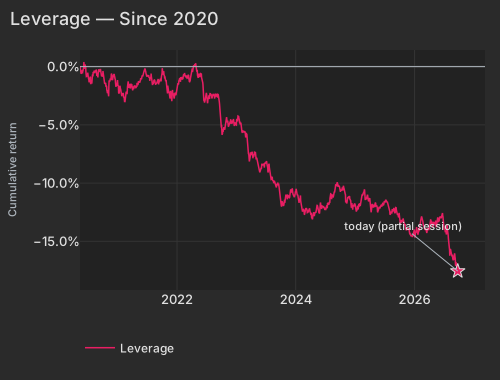
The bond selloff was already under way before the weekend. The Treasury (Duration) factor fell -0.28% at z=-0.87, its fourth decline in five sessions, and it is down -1.50% over 20 sessions. TLT closed the session down -0.88%. Heavily indebted companies lagged again, with Leverage at -0.19% and z=-1.16. That extends a 60-session loss of -3.79%, which scores z=-3.5 on the 63-day window. The weekend news added pressure to a slide that had been building since early summer.
| Date | Cumret Pct |
|---|---|
| 2020-05-14 | 0.02 |
| 2020-06-08 | 0.40 |
| 2020-06-30 | -0.86 |
| 2020-07-23 | -1.29 |
| 2020-08-14 | -0.43 |
| 2020-09-08 | -0.22 |
| 2020-09-30 | -0.84 |
| 2020-10-22 | -1.63 |
| 2020-11-13 | -1.25 |
| 2020-12-08 | -0.83 |
| 2020-12-31 | -1.16 |
| 2021-01-26 | -2.35 |
| 2021-02-18 | -2.81 |
| 2021-03-12 | -1.57 |
| 2021-04-06 | -1.85 |
| 2021-04-28 | -1.57 |
| 2021-05-20 | -1.20 |
| 2021-06-14 | -0.37 |
| 2021-07-07 | -0.86 |
| 2021-07-29 | -0.99 |
| 2021-08-20 | -1.38 |
| 2021-09-14 | -1.25 |
| 2021-10-06 | -0.47 |
| 2021-10-28 | -1.39 |
| 2021-11-19 | -2.74 |
| 2021-12-14 | -2.55 |
| 2022-01-06 | -1.72 |
| 2022-01-31 | -0.95 |
| 2022-02-23 | -0.85 |
| 2022-03-17 | -1.10 |
| 2022-04-08 | -0.35 |
| 2022-05-03 | -0.24 |
| 2022-05-25 | -0.68 |
| 2022-06-17 | -2.88 |
| 2022-07-13 | -2.78 |
| 2022-08-04 | -2.68 |
| 2022-08-26 | -2.46 |
| 2022-09-20 | -3.02 |
| 2022-10-12 | -5.60 |
| 2022-11-03 | -4.34 |
| 2022-11-28 | -4.73 |
| 2022-12-20 | -5.00 |
| 2023-01-13 | -4.37 |
| 2023-02-07 | -5.67 |
| 2023-03-02 | -5.94 |
| 2023-03-24 | -7.93 |
| 2023-04-18 | -7.65 |
| 2023-05-10 | -7.95 |
| 2023-06-02 | -8.81 |
| 2023-06-27 | -8.25 |
| 2023-07-20 | -8.35 |
| 2023-08-11 | -9.51 |
| 2023-09-05 | -10.32 |
| 2023-09-27 | -11.00 |
| 2023-10-19 | -11.97 |
| 2023-11-10 | -11.14 |
| 2023-12-05 | -10.66 |
| 2023-12-28 | -11.01 |
| 2024-01-23 | -11.51 |
| 2024-02-14 | -12.45 |
| 2024-03-08 | -12.14 |
| 2024-04-02 | -12.47 |
| 2024-04-24 | -12.61 |
| 2024-05-16 | -11.95 |
| 2024-06-10 | -12.07 |
| 2024-07-03 | -12.19 |
| 2024-07-26 | -11.71 |
| 2024-08-19 | -11.17 |
| 2024-09-11 | -10.15 |
| 2024-10-03 | -10.58 |
| 2024-10-25 | -10.43 |
| 2024-11-18 | -11.33 |
| 2024-12-11 | -12.12 |
| 2025-01-06 | -12.16 |
| 2025-01-30 | -11.95 |
| 2025-02-24 | -10.90 |
| 2025-03-18 | -11.22 |
| 2025-04-09 | -12.00 |
| 2025-05-02 | -12.05 |
| 2025-05-27 | -12.32 |
| 2025-06-18 | -11.88 |
| 2025-07-14 | -11.49 |
| 2025-08-05 | -12.39 |
| 2025-08-27 | -12.24 |
| 2025-09-19 | -12.72 |
| 2025-10-13 | -13.42 |
| 2025-11-04 | -13.62 |
| 2025-11-26 | -13.90 |
| 2025-12-19 | -14.57 |
| 2026-01-14 | -14.17 |
| 2026-02-06 | -13.64 |
| 2026-03-03 | -13.67 |
| 2026-03-25 | -14.00 |
| 2026-04-17 | -13.24 |
| 2026-05-11 | -13.55 |
| 2026-06-03 | -13.23 |
| 2026-06-26 | -12.82 |
| 2026-07-21 | -14.23 |
| 2026-08-12 | -15.66 |
| 2026-09-03 | -16.59 |
| 2026-09-28 | -17.56 |
| Factor | Return | Z-Score | 5d Z | 20d Z | 63d Z | Category | Direction |
|---|---|---|---|---|---|---|---|
| Beta | -1.01% | -1.04 | -0.10 | +0.99 | -0.63 | Style-Risk | High-beta lagged |
| Long-Term Momentum | +0.51% | +0.79 | +0.77 | +1.39 | -0.77 | Style-Momentum | 12-month winners led |
| Leverage | -0.19% | -1.16 | -1.61 | -1.42 | -3.52 | Style | Levered names lagged |
| Short Interest | +0.21% | +1.27 | +0.08 | -1.31 | -0.87 | Style-Positioning | Most-shorted outperformed |
| Medium-Term Momentum | -0.29% | -1.02 | -0.90 | -0.89 | -0.75 | Style-Momentum | Past month's winners gave back |
| Treasury (Duration) | -0.28% | -0.87 | -0.5 | -1.0 | -0.7 | Thematic | Rate-sensitive lagged |
| Short-Term Momentum | +0.25% | +0.81 | +0.67 | -0.56 | -3.67 | Style-Momentum | Last week's movers extended |
| Oil | +0.14% | +0.28 | +0.1 | +0.8 | +1.5 | Thematic | Flat |
Beta was down about 1% from the first prints of the session and ended close to where it started. That pattern fits news that broke over the weekend and was priced in at the opening bell. The highest-beta bucket fell -2.96%, and its AI and data-center names lost -3.93%. SolarEdge (SEDG) fell -3.52%, Bitdeer (BTDR) -4.01% and MARA Holdings (MARA) -3.23%. The factor model attributes almost all of those moves to exposure rather than company news. Beta is still up +4.28% over 20 sessions, so today took back only part of a month in which high-beta stocks led.
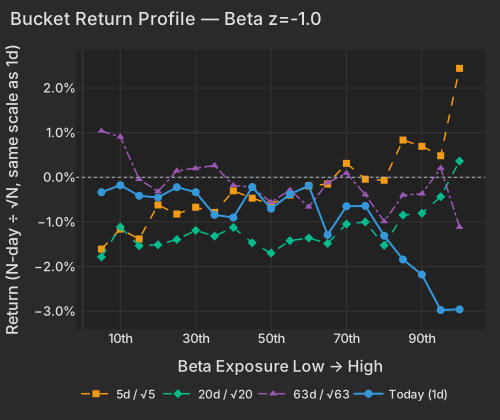
| Bucket | Ret 1D Pct | Ret 5D Norm Pct | Ret 20D Norm Pct | Ret 63D Norm Pct |
|---|---|---|---|---|
| 1 | -0.33 | -1.61 | -1.79 | 1.04 |
| 2 | -0.18 | -1.16 | -1.11 | 0.91 |
| 3 | -0.41 | -1.38 | -1.53 | -0.04 |
| 4 | -0.45 | -0.62 | -1.51 | -0.32 |
| 5 | -0.22 | -0.82 | -1.39 | 0.15 |
| 6 | -0.33 | -0.67 | -1.19 | 0.20 |
| 7 | -0.84 | -0.79 | -1.32 | 0.26 |
| 8 | -0.90 | -0.30 | -1.13 | -0.18 |
| 9 | -0.22 | -0.47 | -1.47 | -0.22 |
| 10 | -0.70 | -0.61 | -1.70 | -0.56 |
| 11 | -0.38 | -0.40 | -1.42 | -0.28 |
| 12 | -0.19 | -0.19 | -1.36 | -0.66 |
| 13 | -1.29 | -0.15 | -1.48 | -0.12 |
| 14 | -0.65 | 0.31 | -1.05 | 0.09 |
| 15 | -0.64 | -0.04 | -1.00 | -0.39 |
| 16 | -1.31 | -0.07 | -1.52 | -0.99 |
| 17 | -1.84 | 0.83 | -0.85 | -0.40 |
| 18 | -2.18 | 0.69 | -0.81 | -0.37 |
| 19 | -2.97 | 0.48 | -0.44 | 0.20 |
| 20 | -2.96 | 2.44 | 0.36 | -1.12 |
The 12-month winners were spared. Long-Term Momentum gained +0.51%, and Nvidia (NVDA) rose +1.75%. Among stocks worth more than $2 billion, high-beta names without strong 12-month returns fell -2.66%. Strong 12-month performers without high beta were flat at +0.08%. The 1-year laggards fell -3.13% as a bucket, led by nuclear and quantum-computing names such as Oklo (OKLO), NuScale (SMR) and Rigetti (RGTI). Investors reduced their sensitivity to the market and left the year's leaders alone.
Short Interest gained at z=+1.27, which usually signals a squeeze. The spread came instead from the least-shorted names, whose bucket fell -1.47%, and on a raw basis the factor was flat. Memory-chip stocks gave back part of their run ahead of Micron's Wednesday report: DRAM closed the session down -3.55% after gaining +8.94% over 20 sessions. Options are pricing roughly a 6% move in Micron on the results CNBC.
Implied single-stock volatility (Cboe VIXEQ) stood at 39.49, the top of its 20-session range. That is the 85th percentile of its history. The VIX rose to 16.11, which sits near the middle of its own history. Implied single-stock correlation (Cboe COR1M) is still near its lows at 9.03, in the bottom 2.8% of its 20-year history. Today was more index-driven than Friday: the market explained 15.5% of the variation across stocks, against 2.8% on Friday. Even so, the biggest moves came from company news.
| Stock | Session Close | Driver |
|---|---|---|
| OCUL | -20.74% | Kodiak Sciences said its wet AMD drug performed on par with Regeneron's Eylea, as Benzinga reported |
| MDB | -18.30% | CEO left for Meta Yahoo Finance |
| MOD | -11.65% | No driver in the coverage yet |
| NU | -9.90% | In talks to buy UK digital bank Monzo, as Axios reported |
| BA | -6.88% | FAA delayed 737 MAX 10 certification over a software issue The Wall Street Journal |
| REGN | -4.52% | Knock-on effect of the Kodiak data on Eylea, as Benzinga reported |
| HHH | +8.19% | Executive insider buying and Bill Ackman's backing Economic Times |
Boeing's drop erased $10.5 billion of market value, and Nu's erased $6.5 billion. Modine stands out: the factor model attributes most of its drop to the company itself, and no explanation has appeared in the coverage.
Spot gold was at $4,118.42 at 4:11 PM ET, down -3.92% CNBC, a seven-week low as rate-hike bets rose Bloomberg. Silver futures fell -5.1% CNBC. The dollar index rose +0.23% to 101.20 CNBC, close to its June high of 101.8. Gold Fields (GFI) closed the session down -12.89% as Northern Star rejected its $27 billion takeover proposal Financial Times. The table shows that precious metals had been falling for a month before today, and today added to that decline.
| ETF | Theme | Today | 1d Ago | 5d Ago | 20d Ago | 63d Ago |
|---|---|---|---|---|---|---|
| SLV | silver | -5.49% | +0.90% | -2.99% | -7.38% | +9.12% |
| GDX | gold miners | -5.35% | +0.56% | -2.73% | -10.43% | +20.61% |
| GLD | gold | -3.92% | +0.44% | -1.93% | -6.91% | +5.29% |
| DRAM | memory chips | -3.55% | +1.96% | +3.86% | +8.94% | -13.87% |
| NLR | nuclear power | -1.75% | -0.41% | -1.77% | -15.39% | -9.05% |
| TLT | long-term Treasuries | -0.88% | -0.13% | -2.38% | -4.22% | -8.15% |
| MUB | municipal bonds | -0.56% | -0.41% | -1.66% | -3.74% | -5.20% |
| HYG | high-yield credit | -0.40% | -0.04% | -0.85% | -1.98% | -1.00% |
| XLE | energy | +0.06% | -0.89% | -2.94% | +0.21% | +15.93% |
| USO | oil | +0.95% | -3.11% | -3.57% | +14.09% | +40.62% |
Materials had the weakest median stock, dragged down by Newmont (NEM), which fell -4.40%, and Agnico Eagle (AEM), which fell -4.99%.
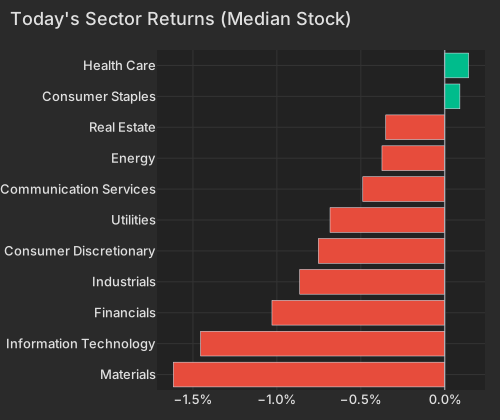
| Sector | Median Ret Pct |
|---|---|
| Materials | -1.62 |
| Information Technology | -1.45 |
| Financials | -1.03 |
| Industrials | -0.86 |
| Consumer Discretionary | -0.75 |
| Utilities | -0.68 |
| Communication Services | -0.49 |
| Energy | -0.37 |
| Real Estate | -0.35 |
| Consumer Staples | 0.09 |
| Health Care | 0.14 |
Little of the move in crude reached stocks. WTI traded as high as $96.54, then stood at $93.06 at 4:01 PM ET, up +0.70% CNBC. Saudi Arabia's East-West pipeline resumed exports at about 3.5 million barrels a day, half its capacity Bloomberg. XLE closed the session up +0.06% and the Oil factor scored z=+0.28. Gold, long-dated bonds and high-beta stocks all fell while oil producers held steady, which means stocks absorbed the Hormuz news as a rise in interest rates, not as an oil-supply shock.
Credit markets felt the same pressure. HYG closed the session down -0.40% on about twice its usual trading volume. Goldman Sachs credit strategist Amanda Lynam said a surge of new high-yield bonds is overwhelming demand and has pushed risk premiums to five-month highs Bloomberg. MUB traded at 2.3 times its usual volume, and Bloomberg reported that billions of dollars of municipal bond sales have stalled as yields rose. Trump told Axios on Sunday that he still expects indirect talks with Iran this week. Until those talks produce something, the 10-year yield is where Hormuz risk shows up.
The Dallas Fed Manufacturing Survey, released at 10:30 AM ET, showed its general business activity index easing to 9.8 from 11.6, still above the 6.0 consensus Morningstar. The production index jumped 13 points to 29.5, and the raw materials prices index rose to 52.2. Both readings add to the case for rate hikes that bond traders are already pricing.
Variance decomposition: live intraday — 20260928 session, bracketed against its trailing-year range. Factor returns are trailing through last close. Total cross-sectional dispersion: 76%ile of the past year.
Variance mix — % of total, today vs 1d ago vs 1-yr avg
market 60%ile style 21%ile thematic 15%ile idiosyncratic 79%ile
Variance explained — today vs. factor's trailing-year range
Marker = the factor's share of today's total variance, placed in its own trailing-year range (box 25–75%ile, ticks 90%ile and max). Amber marker = unusually load-bearing today (≥90%ile of its own year). Factor name green = up today / red = down.
Correlation & dispersion — realized vs implied
Pairwise realized correlation (20d): 10.55% 11%ile since 2020 · 92.1%ile 3m
Top-500 pairwise: 13.02% 17%ile since 2020 · 92.1%ile 3m · implied (Cboe COR1M): 9.03 2.8%ile of its own history (gap +4.0pp)
Realized 20d vol (ann. pts): all stocks 38 vs VIXEQ 39 · index 11 vs VIX 16 · style factors 18 63%ile
20-day window (19 completed days + today); percentiles vs model history since 2020; '3m' tokens rank vs the trailing 63 trading days; definitions in Terms below. Implied prints (Cboe) are delayed ~15 min. as of 15:58 ET
Top 50 high-beta momentum names (eq-wt, since-2020 rank): -2.5% 15%ile · rest of market -0.6%
| Factor | Today | 1d | 5d | 20d | 60d |
|---|---|---|---|---|---|
| Style-Risk | |||||
| Beta | -1.01% z-1.1 | +0.42% | -0.22% | +4.28% | -1.37% |
| Residual Volatility | -0.19% z-0.4 | -0.78% | -0.61% | +0.30% | +2.87% |
| International | +0.02% z+0.1 | +0.03% | -0.23% | +0.40% | +1.61% |
| Style | |||||
| Leverage | -0.19% z-1.2 | +0.04% | -0.60% | -1.07% | -3.79% |
| Value | -0.23% z-1.0 | +0.16% | -0.04% | -0.28% | +0.33% |
| Liquidity | -0.24% z-0.9 | +0.05% | -0.27% | +1.18% | +3.01% |
| Profitability | +0.16% z+0.8 | +0.28% | +0.55% | -0.17% | -1.21% |
| Size | +0.06% z+0.2 | +0.12% | +0.56% | +2.66% | +2.95% |
| Dividend Yield | -0.02% z-0.1 | -0.03% | -0.19% | +0.16% | +0.50% |
| Growth | +0.01% z+0.0 | -0.02% | +0.18% | -0.19% | +1.43% |
| Style-Momentum | |||||
| Medium-Term Momentum | -0.29% z-1.0 | -0.32% | -0.58% | -1.14% | -1.28% |
| Short-Term Momentum | +0.25% z+0.8 | -0.33% | +0.46% | -0.76% | -8.47% |
| Long-Term Momentum | +0.51% z+0.8 | -0.08% | +1.11% | +4.01% | -0.61% |
| One-Day Momentum | -0.10% z-0.4 | -0.25% | -0.20% | -1.97% | -3.71% |
| Style-Positioning | |||||
| Short Interest | +0.21% z+1.3 | -0.11% | +0.03% | -0.98% | -1.55% |
| Hedge-Fund Ownership | +0.05% z+0.4 | -0.04% | -0.06% | -0.50% | +0.03% |
| Style-Flow | |||||
| Short-Sale Activity | -0.05% z-0.5 | +0.05% | -0.04% | +0.47% | +0.86% |
| Morning Activity | -0.04% z-0.3 | -0.20% | -0.32% | -0.39% | +1.54% |
| Thematic | |||||
| Treasury (Duration) | -0.28% z-0.9 | -0.22% | -0.34% | -1.50% | -1.88% |
| Bitcoin / Crypto | -0.20% z-0.7 | -0.71% | -0.82% | +0.25% | +1.79% |
| China | +0.21% z+0.5 | +0.02% | +0.08% | -0.01% | +2.00% |
| Semiconductors | +0.28% z+0.5 | +0.10% | +0.70% | +3.33% | -1.59% |
| Oil | +0.14% z+0.3 | -0.50% | +0.16% | +1.68% | +6.25% |
| Gold | +0.00% z+0.0 | +0.01% | -0.33% | -0.47% | +3.80% |
5/20/60d windows include today's session; 1d is the previous session.
Pairwise realized correlation. Index variance net of the weighted idiosyncratic diagonal, over the cross terms — the estimator used for implied-correlation indices. 20-day window unless noted; history since 2020.
Market variance share. The fraction of cross-sectional variance explained by the market factor — the attribution companion to pairwise correlation, not a substitute for it.
Factor z-score. Today's factor return divided by its daily-return standard deviation over ~1,600 trading days.
Conditional importance. A factor's relative share of what a tree-based fit of today's stock returns explains; sums to 100% across factors.
High-beta momentum cohort. US names above $2B market cap in the top quintile of both raw beta and 12-month momentum; membership frozen at each month's first business day. “Top 50” = the 50 strongest by combined rank.
Dispersion (realized). Total cross-sectional volatility net of the market component; high dispersion is the flip side of low correlation.
Stock-specific (idiosyncratic) return. The part of a stock's move not explained by market, style, or thematic factors in our decomposition.
VIXEQ / DSPX / COR1M. Cboe implied indices: single-stock volatility, dispersion, and 1-month implied correlation (top-50 S&P names). Quotes delayed ~15 minutes.
Data compiled by FactorPulse AI; edited and verified by Jeff Klein. For informational purposes only. Does not constitute financial advice, an investment recommendation, or an offer to buy or sell any securities. Always consult a qualified financial professional before making investment decisions.
For more on factor construction methodology, see www.factorpulse.com/glossary.