Bond investors sold for a second day, and the damage fell on heavily indebted companies rather than the broad index. The 10-year Treasury yield climbed to about 5.2%, its highest since 2007 by the Wall Street Journal's count, and the 30-year reached a level not seen since 2004. The push came from a jobless-claims report that showed fewer Americans filing than economists expected, from New York Fed President John Williams calling another rate hike reasonable, and from oil jumping 3% to above $95 a barrel. The S&P 500 barely budged, but the most indebted companies sank: private-equity giant KKR and mortgage lenders Annaly and Blackstone Mortgage Trust led the losers, extending a months-long slide in heavily indebted stocks that is now the worst since 2020. Utilities, long-term Treasury bonds and real estate fell again, while regional banks rose as the gap between long and short rates widened.
The same pressure reached the borrowers funding the artificial-intelligence buildout. Goldman Sachs and Oaktree pointed to rising costs on AI-related debt, and software giant Oracle fell more than 4% after sending a force majeure notice on its $165 billion Project Jupiter data center in New Mexico, a step that would let it defer payments if the site misses its 2028 start. Meta went the other way. The social-media company rose 4.5% and added about $84 billion in market value after unveiling its Muse Charm device at its Connect event, the fourth day of a rally built on the Muse line. Unlike earlier in the week, the enthusiasm stayed with Meta rather than spreading to other high-flying stocks.
Beyond rates, company news drove the biggest swings. Miner Kinross Gold dropped 12% after cutting its production forecast and raising cost estimates, and casino operator MGM Resorts fell 11% after Barry Diller withdrew his takeover bid. Drugmaker Acadia slid 13% when a mid-stage trial of its remlifanserin narrowly missed its main goal, and security-software maker Gen Digital lost 12% after Yahoo Finance reported it had made an early-stage takeover approach to GoDaddy. Treasury Secretary Scott Bessent confirmed a two-month extension of the U.S.-China trade truce as Xi Jinping's state visit began, but the news barely moved prices. Costco slipped ahead of its results after the bell.
The 10-year Treasury yield stood at 5.21% at 4:10 PM ET, up 9.4 bps on the day CNBC. The 30-year rose 9.1 bps to 5.49%, while the 2-year added only 3.6 bps, so long-dated bonds took the selling CNBC. The Wall Street Journal reported the 10-year at its highest since 2007 and the 30-year at its highest since 2004. The push came from initial claims of 197,000, below the 201,000 expected, and from New York Fed President John Williams, who called another hike reasonable The Wall Street Journal. WTI crude added to inflation worries: it was at $95.22 at 4:01 PM ET, up +3.32% CNBC.
| Factor | Return | Z-Score | 5d Z | 20d Z | 63d Z | Category | Direction |
|---|---|---|---|---|---|---|---|
| Leverage | -0.14% | -0.86 | -1.38 | -1.56 | -3.60 | Style | Most indebted lagged least indebted |
| Short-Sale Activity | -0.28% | -2.61 | -0.68 | 0.76 | 1.18 | Style-Flow | Barely-shorted beat heavily short-sold |
| Profitability | -0.26% | -1.35 | 0.84 | -0.83 | -1.73 | Style | Most profitable lagged |
| Value | -0.28% | -1.21 | -0.44 | -0.24 | -0.58 | Style | Cheapest lagged most expensive |
| Morning Activity | +0.12% | 0.96 | -1.95 | 0.12 | 2.22 | Style-Flow | Morning-heavy names outperformed |
| Short-Term Momentum | +0.24% | 0.80 | 0.69 | -0.73 | -3.50 | Style-Momentum | Last week's winners held on |
| Long-Term Momentum | +0.39% | 0.61 | 0.52 | 0.98 | -0.99 | Style-Momentum | 12-month winners outperformed |
| Treasury (Duration) | -0.03% | -0.11 | -0.4 | -1.3 | -0.6 | Thematic | Flat |
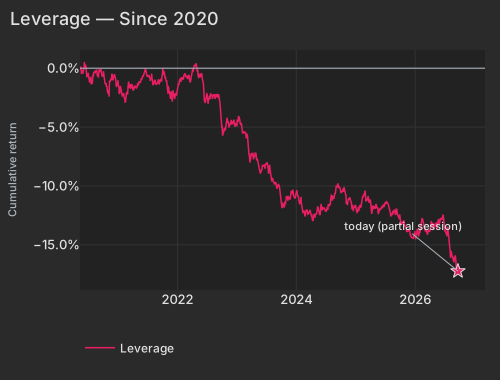
The Leverage factor, which ranks companies by how indebted they are, fell -0.14% at z=-0.86. On its own that is a modest day. The factor has lost -4.24% over the past 60 sessions and has fallen on three of the last five. Its 63-day z-score of z=-3.6 reads as a steady, months-long markdown of borrowers, and a 9-bp jump in the 10-year yield is the newest push.
| Date | Cumret Pct |
|---|---|
| 2020-05-12 | 0.06 |
| 2020-06-04 | -0.04 |
| 2020-06-26 | -0.68 |
| 2020-07-21 | -1.35 |
| 2020-08-12 | -0.22 |
| 2020-09-03 | -0.45 |
| 2020-09-28 | -0.54 |
| 2020-10-20 | -1.27 |
| 2020-11-11 | -1.14 |
| 2020-12-04 | -0.58 |
| 2020-12-29 | -1.32 |
| 2021-01-22 | -2.11 |
| 2021-02-16 | -2.87 |
| 2021-03-10 | -1.35 |
| 2021-04-01 | -1.73 |
| 2021-04-26 | -1.65 |
| 2021-05-18 | -1.15 |
| 2021-06-10 | -0.36 |
| 2021-07-02 | -0.62 |
| 2021-07-27 | -0.46 |
| 2021-08-18 | -1.04 |
| 2021-09-10 | -1.40 |
| 2021-10-04 | -0.00 |
| 2021-10-26 | -1.06 |
| 2021-11-17 | -2.24 |
| 2021-12-10 | -2.17 |
| 2022-01-04 | -1.79 |
| 2022-01-27 | -0.81 |
| 2022-02-18 | -0.53 |
| 2022-03-15 | -0.63 |
| 2022-04-06 | -0.03 |
| 2022-04-29 | 0.06 |
| 2022-05-23 | -0.77 |
| 2022-06-15 | -2.30 |
| 2022-07-11 | -2.91 |
| 2022-08-02 | -2.33 |
| 2022-08-24 | -2.42 |
| 2022-09-16 | -2.51 |
| 2022-10-10 | -5.60 |
| 2022-11-01 | -4.33 |
| 2022-11-23 | -4.80 |
| 2022-12-16 | -4.71 |
| 2023-01-11 | -4.33 |
| 2023-02-03 | -5.32 |
| 2023-02-28 | -5.80 |
| 2023-03-22 | -7.69 |
| 2023-04-14 | -7.74 |
| 2023-05-08 | -7.72 |
| 2023-05-31 | -8.67 |
| 2023-06-23 | -8.54 |
| 2023-07-18 | -8.91 |
| 2023-08-09 | -9.35 |
| 2023-08-31 | -9.79 |
| 2023-09-25 | -10.39 |
| 2023-10-17 | -11.67 |
| 2023-11-08 | -10.85 |
| 2023-12-01 | -10.57 |
| 2023-12-26 | -11.07 |
| 2024-01-19 | -11.27 |
| 2024-02-12 | -12.09 |
| 2024-03-06 | -12.04 |
| 2024-03-28 | -12.03 |
| 2024-04-22 | -12.41 |
| 2024-05-14 | -11.78 |
| 2024-06-06 | -11.90 |
| 2024-07-01 | -12.18 |
| 2024-07-24 | -11.55 |
| 2024-08-15 | -11.03 |
| 2024-09-09 | -10.10 |
| 2024-10-01 | -10.40 |
| 2024-10-23 | -10.09 |
| 2024-11-14 | -11.48 |
| 2024-12-09 | -11.61 |
| 2025-01-02 | -11.68 |
| 2025-01-28 | -11.76 |
| 2025-02-20 | -10.85 |
| 2025-03-14 | -11.16 |
| 2025-04-07 | -11.59 |
| 2025-04-30 | -11.77 |
| 2025-05-22 | -12.38 |
| 2025-06-16 | -11.84 |
| 2025-07-10 | -11.29 |
| 2025-08-01 | -12.10 |
| 2025-08-25 | -12.26 |
| 2025-09-17 | -12.34 |
| 2025-10-09 | -13.28 |
| 2025-10-31 | -13.43 |
| 2025-11-24 | -13.79 |
| 2025-12-17 | -14.36 |
| 2026-01-12 | -14.14 |
| 2026-02-04 | -13.62 |
| 2026-02-27 | -13.45 |
| 2026-03-23 | -14.01 |
| 2026-04-15 | -13.27 |
| 2026-05-07 | -13.32 |
| 2026-06-01 | -13.22 |
| 2026-06-24 | -12.60 |
| 2026-07-17 | -14.11 |
| 2026-08-10 | -16.10 |
| 2026-09-01 | -16.39 |
| 2026-09-24 | -17.23 |
The selling was heaviest among the most indebted names. The most-levered group, headed by KKR, Annaly (NLY), Rackspace (RXT), Blackstone Mortgage Trust (BXMT) and OneMain (OMF), lost -0.95%. The five REITs in that group fell -2.03%, while the broad REIT fund VNQ fell far less (table below). That puts the pain in the heaviest borrowers, such as the mortgage lenders Annaly and Blackstone Mortgage Trust, rather than across the whole sector.
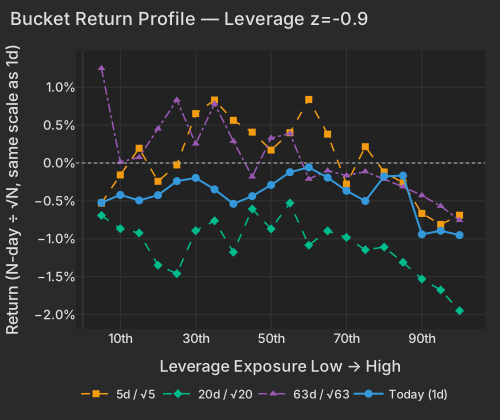
| Bucket | Ret 1D Pct | Ret 5D Norm Pct | Ret 20D Norm Pct | Ret 63D Norm Pct |
|---|---|---|---|---|
| 1 | -0.52 | -0.53 | -0.69 | 1.25 |
| 2 | -0.42 | -0.16 | -0.87 | 0.01 |
| 3 | -0.49 | 0.19 | -0.92 | 0.08 |
| 4 | -0.42 | -0.24 | -1.35 | 0.45 |
| 5 | -0.24 | -0.03 | -1.46 | 0.83 |
| 6 | -0.20 | 0.65 | -0.89 | 0.25 |
| 7 | -0.35 | 0.83 | -0.76 | 0.78 |
| 8 | -0.54 | 0.56 | -1.18 | 0.29 |
| 9 | -0.44 | 0.41 | -0.61 | -0.18 |
| 10 | -0.29 | 0.17 | -0.87 | 0.33 |
| 11 | -0.12 | 0.40 | -0.53 | 0.39 |
| 12 | -0.06 | 0.84 | -1.08 | -0.21 |
| 13 | -0.19 | 0.38 | -0.90 | -0.10 |
| 14 | -0.37 | -0.28 | -0.98 | -0.17 |
| 15 | -0.50 | 0.22 | -1.15 | -0.11 |
| 16 | -0.18 | -0.12 | -1.11 | -0.21 |
| 17 | -0.17 | -0.26 | -1.31 | -0.31 |
| 18 | -0.94 | -0.67 | -1.53 | -0.43 |
| 19 | -0.89 | -0.81 | -1.68 | -0.57 |
| 20 | -0.95 | -0.69 | -1.95 | -0.76 |
Rate-sensitive funds kept falling. TLT, LQD and XLU fell again and are lower over 20 and 63 days. Regional banks (KRE) rose as the gap between long and short yields widened.
| ETF | Theme | Today | 1d Ago | 5d Ago | 20d Ago | 63d Ago |
|---|---|---|---|---|---|---|
| USO | oil | +3.01% | +3.30% | -4.70% | +17.98% | +40.02% |
| XLC | communication services | +1.25% | -0.85% | -0.07% | -0.23% | +5.99% |
| KRE | regional banks | +0.75% | -1.14% | -2.69% | -4.77% | -4.31% |
| SPY | large cap | -0.23% | -0.72% | +2.08% | +0.50% | +4.97% |
| VNQ | real estate | -0.24% | -1.46% | -1.31% | -7.05% | -4.90% |
| HYG | high-yield bonds | -0.29% | -0.72% | -0.41% | -1.74% | -0.72% |
| LQD | investment-grade bonds | -0.85% | -1.14% | -0.54% | -2.37% | -3.90% |
| XLU | utilities | -0.90% | -1.92% | -3.09% | -7.54% | -12.07% |
| TLT | long-term Treasuries | -1.56% | -1.58% | -0.52% | -3.24% | -6.85% |
Borrowers funding the AI buildout came under the same kind of pressure. Goldman Sachs and Oaktree pointed to rising costs on AI-related debt Bloomberg. Separately, Oracle (ORCL) fell more than 4% after sending a force majeure notice on its $165 billion Project Jupiter data center in New Mexico, which would let it defer payments if the site misses its 2028 start Bloomberg.
Short-Sale Activity was the day's highest-conviction print, at -0.28% and z=-2.6. Stocks heavily short-sold on Wednesday lagged the barely-shorted ones, including Albemarle (ALB), Expedia (EXPE) and Oshkosh (OSK). That is the factor's usual direction, but its share of cross-stock variance topped anything in the past year.
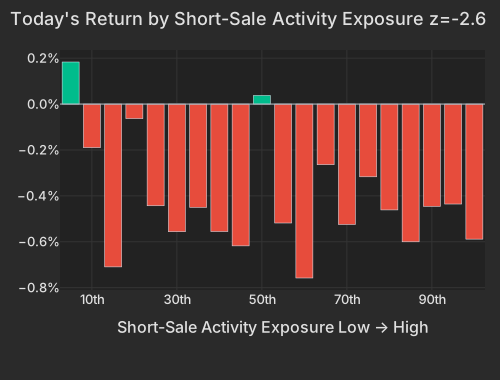
| Bucket | Avg Ret Pct |
|---|---|
| 1 | 0.18 |
| 2 | -0.19 |
| 3 | -0.71 |
| 4 | -0.06 |
| 5 | -0.44 |
| 6 | -0.56 |
| 7 | -0.45 |
| 8 | -0.56 |
| 9 | -0.62 |
| 10 | 0.04 |
| 11 | -0.52 |
| 12 | -0.76 |
| 13 | -0.26 |
| 14 | -0.52 |
| 15 | -0.32 |
| 16 | -0.46 |
| 17 | -0.60 |
| 18 | -0.45 |
| 19 | -0.44 |
| 20 | -0.59 |
Value fell -0.28% (z=-1.2) as the cheapest stocks lagged, among them STMicroelectronics (STM), Stellantis (STLA) and ZIM. Profitability fell -0.26% (z=-1.4). The two factors share many of the same stocks, so this reads as one move. Yesterday's gold-miner selloff did not continue at the factor level. The Gold factor edged up +0.07%, while spot gold was $4,272.49 at 4:11 PM ET, down -0.34% CNBC.
For all the bond selling, SPY closed down just -0.05%. The Treasury (Duration) factor, which tracks rate sensitivity directly, was flat at -0.03%. The market explained just 2.5% of the variance across stocks, against a 9.3% one-year average, and stock-specific moves explained 88.7%. Rates set the mood, but company news drove the biggest price moves.
| Stock | Closed | Driver |
|---|---|---|
| Acadia (ACAD) | -12.82% | Company said its Phase 2 RADIANT study of remlifanserin narrowly missed its primary endpoint. |
| Gen Digital (GEN) | -12.06% | Yahoo Finance reported a takeover approach for GoDaddy, in early-stage talks. |
| Kinross Gold (KGC) | -11.72% | Cut production guidance and raised cost estimates Robinhood. |
| MGM Resorts (MGM) | -11.09% | Barry Diller withdrew his bid The Wall Street Journal. |
| TD SYNNEX (SNX) | -9.74% | Reported before the open; Investing.com said the quarter beat forecasts but the shares fell. The drop erased $2.3B of market value. |
| Arm (ARM) | -7.88% | No reported driver yet; largely the stock's own move. |
| Meta (META) | +4.53% | Muse Charm device unveiled at Connect Bloomberg. |
| Everpure (P) | +11.16% | FY2028 revenue outlook of $7.0B–$7.3B against $6.37B consensus Barron's. |
Day four of the Muse trade brought hardware, and Meta added about $84B of market value, almost all of it company-specific. Unlike Monday, the gain did not spread to other high-beta stocks: the Beta factor was flat at -0.04%. Costco (COST) closed -0.92% ahead of its report after the bell. Treasury Secretary Scott Bessent confirmed a two-month extension of the U.S.–China trade truce as Xi Jinping's state visit began The Wall Street Journal. It barely moved prices: the China factor rose +0.08%.
Heavily indebted stocks have now absorbed two days of 5%-plus 10-year yields while the index held steady.
Initial jobless claims, released at 8:30 AM ET, fell to 197,000 for the week ended September 19, below the 201,000 consensus The Wall Street Journal. Treasury yields climbed from there, and the 10-year added 9.4 bps on the day.
Variance decomposition: live intraday — 20260924 session, bracketed against its trailing-year range. Factor returns are trailing through last close. Total cross-sectional dispersion: 8.0%ile of the past year.
Variance mix — % of total, today vs 1d ago vs 1-yr avg
market 34%ile style 11%ile thematic 2.0%ile idiosyncratic 95.2%ile
Variance explained — today vs. factor's trailing-year range
Marker = the factor's share of today's total variance, placed in its own trailing-year range (box 25–75%ile, ticks 90%ile and max). Amber marker = unusually load-bearing today (≥90%ile of its own year). Factor name green = up today / red = down.
Correlation & dispersion — realized vs implied
Pairwise realized correlation (20d): 9.75% 8.1%ile since 2020 · 89%ile 3m
Top-500 pairwise: 10.75% 10%ile since 2020 · 68%ile 3m · implied (Cboe COR1M): 8.87 2.5%ile of its own history (gap +1.9pp)
Realized 20d vol (ann. pts): all stocks 39 vs VIXEQ 39 · index 11 vs VIX 15 · style factors 19 67%ile
20-day window (19 completed days + today); percentiles vs model history since 2020; '3m' tokens rank vs the trailing 63 trading days; definitions in Terms below. Implied prints (Cboe) are delayed ~15 min. as of 15:58 ET
High-beta momentum cohort (eq-wt, since-2020 rank): -0.2% 42%ile · rest of market -0.5%
| Factor | Today | 1d | 5d | 20d | 60d |
|---|---|---|---|---|---|
| Style-Risk | |||||
| International | -0.16% z-0.5 | -0.17% | -0.39% | +0.42% | +1.66% |
| Residual Volatility | +0.09% z+0.2 | +0.21% | +0.54% | +1.90% | +3.80% |
| Beta | -0.04% z-0.0 | -0.59% | +3.06% | +3.90% | -5.67% |
| Style | |||||
| Profitability | -0.26% z-1.4 | +0.18% | +0.36% | -0.71% | -2.31% |
| Value | -0.28% z-1.2 | +0.28% | -0.23% | -0.25% | -0.04% |
| Leverage | -0.14% z-0.9 | -0.18% | -0.52% | -1.17% | -4.24% |
| Growth | +0.18% z+0.7 | +0.09% | +0.34% | +0.11% | +1.81% |
| Size | +0.23% z+0.7 | +0.37% | +1.00% | +3.09% | +2.46% |
| Dividend Yield | -0.09% z-0.5 | +0.08% | -0.17% | +0.07% | +0.08% |
| Liquidity | +0.09% z+0.3 | -0.18% | +0.28% | +1.50% | +3.14% |
| Style-Momentum | |||||
| Short-Term Momentum | +0.24% z+0.8 | +0.07% | +0.47% | -0.99% | -8.25% |
| Long-Term Momentum | +0.39% z+0.6 | +0.12% | +0.75% | +2.83% | -4.84% |
| Medium-Term Momentum | +0.10% z+0.3 | +0.48% | +0.09% | -0.30% | -1.20% |
| One-Day Momentum | -0.07% z-0.3 | +0.07% | -0.31% | -2.09% | -3.20% |
| Style-Positioning | |||||
| Hedge-Fund Ownership | +0.03% z+0.2 | -0.17% | +0.23% | -0.64% | +0.24% |
| Short Interest | -0.01% z-0.0 | -0.30% | -0.41% | -1.10% | -1.22% |
| Style-Flow | |||||
| Short-Sale Activity | -0.28% z-2.6 | +0.11% | -0.16% | +0.37% | +0.90% |
| Morning Activity | +0.12% z+1.0 | -0.21% | -0.54% | +0.07% | +2.16% |
| Thematic | |||||
| Oil | +0.24% z+0.5 | +0.36% | +0.00% | +2.48% | +5.75% |
| Gold | +0.07% z+0.2 | -0.70% | -0.54% | -0.73% | +5.27% |
| China | +0.08% z+0.2 | -0.30% | +0.44% | +0.51% | +2.31% |
| Treasury (Duration) | -0.03% z-0.1 | -0.39% | -0.31% | -1.82% | -1.37% |
| Bitcoin / Crypto | +0.00% z+0.0 | +0.09% | +0.43% | +2.00% | +2.78% |
| Semiconductors | -0.00% z-0.0 | +0.32% | +0.72% | +1.94% | -5.95% |
5/20/60d windows include today's session; 1d is the previous session.
Pairwise realized correlation. Index variance net of the weighted idiosyncratic diagonal, over the cross terms — the estimator used for implied-correlation indices. 20-day window unless noted; history since 2020.
Market variance share. The fraction of cross-sectional variance explained by the market factor — the attribution companion to pairwise correlation, not a substitute for it.
Factor z-score. Today's factor return divided by its daily-return standard deviation over ~1,600 trading days.
Conditional importance. A factor's relative share of what a tree-based fit of today's stock returns explains; sums to 100% across factors.
High-beta momentum cohort. US names above $2B market cap in the top quintile of both raw beta and 12-month momentum; membership frozen at each month's first business day. “Top 50” = the 50 strongest by combined rank.
Dispersion (realized). Total cross-sectional volatility net of the market component; high dispersion is the flip side of low correlation.
Stock-specific (idiosyncratic) return. The part of a stock's move not explained by market, style, or thematic factors in our decomposition.
VIXEQ / DSPX / COR1M. Cboe implied indices: single-stock volatility, dispersion, and 1-month implied correlation (top-50 S&P names). Quotes delayed ~15 minutes.
Data compiled by FactorPulse AI; edited and verified by Jeff Klein. For informational purposes only. Does not constitute financial advice, an investment recommendation, or an offer to buy or sell any securities. Always consult a qualified financial professional before making investment decisions.
For more on factor construction methodology, see www.factorpulse.com/glossary.