Oil fell about 2% to roughly $93 a barrel Friday morning after US and Iranian negotiators, brought together by Qatari mediators on the sidelines of the UN General Assembly, discussed a phased deal that would reopen the Strait of Hormuz in exchange for Washington lifting its blockade of Iranian ports. Energy stocks were the only sector losing ground, giving back part of a 20% run in oil over the past month. The relief flowed instead to the stocks that swing hardest with the market, above all chipmakers: Arm rose about 4.5%, and semiconductor and memory-chip funds extended a week of gains that has already added roughly 7% to 8%.
The catch is that cheaper oil has not meant cheaper money. The 10-year Treasury yield is stuck near 5.2%, just off its highest level since 2007, and longer-dated bonds are still under pressure, with futures pricing a roughly 70% chance the Fed raises rates at its October 28 meeting. That leaves heavily indebted companies, which have just come through their worst three-month stretch since 2020, with almost nothing to show for the morning; utilities and real estate are barely higher after a rough week. Lower fuel costs help, but they don't refinance a balance sheet. A softer dollar did help gold, which climbed nearly 1% to about $4,300 an ounce and lifted miners Agnico Eagle and Newmont.
The day's big single-stock story is content-delivery and cloud company Akamai, up about 18.5% after AI lab Anthropic agreed to pay it $11.6 billion over seven years for computing services, a rare win for a smaller network over the giant cloud providers. Warehouse retailer Costco slipped slightly despite beating fourth-quarter estimates, largely because much of the beat came from one-off tariff refunds. The next test comes at 10 a.m., when the final University of Michigan consumer survey is expected to confirm a drop in sentiment to about 48 from 52 in August; if its 4.6% one-year inflation expectation gets revised higher, long-term Treasury yields could climb further and keep rate-sensitive stocks on the sidelines.
Front-month WTI is at $92.69 at 7:10 AM ET, -2.03% on the day. CNBC On the sidelines of the UN General Assembly, Qatari mediators hosted US and Iranian negotiators discussing a phased deal. Iran would restore access to the Strait of Hormuz, and the US would lift its blockade of Iranian ports. Bloomberg Energy is taking the hit, with XLE and USO both lower, while the bond selloff has eased. WSJ
Treasuries have stopped falling, but they have not rallied. The 10-year yield is at 5.167%, up 0.5 basis points, after touching its highest level since June 2007. CNBC The 20-year is up 1.1 basis points at 5.532%, while the 2-year is down 1.0 basis point at 4.885%, so pressure is still building at the long end. CNBC Fed funds futures still price a 71% chance of a hike at the October 28 decision. CNBC The dollar index is at 100.967, -0.31% at 7:19 AM ET. CNBC The weaker dollar is helping metals: spot gold is at $4,311.09 at 7:19 AM ET, +0.77%. CNBC
| Factor | Return | Z-Score | 5d Z | 20d Z | 63d Z | Category | Direction |
|---|---|---|---|---|---|---|---|
| Beta | +0.69% | 0.72 | 1.30 | 0.88 | -0.28 | Style-Risk | Market-sensitive names ahead |
| Leverage | +0.09% | 0.52 | -0.88 | -1.14 | -3.37 | Style | Small bounce inside a record slide |
| Short-Term Momentum | -0.04% | -0.14 | 1.39 | -0.53 | -3.60 | Style-Momentum | Flat today |
| Gold | +0.17% | 0.52 | -0.73 | -0.59 | 1.82 | Thematic | Gold-exposed names ahead |
| One-Day Momentum | -0.13% | -0.48 | -0.26 | -1.78 | -1.14 | Style-Momentum | Yesterday's losers ahead |
| Semiconductors | +0.13% | 0.22 | +0.0 | +0.9 | -1.0 | Thematic | Near flat |
| Oil | -0.11% | -0.24 | -0.0 | +0.9 | +1.7 | Thematic | Oil-exposed names lagging |
| Short Interest | -0.05% | -0.29 | -0.13 | -1.53 | -0.85 | Style-Positioning | Most-shorted names lagging |
Beta is up +0.69% at z=+0.72. In thin pre-market trade it explains about 31% of the spread in stock returns, above its 90th percentile for the past year. This extends the move rather than starting one: Beta is up +2.81% over five sessions and +3.78% over twenty. Most of the gainers are moving with the market, not on their own news. FormFactor (FORM) is up +2.46% and Ichor (ICHR) +2.00%, and in both cases the factor model accounts for more than the whole gain. Arm's +4.45% follows the same pattern, with style exposure contributing 2.5 points. The Semiconductors factor is only +0.13%, so chip stocks are rising because they are high-beta, not because of any chip-specific news.
| ETF | Theme | Today | 1d Ago | 5d Ago | 20d Ago | 63d Ago |
|---|---|---|---|---|---|---|
| DRAM | memory chips | +2.31% | -1.91% | +5.09% | +7.68% | -21.03% |
| EWY | South Korea | +1.89% | -1.68% | +0.08% | +1.87% | -10.96% |
| SLV | silver | +1.88% | -0.93% | -2.29% | -6.45% | +10.05% |
| SMH | semiconductors | +1.50% | -0.15% | +7.12% | +8.05% | -5.71% |
| GDX | gold miners | +1.49% | -1.29% | -3.72% | -9.83% | +22.04% |
| TLT | long-term Treasuries | +0.23% | -1.29% | -2.89% | -4.29% | -8.02% |
| XLE | energy | -0.86% | +0.37% | -2.32% | -0.88% | +16.44% |
| VXX | volatility | -1.11% | +0.46% | -0.90% | -5.23% | -24.43% |
| USO | oil | -2.80% | +2.86% | -1.43% | +20.21% | +40.05% |
The table splits into two groups. SMH and DRAM are extending a week of gains. USO is giving back some of a 20-day run of more than 20%. TLT's small gain comes after it lost ground in each of the trailing windows.
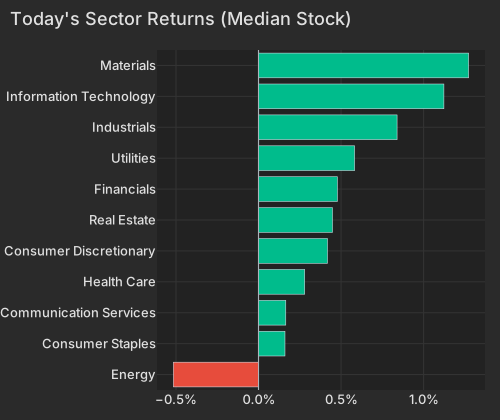
Materials is the best sector, with a median stock return of +1.27%. Gold miners Agnico Eagle (AEM, +2.02%) and Newmont (NEM, +1.03%) are benefiting from the weaker dollar. Corteva (CTVA) is up +3.16% on its own move. Energy is the only sector whose median stock is down.
| Sector | Median Ret Pct |
|---|---|
| Energy | -0.52 |
| Consumer Staples | 0.16 |
| Communication Services | 0.17 |
| Health Care | 0.28 |
| Consumer Discretionary | 0.42 |
| Real Estate | 0.45 |
| Financials | 0.48 |
| Utilities | 0.58 |
| Industrials | 0.84 |
| Information Technology | 1.12 |
| Materials | 1.27 |
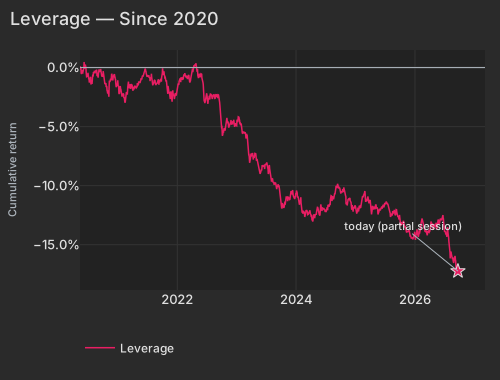
The weak spot this morning is debt-heavy stocks. Leverage is up just +0.09% at z=+0.52. That follows the factor's worst completed 63-day stretch since 2020 (63-day z=-3.37). Cheaper oil lowers input costs, but it does not refinance a balance sheet. With the 20-year yield still rising, the most-levered companies have no reason to rally. Utilities (XLU) and real estate (XLRE) are only slightly higher after a hard week. That is consistent with rate-sensitive stocks waiting for the bond market to turn before they recover.
| Date | Cumret Pct |
|---|---|
| 2020-05-13 | 0.08 |
| 2020-06-05 | -0.06 |
| 2020-06-29 | -0.59 |
| 2020-07-22 | -1.30 |
| 2020-08-13 | -0.49 |
| 2020-09-04 | -0.24 |
| 2020-09-29 | -0.78 |
| 2020-10-21 | -1.65 |
| 2020-11-12 | -1.38 |
| 2020-12-07 | -0.73 |
| 2020-12-30 | -1.30 |
| 2021-01-25 | -2.22 |
| 2021-02-17 | -2.80 |
| 2021-03-11 | -1.76 |
| 2021-04-05 | -1.97 |
| 2021-04-27 | -1.62 |
| 2021-05-19 | -1.23 |
| 2021-06-11 | -0.35 |
| 2021-07-06 | -0.69 |
| 2021-07-28 | -0.78 |
| 2021-08-19 | -1.27 |
| 2021-09-13 | -1.06 |
| 2021-10-05 | -0.37 |
| 2021-10-27 | -1.07 |
| 2021-11-18 | -2.41 |
| 2021-12-13 | -2.39 |
| 2022-01-05 | -1.72 |
| 2022-01-28 | -0.81 |
| 2022-02-22 | -0.76 |
| 2022-03-16 | -0.99 |
| 2022-04-07 | -0.39 |
| 2022-05-02 | -0.36 |
| 2022-05-24 | -0.74 |
| 2022-06-16 | -2.86 |
| 2022-07-12 | -2.66 |
| 2022-08-03 | -2.42 |
| 2022-08-25 | -2.44 |
| 2022-09-19 | -2.63 |
| 2022-10-11 | -5.36 |
| 2022-11-02 | -4.30 |
| 2022-11-25 | -4.65 |
| 2022-12-19 | -4.84 |
| 2023-01-12 | -4.17 |
| 2023-02-06 | -5.27 |
| 2023-03-01 | -6.01 |
| 2023-03-23 | -8.07 |
| 2023-04-17 | -7.59 |
| 2023-05-09 | -7.79 |
| 2023-06-01 | -8.85 |
| 2023-06-26 | -8.32 |
| 2023-07-19 | -8.62 |
| 2023-08-10 | -9.44 |
| 2023-09-01 | -10.04 |
| 2023-09-26 | -10.64 |
| 2023-10-18 | -11.81 |
| 2023-11-09 | -10.93 |
| 2023-12-04 | -10.46 |
| 2023-12-27 | -11.07 |
| 2024-01-22 | -11.47 |
| 2024-02-13 | -12.16 |
| 2024-03-07 | -12.23 |
| 2024-04-01 | -12.35 |
| 2024-04-23 | -12.42 |
| 2024-05-15 | -11.84 |
| 2024-06-07 | -11.96 |
| 2024-07-02 | -12.18 |
| 2024-07-25 | -11.78 |
| 2024-08-16 | -11.05 |
| 2024-09-10 | -10.15 |
| 2024-10-02 | -10.48 |
| 2024-10-24 | -10.21 |
| 2024-11-15 | -11.22 |
| 2024-12-10 | -11.86 |
| 2025-01-03 | -11.82 |
| 2025-01-29 | -11.94 |
| 2025-02-21 | -10.78 |
| 2025-03-17 | -11.16 |
| 2025-04-08 | -11.77 |
| 2025-05-01 | -11.88 |
| 2025-05-23 | -12.31 |
| 2025-06-17 | -11.90 |
| 2025-07-11 | -11.40 |
| 2025-08-04 | -12.27 |
| 2025-08-26 | -12.25 |
| 2025-09-18 | -12.64 |
| 2025-10-10 | -13.16 |
| 2025-11-03 | -13.51 |
| 2025-11-25 | -13.93 |
| 2025-12-18 | -14.47 |
| 2026-01-13 | -14.11 |
| 2026-02-05 | -13.67 |
| 2026-03-02 | -13.56 |
| 2026-03-24 | -13.92 |
| 2026-04-16 | -13.23 |
| 2026-05-08 | -13.46 |
| 2026-06-02 | -12.97 |
| 2026-06-25 | -12.49 |
| 2026-07-20 | -14.34 |
| 2026-08-11 | -15.95 |
| 2026-09-02 | -16.45 |
| 2026-09-25 | -17.24 |
The 5-day factor (Short-Term Momentum in the table) shows a similar pattern. For three months, last week's winners have tended to fall back the next week (63-day z=-3.60). Over the past five sessions that flipped, and last week's winners kept rising (5-day z=+1.39). Its stock exposures correlate 0.41 with Beta's, so the recent continuation and the Beta run are largely the same high-beta stocks. Today the factor is flat at -0.04%.
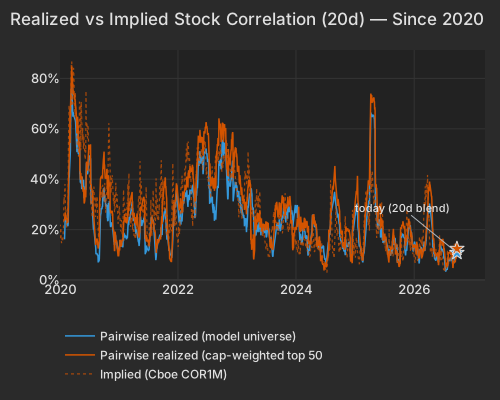
Implied single-stock volatility (Cboe VIXEQ) is at 39.16, the top of its 20-session range. Implied index volatility (Cboe VIX) is only 15.32. Implied dispersion (Cboe DSPX) is at 35.94, in the 94.8th percentile of its history. Options are pricing large moves in individual stocks that largely cancel out at the index level. Implied single-stock correlation (Cboe COR1M) is at 9.17, lower than 97% of its 20-year history. Realized 20-day correlation among S&P 500 stocks is 12.44%, so options price correlation below what has actually happened. Over the past five days, realized correlation has risen to 15.54%, near its highest in three months, as the bond selloff moved stocks together.
| Series | Today Pct | Prev Close Pct |
|---|---|---|
| pairwise_model | 10.82 | 9.74 |
| pairwise_top500 | 12.44 | 10.75 |
| implied_cor1m |
Akamai is up +18.53%, adding $2.74B of market value. Anthropic will pay it $11.6 billion over seven years for distributed cloud and compute services. WSJ The deal sends AI lab workloads to an edge network instead of one of the hyperscale cloud providers. WSJ The stock gave back -3.44% in the last hour of pre-market trading.
Costco (COST) is down -0.15% after a fourth-quarter beat. Much of the beat came from non-recurring tariff refunds. WSJ The factor model explains the small decline: Costco's low-beta, large-cap profile is lagging on a high-beta morning. BlackRock (BLK) is down -2.06%, erasing $3.47B of market value, and the cause is not yet in the news coverage.
The final University of Michigan consumer survey is due at 10:00 AM ET data.sca.isr.umich.edu. Consensus expects it to confirm September's preliminary reading of 47.8, down from 51.7 in August. The preliminary report put one-year inflation expectations at 4.6%, so any upward revision would bear on the long end of the Treasury curve, where yields are still rising.
Variance decomposition: live intraday — 20260925 session, bracketed against its trailing-year range. Factor returns are trailing through last close. Total cross-sectional dispersion: 1.2%ile of the past year.
Variance mix — % of total, today vs 1d ago vs 1-yr avg
market 91.2%ile style 90.4%ile thematic 27%ile idiosyncratic 4.0%ile
Variance explained — today vs. factor's trailing-year range
Marker = the factor's share of today's total variance, placed in its own trailing-year range (box 25–75%ile, ticks 90%ile and max). Amber marker = unusually load-bearing today (≥90%ile of its own year). Factor name green = up today / red = down.
Correlation & dispersion — realized vs implied
Pairwise realized correlation (20d): 10.82% 11%ile since 2020 · 90.5%ile 3m
Top-500 pairwise: 12.44% 14%ile since 2020 · 90.5%ile 3m · implied (Cboe COR1M): 9.17 2.9%ile of its own history (gap +3.3pp)
Realized 20d vol (ann. pts): all stocks 38 vs VIXEQ 39 · index 11 vs VIX 15 · style factors 19 66%ile
20-day window (19 completed days + today); percentiles vs model history since 2020; '3m' tokens rank vs the trailing 63 trading days; definitions in Terms below. Implied prints (Cboe) are delayed ~15 min. as of 06:39 ET
Top 50 high-beta momentum names (eq-wt, since-2020 rank): +2.0% 77%ile · rest of market +0.3%
| Factor | Today | 1d | 5d | 20d | 60d |
|---|---|---|---|---|---|
| Style-Risk | |||||
| Beta | +0.69% z+0.7 | -0.02% | +2.81% | +3.78% | -2.92% |
| International | +0.05% z+0.2 | -0.16% | -0.22% | +0.62% | +1.89% |
| Residual Volatility | +0.04% z+0.1 | +0.10% | +0.70% | +1.20% | +3.60% |
| Style | |||||
| Leverage | +0.09% z+0.5 | -0.18% | -0.33% | -0.85% | -3.65% |
| Value | -0.05% z-0.2 | -0.28% | -0.26% | +0.14% | +0.20% |
| Growth | -0.05% z-0.2 | +0.22% | +0.26% | -0.23% | +1.37% |
| Profitability | +0.04% z+0.2 | -0.27% | +0.03% | -0.34% | -1.91% |
| Liquidity | +0.02% z+0.1 | +0.10% | -0.06% | +1.44% | +2.98% |
| Dividend Yield | +0.01% z+0.0 | -0.10% | -0.32% | +0.05% | +0.25% |
| Size | +0.01% z+0.0 | +0.27% | +0.72% | +3.07% | +2.70% |
| Style-Momentum | |||||
| One-Day Momentum | -0.13% z-0.5 | -0.03% | -0.16% | -2.24% | -2.91% |
| Medium-Term Momentum | -0.09% z-0.3 | +0.09% | +0.01% | -0.75% | -0.76% |
| Short-Term Momentum | -0.04% z-0.1 | +0.25% | +0.95% | -0.72% | -8.56% |
| Long-Term Momentum | +0.06% z+0.1 | +0.38% | +0.54% | +3.02% | -2.56% |
| Style-Positioning | |||||
| Hedge-Fund Ownership | -0.03% z-0.3 | +0.03% | +0.04% | -0.55% | +0.04% |
| Short Interest | -0.05% z-0.3 | +0.01% | -0.05% | -1.14% | -1.46% |
| Style-Flow | |||||
| Short-Sale Activity | -0.03% z-0.3 | -0.24% | -0.18% | +0.65% | +0.97% |
| Morning Activity | +0.02% z+0.2 | +0.11% | -0.27% | -0.09% | +1.99% |
| Thematic | |||||
| Gold | +0.17% z+0.5 | +0.08% | -0.53% | -0.86% | +5.05% |
| Oil | -0.11% z-0.2 | +0.24% | -0.05% | +1.92% | +5.63% |
| Semiconductors | +0.13% z+0.2 | -0.01% | +0.05% | +2.34% | -3.43% |
| Treasury (Duration) | -0.03% z-0.1 | -0.05% | -0.11% | -1.40% | -1.07% |
| China | -0.03% z-0.1 | +0.08% | +0.00% | -0.06% | +1.88% |
| Bitcoin / Crypto | -0.00% z-0.0 | +0.04% | +0.11% | +1.28% | +2.95% |
5/20/60d windows include today's session; 1d is the previous session.
Pairwise realized correlation. Index variance net of the weighted idiosyncratic diagonal, over the cross terms — the estimator used for implied-correlation indices. 20-day window unless noted; history since 2020.
Factor z-score. Today's factor return divided by its daily-return standard deviation over ~1,600 trading days.
Dispersion (realized). Total cross-sectional volatility net of the market component; high dispersion is the flip side of low correlation.
VIXEQ / DSPX / COR1M. Cboe implied indices: single-stock volatility, dispersion, and 1-month implied correlation (top-50 S&P names). Quotes delayed ~15 minutes.
Data compiled by FactorPulse AI; edited and verified by Jeff Klein. For informational purposes only. Does not constitute financial advice, an investment recommendation, or an offer to buy or sell any securities. Always consult a qualified financial professional before making investment decisions.
For more on factor construction methodology, see www.factorpulse.com/glossary.